| Param | Original file | Final file |
|---|---|---|
| Filename | modeM0/AS1C07_001T01_9000006450_50789cztM0_level2.fits | modeM0/AS1C07_001T01_9000006450_50789cztM0_level2_quad_clean.evt |
| Size (bytes) | 911,010,240 | 89,550,720 |
| Size | 868.8 MB | 85.4 MB |
| Events in quadrant A | 4,329,016 | 707,285 |
| Events in quadrant B | 3,589,235 | 776,862 |
| Events in quadrant C | 18,302,060 | 97,965 |
| Events in quadrant D | 6,902,158 | 590,786 |
| Mode SS | |||
|---|---|---|---|
| Quadrant | BADHDUFLAG | Total packets | Discarded packets |
| A | 0 | 156 | 0 |
| B | 0 | 156 | 0 |
| C | 0 | 156 | 0 |
| D | 0 | 156 | 0 |
| Mode M0 | |||
|---|---|---|---|
| Quadrant | BADHDUFLAG | Total packets | Discarded packets |
| A | 0 | 18317 | 0 |
| B | 0 | 16456 | 0 |
| C | 0 | 59563 | 0 |
| D | 0 | 25895 | 1 |
| Quadrant | Total seconds | Saturated seconds | Saturation percentage |
|---|---|---|---|
| A | 7734 | 97 | 1.254202% |
| B | 7734 | 39 | 0.504267% |
| C | 7735 | 6900 | 89.204913% |
| D | 7734 | 745 | 9.632790% |
Noise dominated data is calculated using 1-second bins in cleaned event files. If a bin has >2000 counts, and if more than 50% of those come from <1% of pixels, then it is considered to be noise-dominated and hence unusable.
| Quadrant | # 1 sec bins | Bins with >0 counts | Bins with >2000 counts | High rate bins dominated by noise | Noise dominated (total time) | Noise dominated (detector-on time) | Marked lightcurve |
|---|---|---|---|---|---|---|---|
| A | 7734 | 7734 | 71 | 71 | 0.92% | 0.92% | 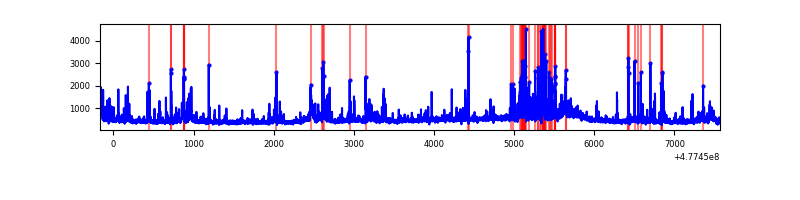 |
| B | 7734 | 7734 | 13 | 13 | 0.17% | 0.17% | 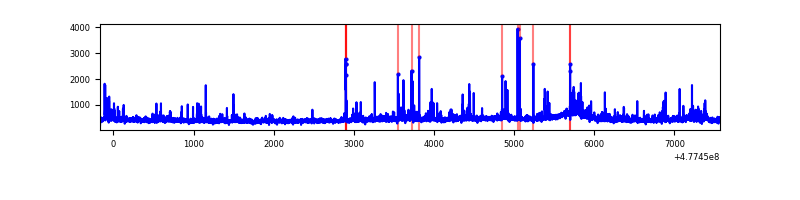 |
| C | 7734 | 7734 | 6554 | 6554 | 84.74% | 84.74% | 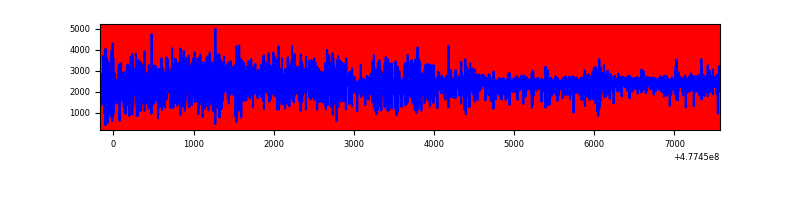 |
| D | 7734 | 7734 | 668 | 668 | 8.64% | 8.64% | 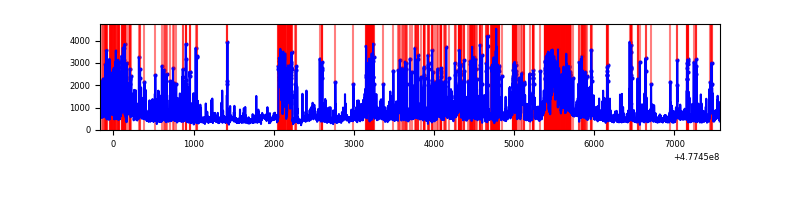 |
Top three noisy pixels from each quadrant. If the there are fewer than three noisy pixels in the level2.evt file, extra rows are filled as -1
| Pixel properties | Quadrant properties | ||||||
|---|---|---|---|---|---|---|---|
| Quadrant | DetID | PixID | Counts | Sigma | Mean | Median | Sigma |
| A | 4 | 249 | 213762 | 1074.87 | 797 | 777 | 198.1 |
| A | 8 | 247 | 127860 | 641.35 | 797 | 777 | 198.1 |
| A | 4 | 3 | 98577 | 493.57 | 797 | 777 | 198.1 |
| B | 8 | 128 | 58004 | 332.98 | 802 | 773 | 171.9 |
| B | 4 | 170 | 42649 | 243.64 | 802 | 773 | 171.9 |
| B | 6 | 51 | 40876 | 233.32 | 802 | 773 | 171.9 |
| C | 5 | 10 | 9775272 | 84451.75 | 412 | 407 | 115.7 |
| C | 1 | 44 | 4510243 | 38963.56 | 412 | 407 | 115.7 |
| C | 4 | 210 | 1325422 | 11447.71 | 412 | 407 | 115.7 |
| D | 2 | 216 | 544775 | 2615.81 | 739 | 715 | 208.0 |
| D | 7 | 126 | 543350 | 2608.96 | 739 | 715 | 208.0 |
| D | 15 | 108 | 341611 | 1639.01 | 739 | 715 | 208.0 |
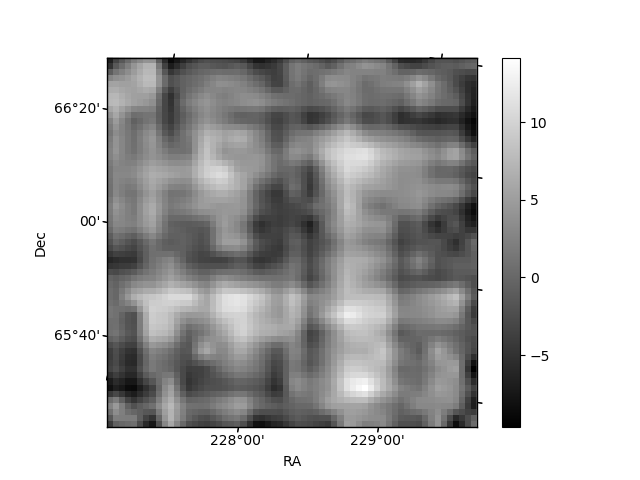
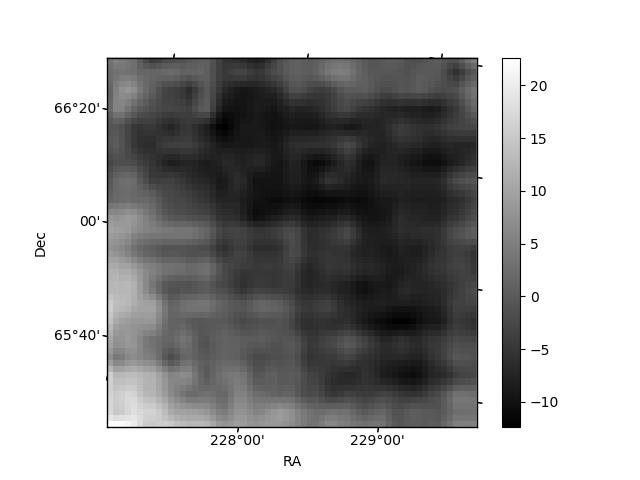
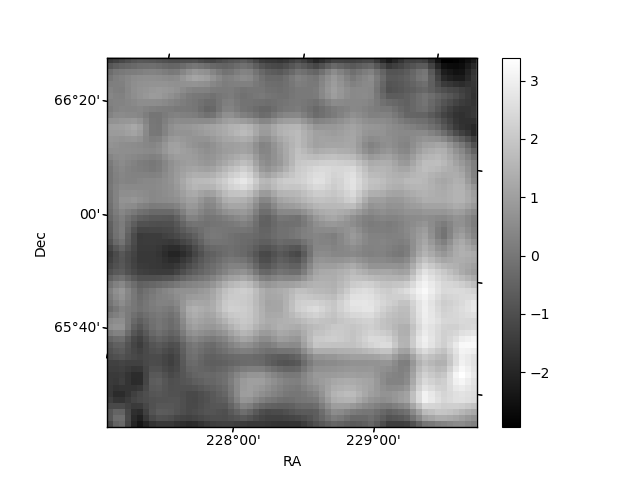
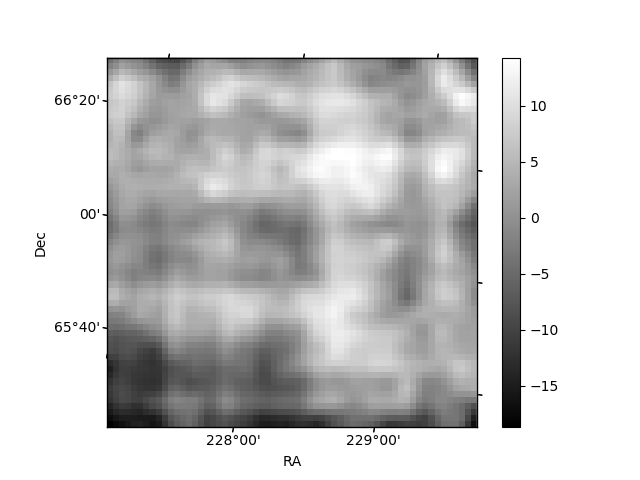
Histogram calculated using DETX and DETY for each event in the final _common_clean file
| Quadrant A | 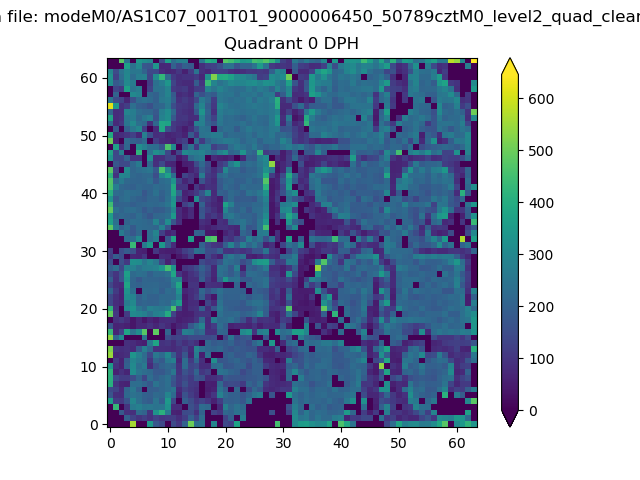 |
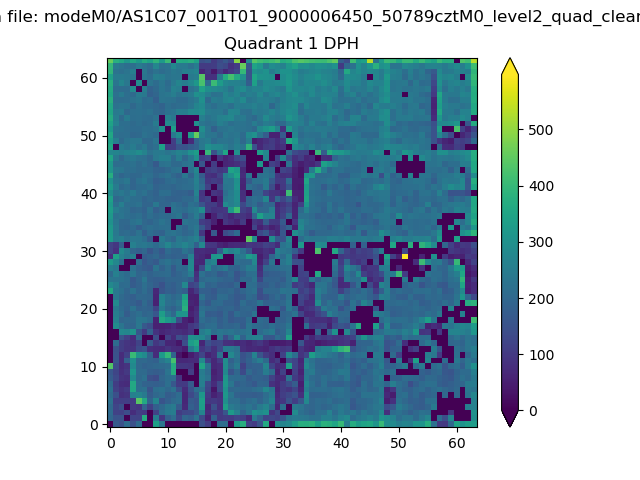 |
Quadrant B |
|---|---|---|---|
| Quadrant D | 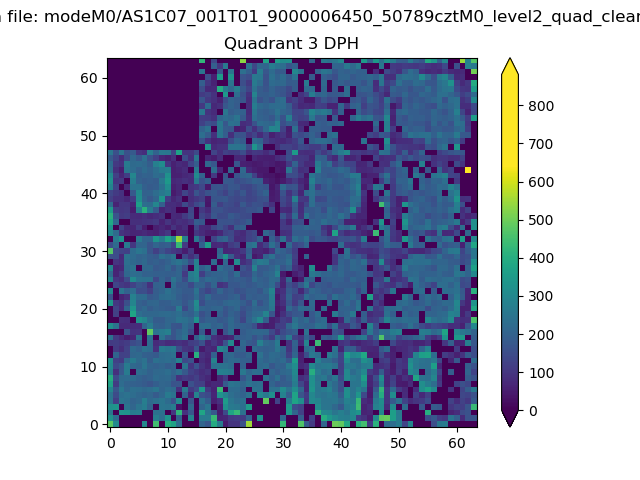 |
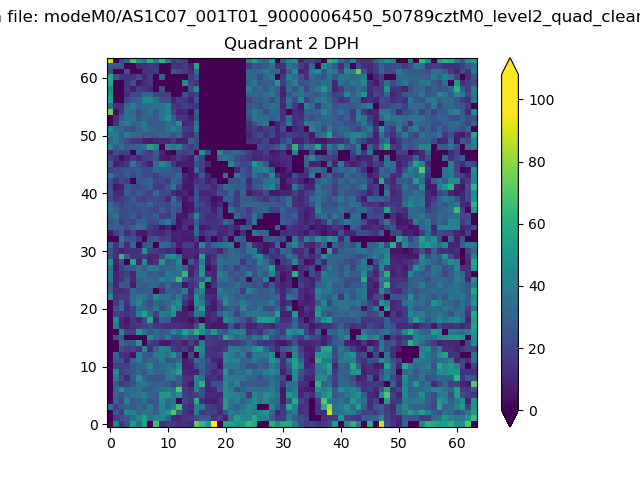 |
Quadrant C |
| Plot type | Count rate plots | Images |
|---|---|---|
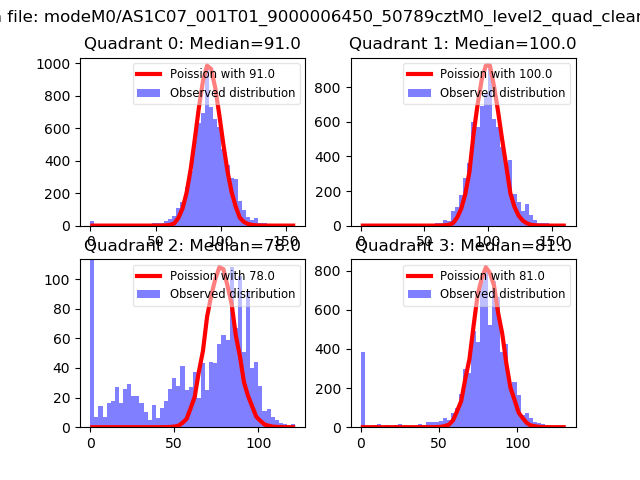
| Comparison with Poisson distribution Blue bars denote a histogram of data divided into 1 sec bins. Red curve is a Poisson curve with rate = median count rate of data. |
 |
 |
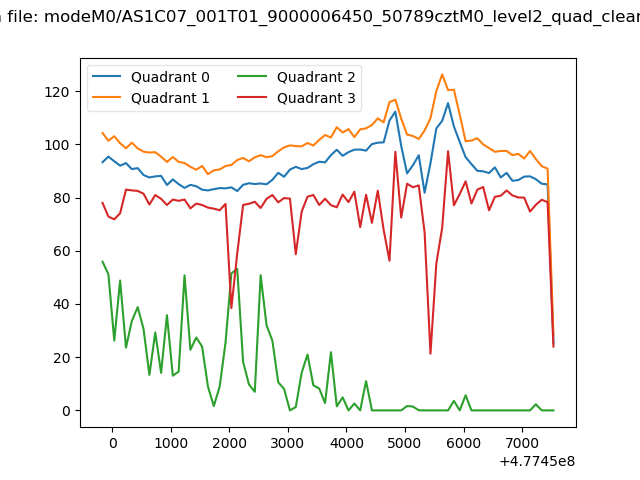
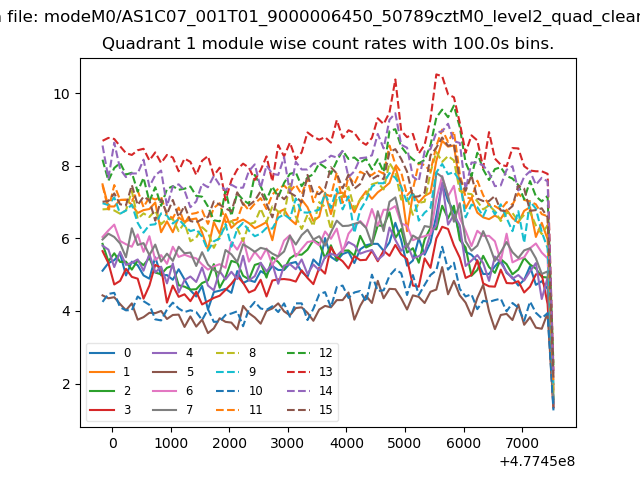
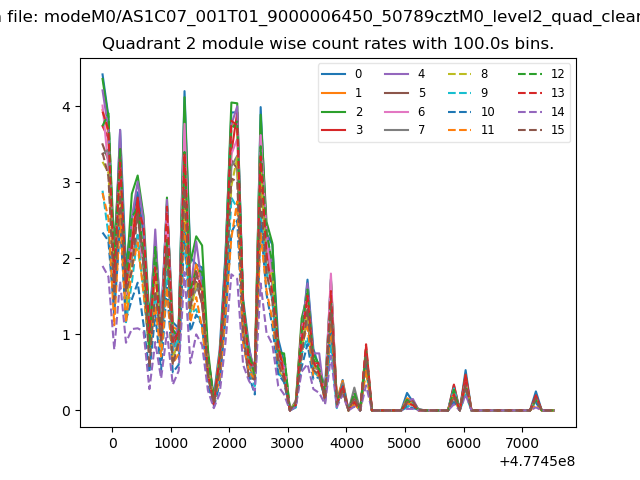
| Quadrant-wise count rates Data is divided into 100 sec bins |
 |
|
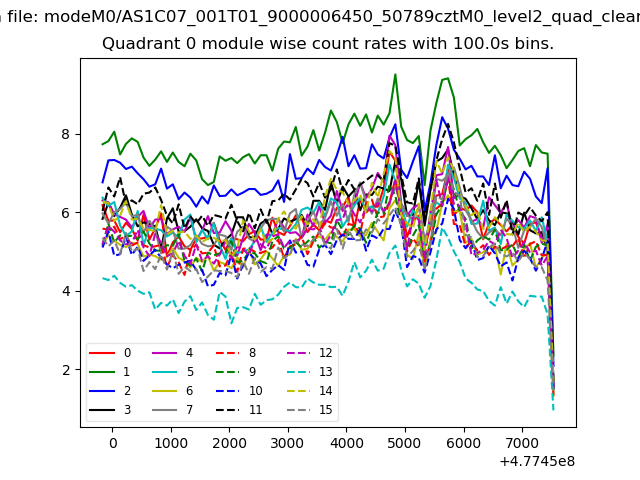
| Module-wise count rates for Quadrant A Data is divided into 100 sec bins |
 |
 |
| Module-wise count rates for Quadrant B Data is divided into 100 sec bins |
 |
 |
| Module-wise count rates for Quadrant C Data is divided into 100 sec bins |
 |
 |
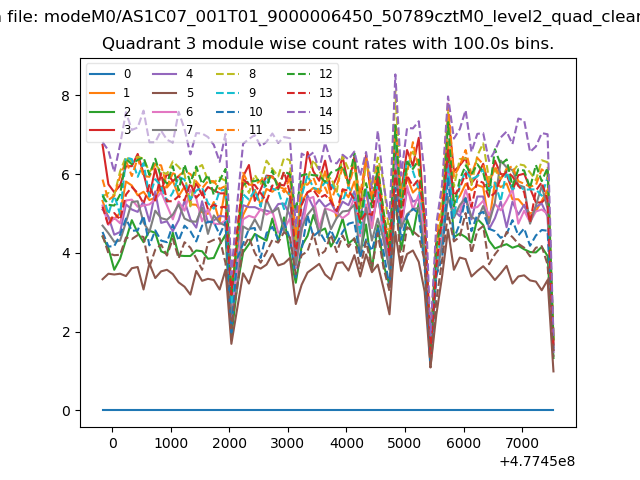
| Module-wise count rates for Quadrant D Data is divided into 100 sec bins |
 |
 |
| Parameter | Plot |
|---|---|
| CZT HV Monitor | 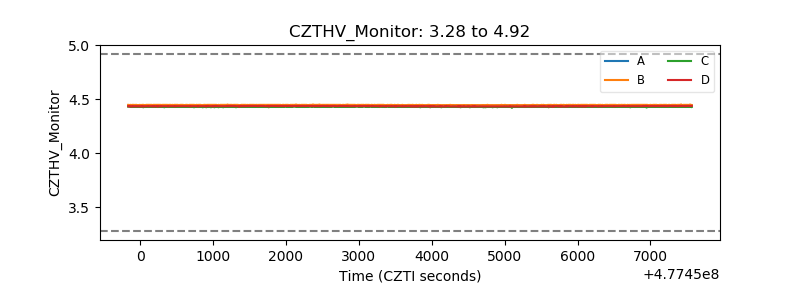 |
| D_VDD | 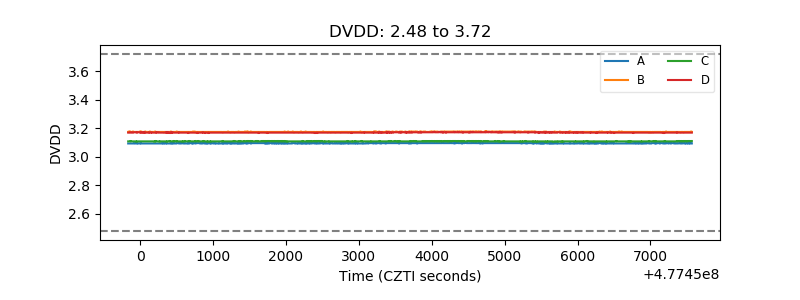 |
| Temperature 1 | 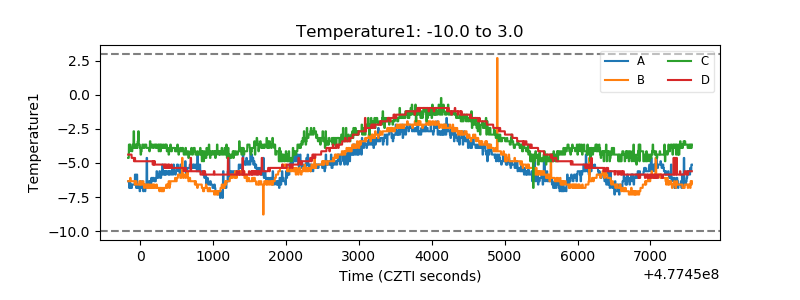 |
| Veto HV Monitor | 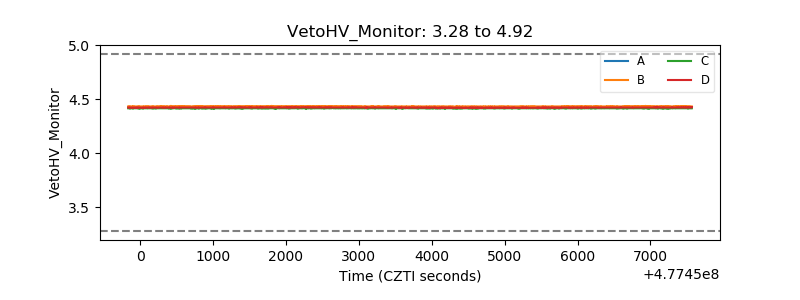 |
| Veto LLD | 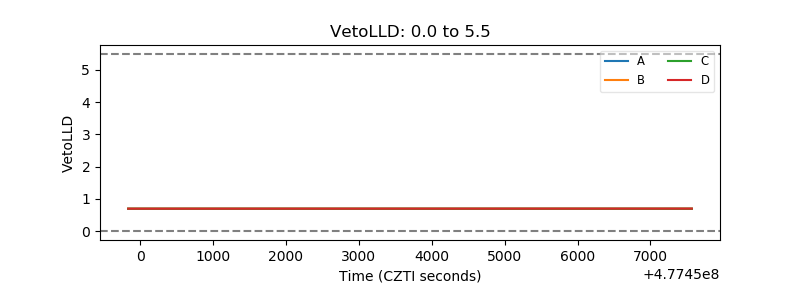 |
| Alpha Counter | 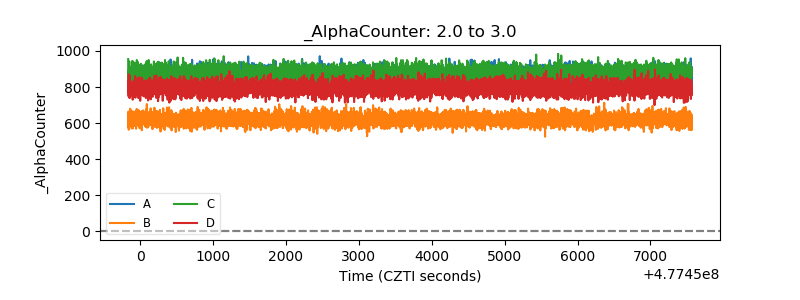 |
| _CPM_Rate | 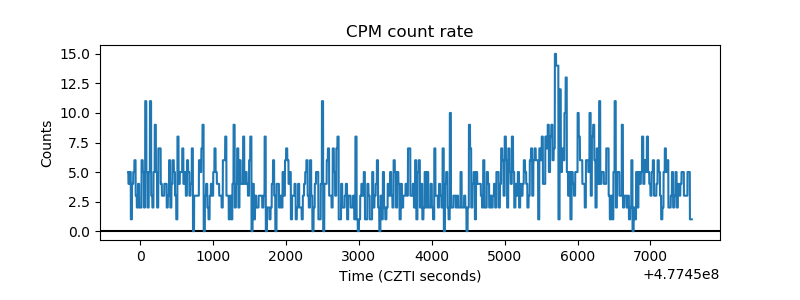 |
| CZT Counter | 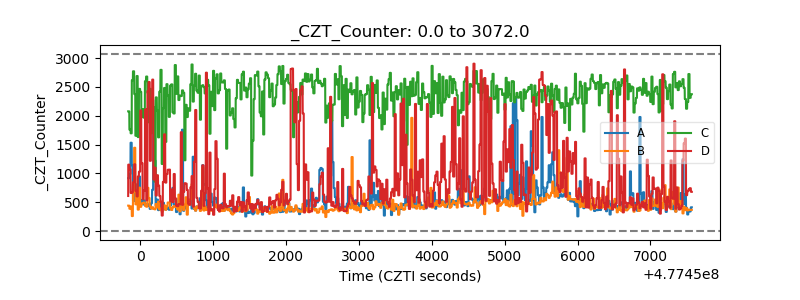 |
| +2.5 Volts monitor |  |
| +5 Volts monitor |  |
| _ROLL_ROT | 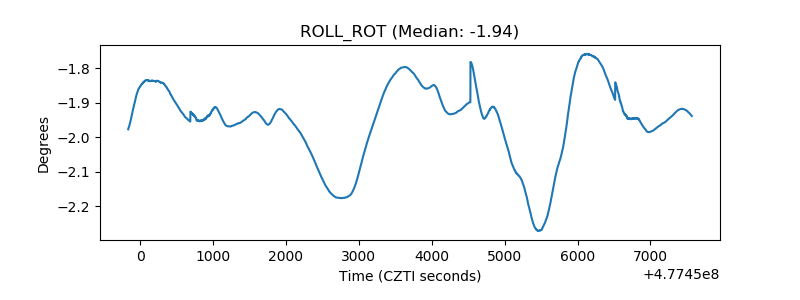 |
| _Roll_DEC | 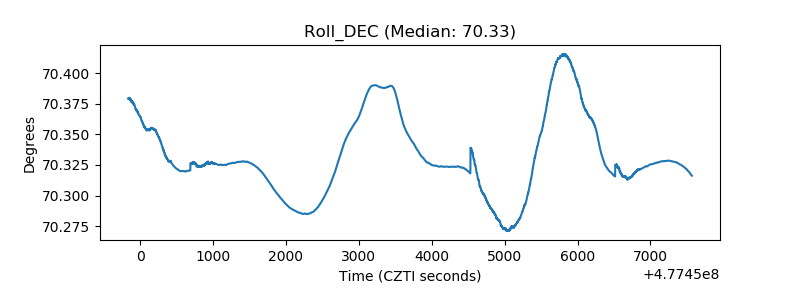 |
| _Roll_RA | 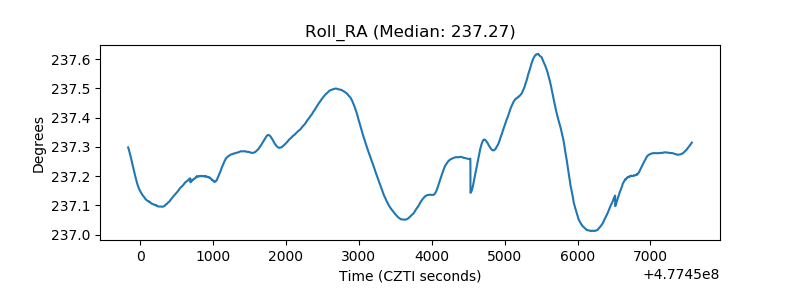 |
| Veto Counter | 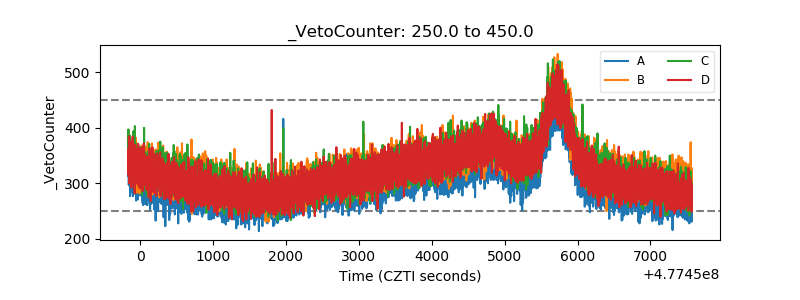 |