| Param | Original file | Final file |
|---|---|---|
| Filename | modeM0/AS1C07_001T01_9000006450_50792cztM0_level2.fits | modeM0/AS1C07_001T01_9000006450_50792cztM0_level2_quad_clean.evt |
| Size (bytes) | 1,928,695,680 | 243,325,440 |
| Size | 1.8 GB | 232.1 MB |
| Events in quadrant A | 11,681,126 | 1,688,430 |
| Events in quadrant B | 10,553,335 | 1,896,492 |
| Events in quadrant C | 33,579,088 | 932,367 |
| Events in quadrant D | 14,091,651 | 1,520,306 |
| Mode SS | |||
|---|---|---|---|
| Quadrant | BADHDUFLAG | Total packets | Discarded packets |
| A | 0 | 390 | 0 |
| B | 0 | 390 | 0 |
| C | 0 | 390 | 0 |
| D | 0 | 390 | 0 |
| Mode M0 | |||
|---|---|---|---|
| Quadrant | BADHDUFLAG | Total packets | Discarded packets |
| A | 0 | 48028 | 3 |
| B | 0 | 45380 | 3 |
| C | 0 | 113027 | 3 |
| D | 0 | 55320 | 3 |
| Mode M9 | |||
|---|---|---|---|
| Quadrant | BADHDUFLAG | Total packets | Discarded packets |
| A | 0 | 10 | 0 |
| B | 0 | 10 | 0 |
| C | 0 | 10 | 0 |
| D | 0 | 10 | 0 |
| Quadrant | Total seconds | Saturated seconds | Saturation percentage |
|---|---|---|---|
| A | 19288 | 837 | 4.339486% |
| B | 19289 | 519 | 2.690653% |
| C | 19289 | 8943 | 46.363212% |
| D | 19289 | 849 | 4.401472% |
Noise dominated data is calculated using 1-second bins in cleaned event files. If a bin has >2000 counts, and if more than 50% of those come from <1% of pixels, then it is considered to be noise-dominated and hence unusable.
| Quadrant | # 1 sec bins | Bins with >0 counts | Bins with >2000 counts | High rate bins dominated by noise | Noise dominated (total time) | Noise dominated (detector-on time) | Marked lightcurve |
|---|---|---|---|---|---|---|---|
| A | 20328 | 19290 | 492 | 492 | 2.42% | 2.55% | 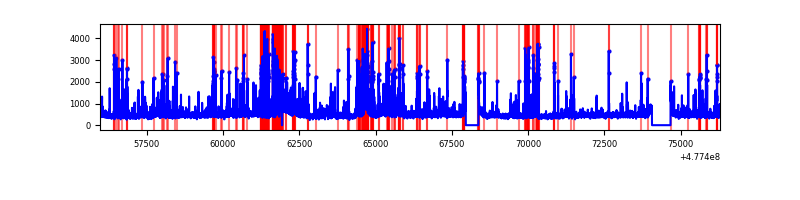 |
| B | 20329 | 19290 | 199 | 199 | 0.98% | 1.03% | 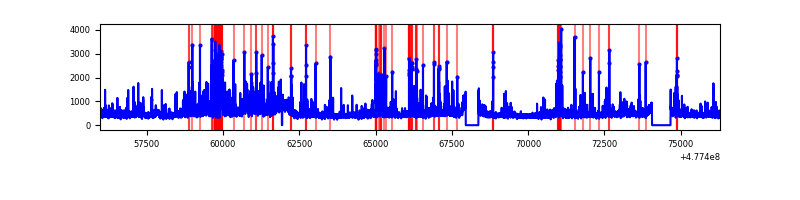 |
| C | 20329 | 19290 | 7990 | 7990 | 39.30% | 41.42% | 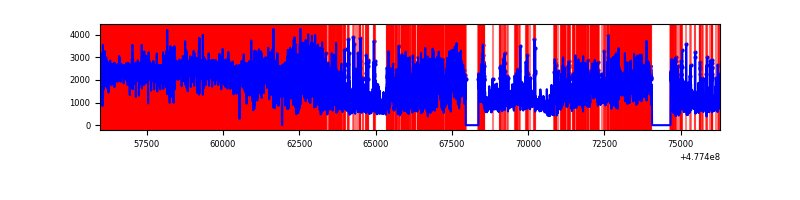 |
| D | 20329 | 19291 | 666 | 666 | 3.28% | 3.45% | 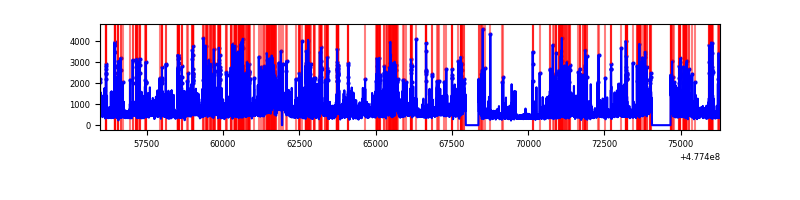 |
Top three noisy pixels from each quadrant. If the there are fewer than three noisy pixels in the level2.evt file, extra rows are filled as -1
| Pixel properties | Quadrant properties | ||||||
|---|---|---|---|---|---|---|---|
| Quadrant | DetID | PixID | Counts | Sigma | Mean | Median | Sigma |
| A | 4 | 249 | 1631917 | 3238.82 | 2017 | 1964 | 503.3 |
| A | 11 | 3 | 638180 | 1264.2 | 2017 | 1964 | 503.3 |
| A | 4 | 3 | 212887 | 419.12 | 2017 | 1964 | 503.3 |
| B | 4 | 170 | 668038 | 1547.66 | 2022 | 1952 | 430.4 |
| B | 5 | 185 | 493745 | 1142.68 | 2022 | 1952 | 430.4 |
| B | 4 | 206 | 346625 | 800.85 | 2022 | 1952 | 430.4 |
| C | 5 | 10 | 12261562 | 29586.02 | 1487 | 1472 | 414.4 |
| C | 1 | 44 | 7077200 | 17075.13 | 1487 | 1472 | 414.4 |
| C | 4 | 210 | 2279488 | 5497.3 | 1487 | 1472 | 414.4 |
| D | 2 | 249 | 1152792 | 2119.56 | 1943 | 1875 | 543.0 |
| D | 2 | 216 | 941317 | 1730.1 | 1943 | 1875 | 543.0 |
| D | 7 | 126 | 834715 | 1533.78 | 1943 | 1875 | 543.0 |
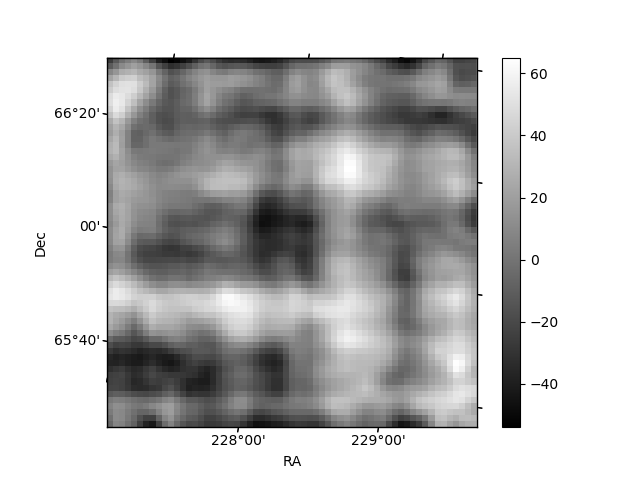
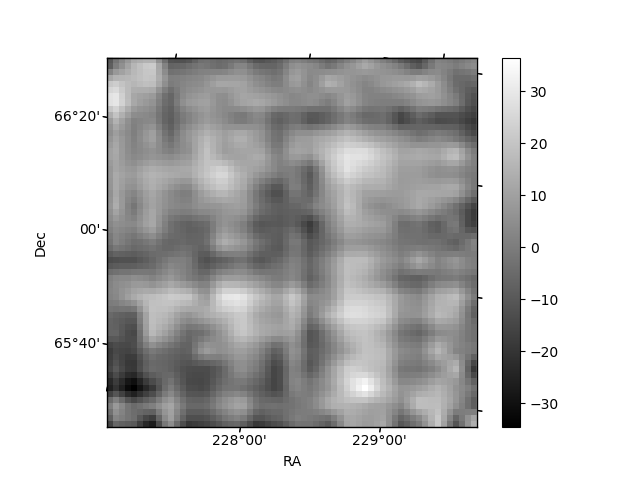
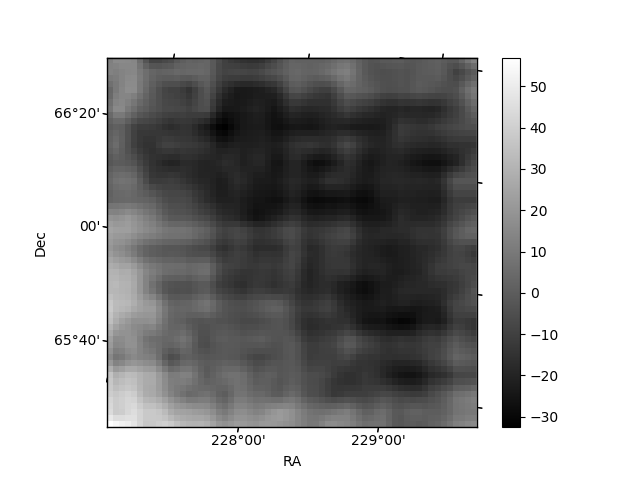
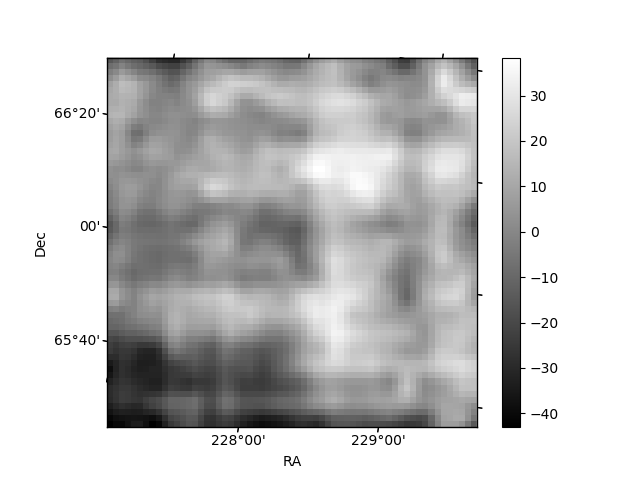
Histogram calculated using DETX and DETY for each event in the final _common_clean file
| Quadrant A | 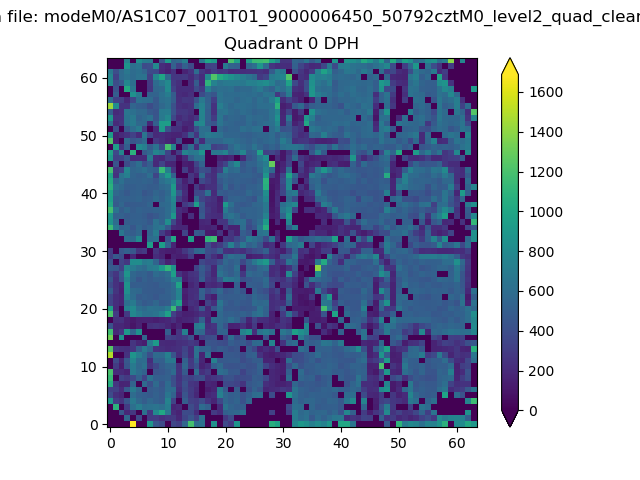 |
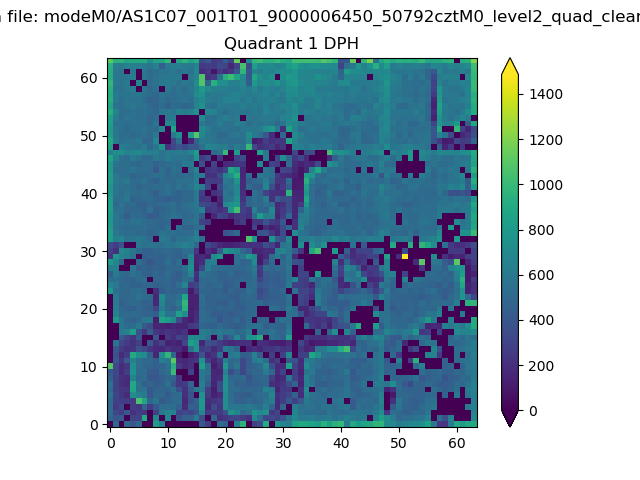 |
Quadrant B |
|---|---|---|---|
| Quadrant D | 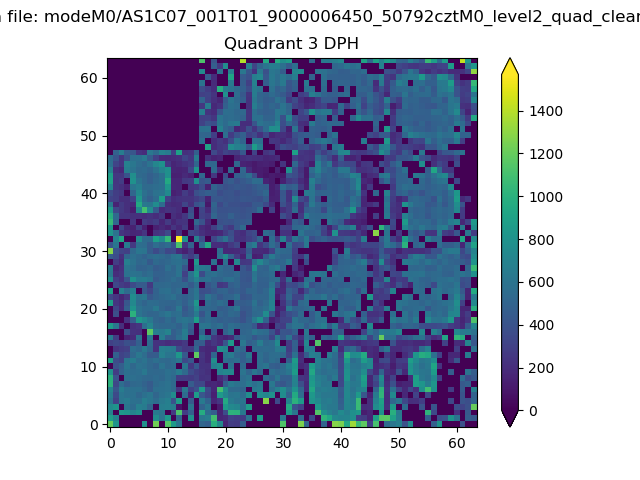 |
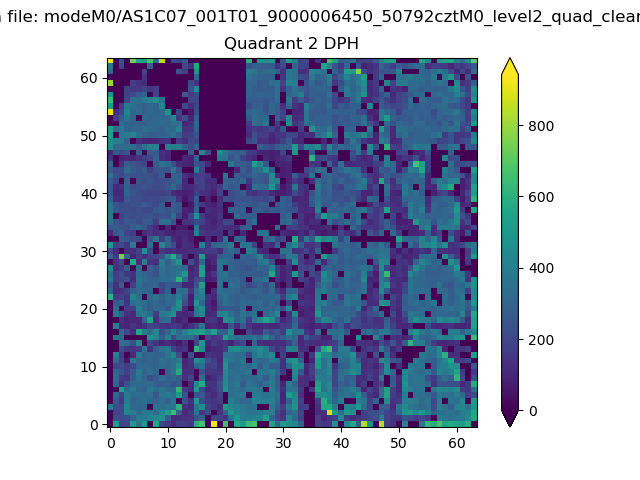 |
Quadrant C |
| Plot type | Count rate plots | Images |
|---|---|---|
| Comparison with Poisson distribution Blue bars denote a histogram of data divided into 1 sec bins. Red curve is a Poisson curve with rate = median count rate of data. |
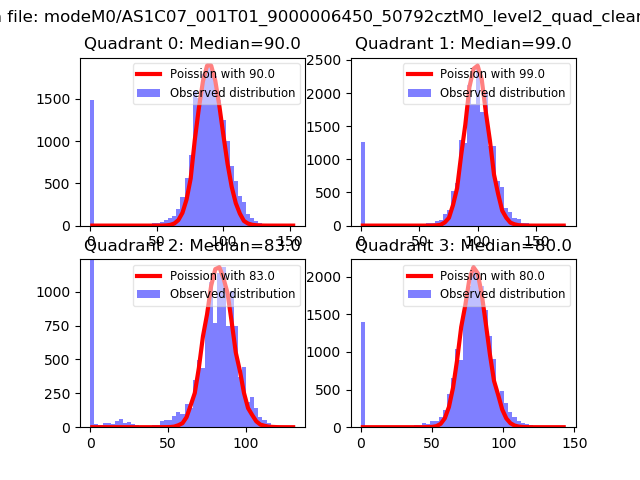 |
 |
| Quadrant-wise count rates Data is divided into 100 sec bins |
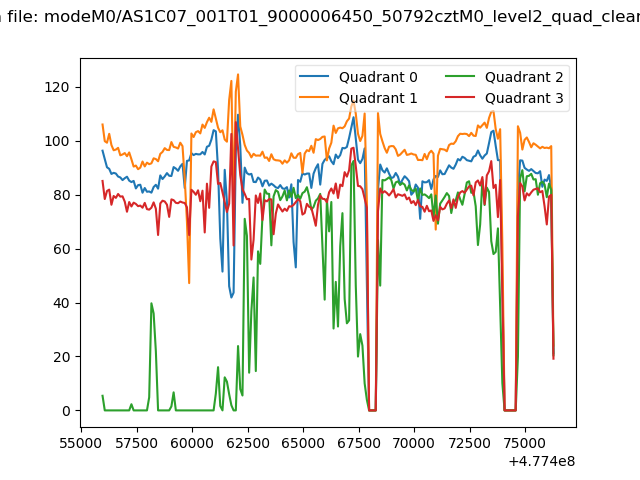 |
|
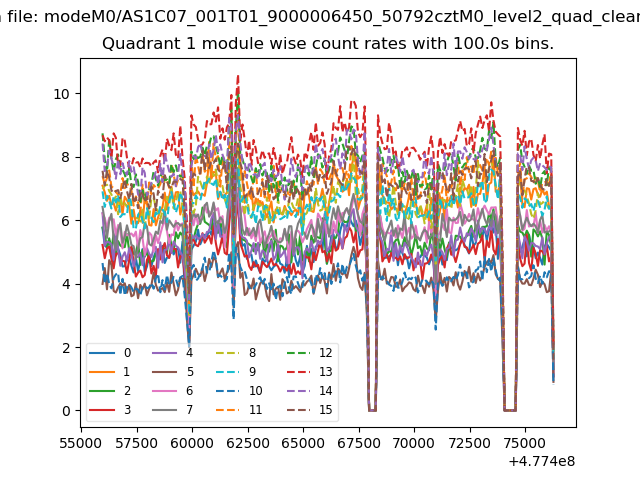
| Module-wise count rates for Quadrant A Data is divided into 100 sec bins |
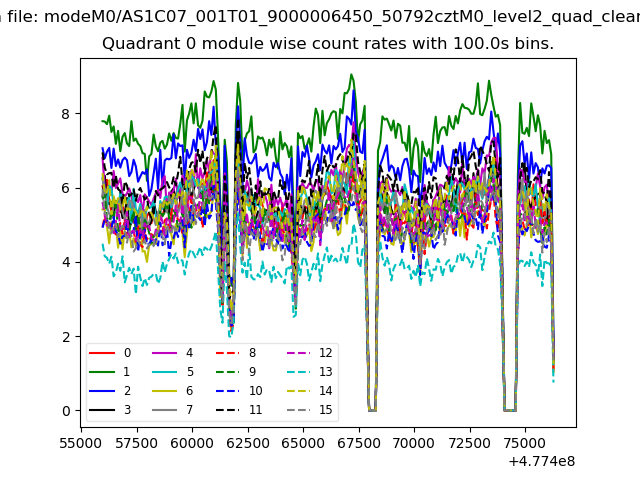 |
 |
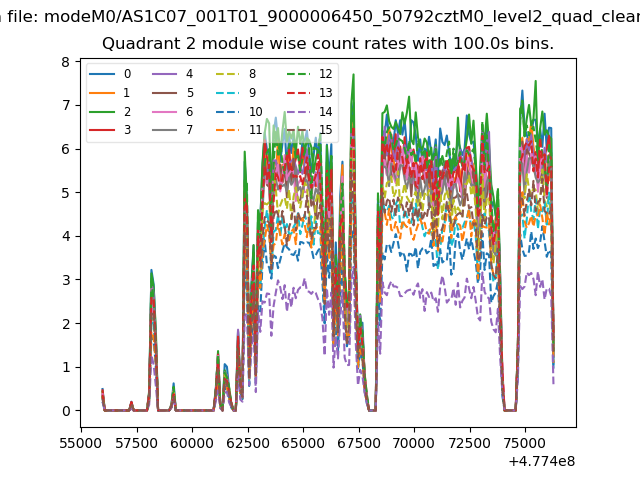
| Module-wise count rates for Quadrant B Data is divided into 100 sec bins |
 |
 |
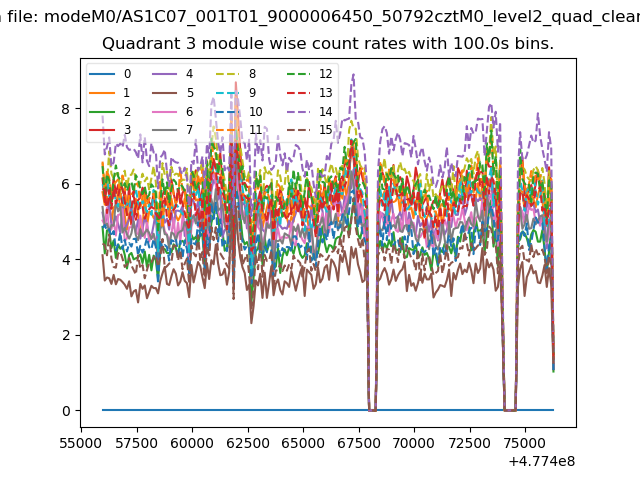
| Module-wise count rates for Quadrant C Data is divided into 100 sec bins |
 |
 |
| Module-wise count rates for Quadrant D Data is divided into 100 sec bins |
 |
 |
| Parameter | Plot |
|---|---|
| CZT HV Monitor | 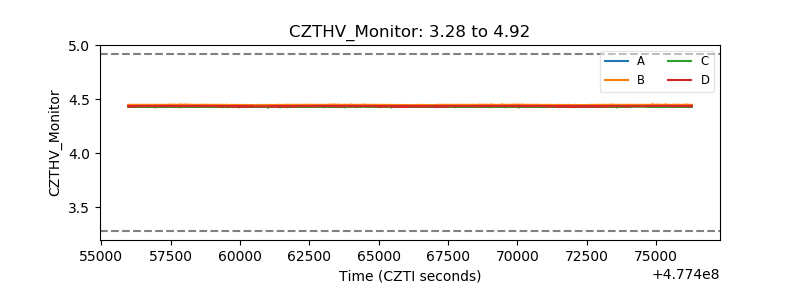 |
| D_VDD | 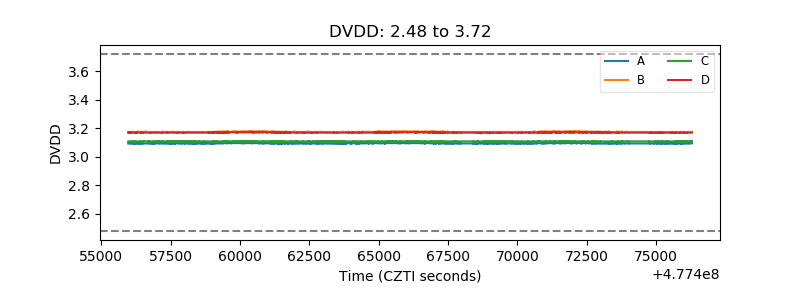 |
| Temperature 1 | 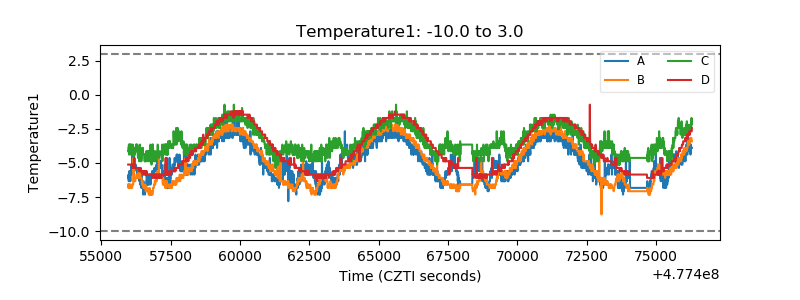 |
| Veto HV Monitor | 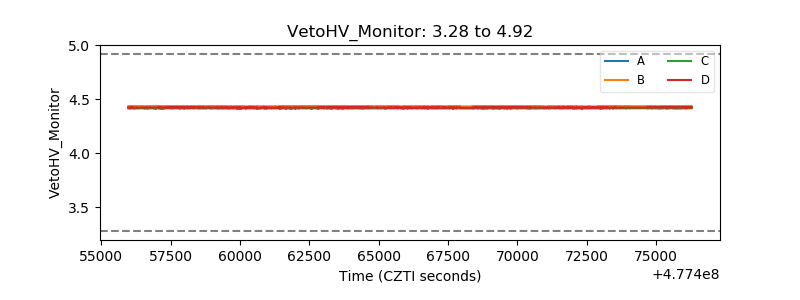 |
| Veto LLD | 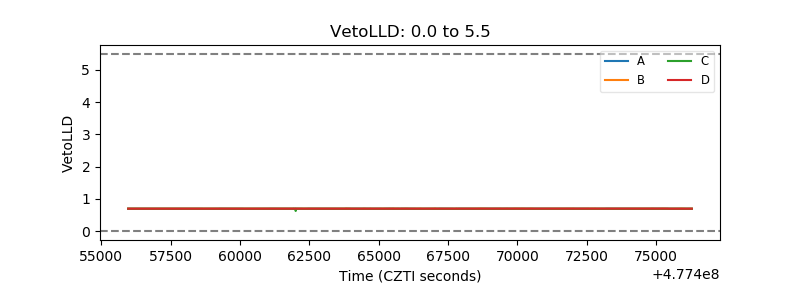 |
| Alpha Counter | 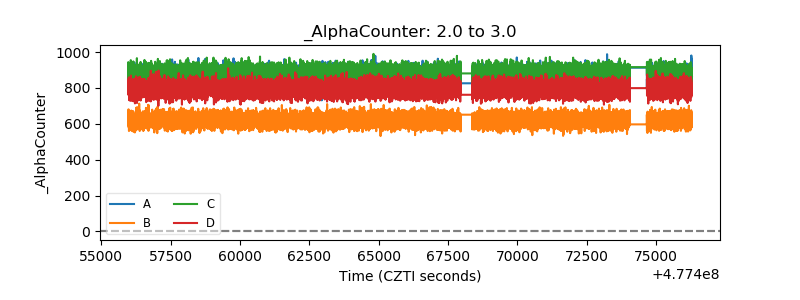 |
| _CPM_Rate | 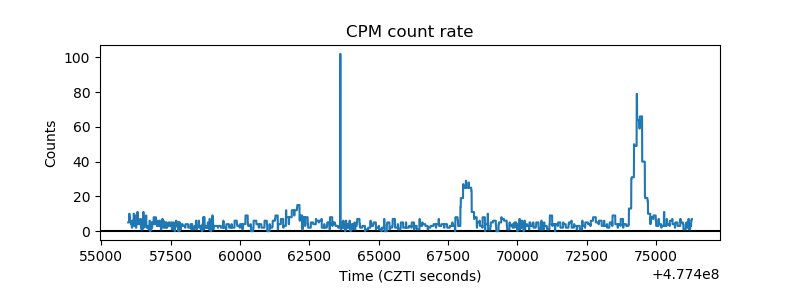 |
| CZT Counter | 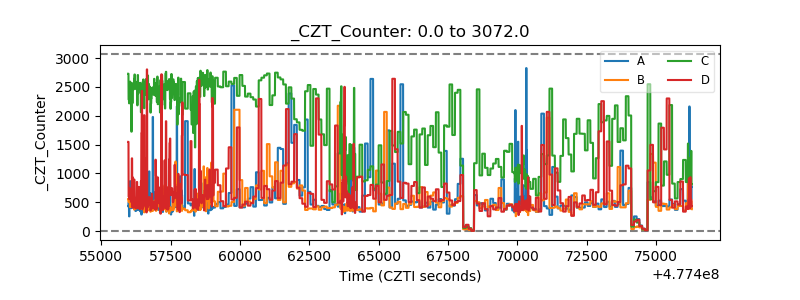 |
| +2.5 Volts monitor | 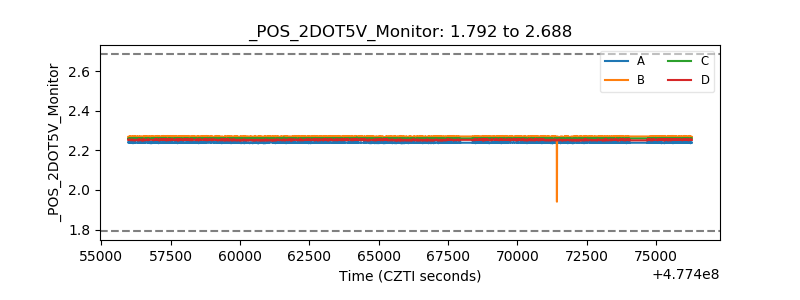 |
| +5 Volts monitor | 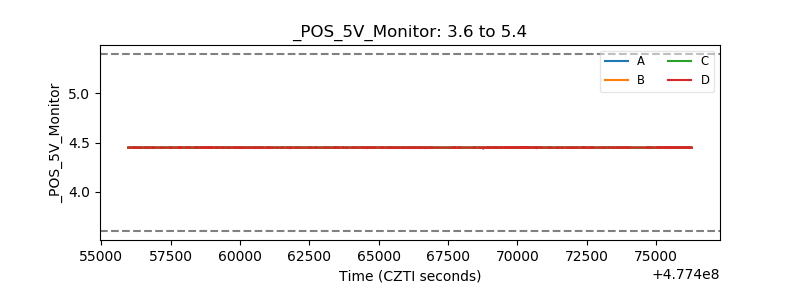 |
| _ROLL_ROT | 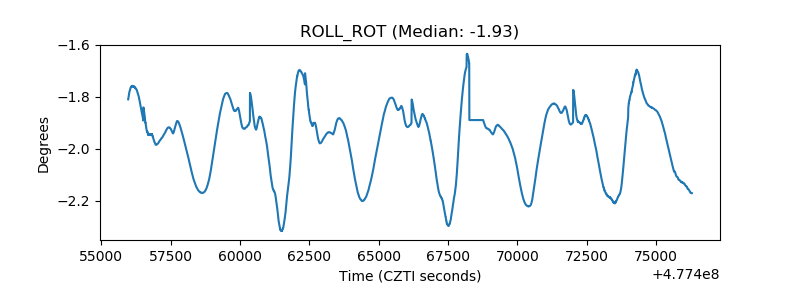 |
| _Roll_DEC | 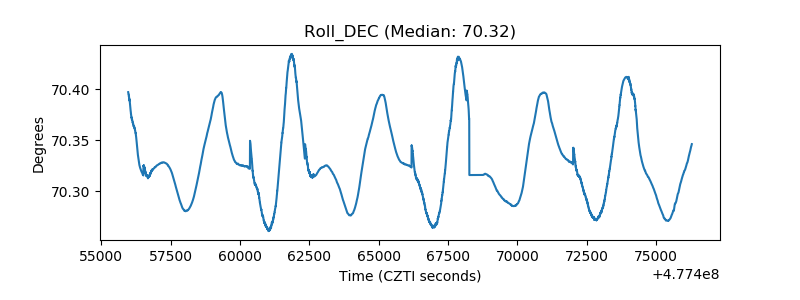 |
| _Roll_RA | 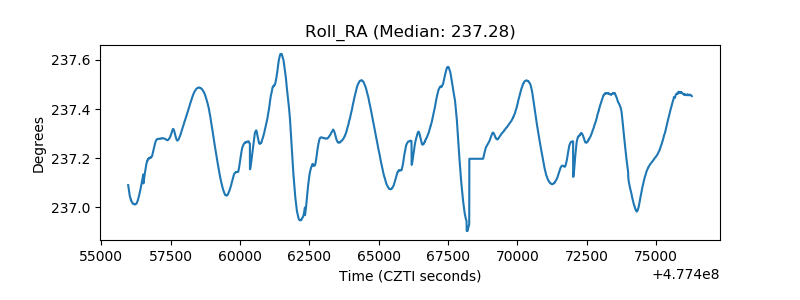 |
| Veto Counter | 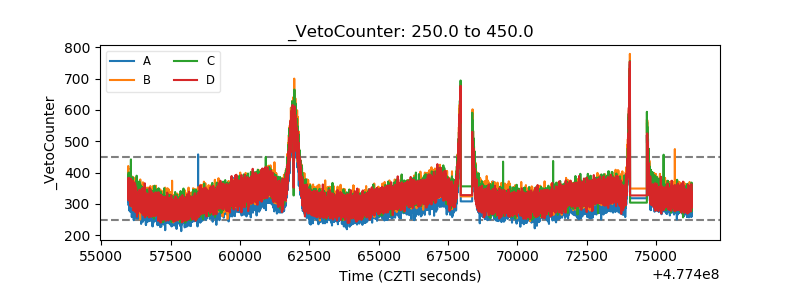 |