| Param | Original file | Final file |
|---|---|---|
| Filename | modeM0/AS1C07_001T01_9000006450_50793cztM0_level2.fits | modeM0/AS1C07_001T01_9000006450_50793cztM0_level2_quad_clean.evt |
| Size (bytes) | 545,428,800 | 96,770,880 |
| Size | 520.2 MB | 92.3 MB |
| Events in quadrant A | 3,593,863 | 633,044 |
| Events in quadrant B | 3,322,711 | 691,365 |
| Events in quadrant C | 8,178,145 | 567,782 |
| Events in quadrant D | 4,563,082 | 559,107 |
| Mode SS | |||
|---|---|---|---|
| Quadrant | BADHDUFLAG | Total packets | Discarded packets |
| A | 0 | 140 | 0 |
| B | 0 | 140 | 0 |
| C | 0 | 140 | 0 |
| D | 0 | 140 | 0 |
| Mode M0 | |||
|---|---|---|---|
| Quadrant | BADHDUFLAG | Total packets | Discarded packets |
| A | 0 | 15201 | 1 |
| B | 0 | 14743 | 2 |
| C | 0 | 29200 | 1 |
| D | 0 | 18308 | 1 |
| Mode M9 | |||
|---|---|---|---|
| Quadrant | BADHDUFLAG | Total packets | Discarded packets |
| A | 0 | 8 | 0 |
| B | 0 | 8 | 0 |
| C | 0 | 8 | 0 |
| D | 0 | 8 | 0 |
| Quadrant | Total seconds | Saturated seconds | Saturation percentage |
|---|---|---|---|
| A | 6868 | 110 | 1.601631% |
| B | 6868 | 86 | 1.252184% |
| C | 6868 | 638 | 9.289458% |
| D | 6868 | 261 | 3.800233% |
Noise dominated data is calculated using 1-second bins in cleaned event files. If a bin has >2000 counts, and if more than 50% of those come from <1% of pixels, then it is considered to be noise-dominated and hence unusable.
| Quadrant | # 1 sec bins | Bins with >0 counts | Bins with >2000 counts | High rate bins dominated by noise | Noise dominated (total time) | Noise dominated (detector-on time) | Marked lightcurve |
|---|---|---|---|---|---|---|---|
| A | 7678 | 6868 | 43 | 43 | 0.56% | 0.63% | 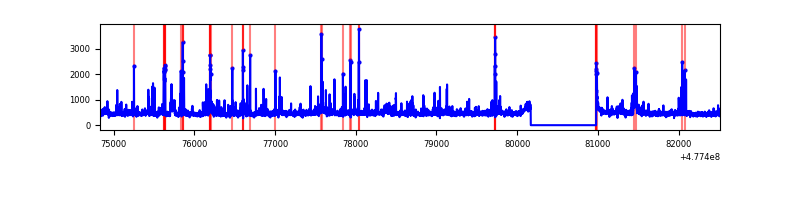 |
| B | 7678 | 6868 | 27 | 27 | 0.35% | 0.39% | 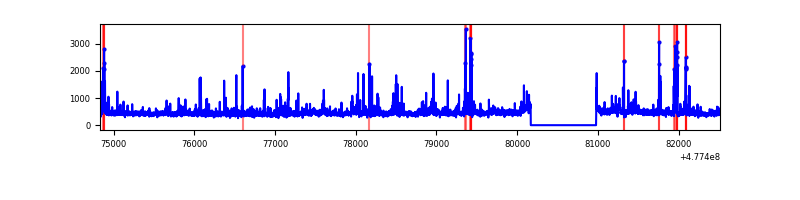 |
| C | 7678 | 6868 | 541 | 541 | 7.05% | 7.88% | 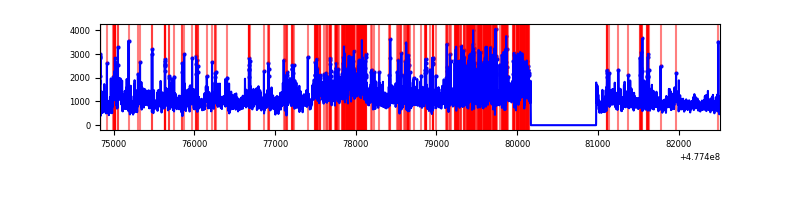 |
| D | 7678 | 6868 | 184 | 184 | 2.40% | 2.68% | 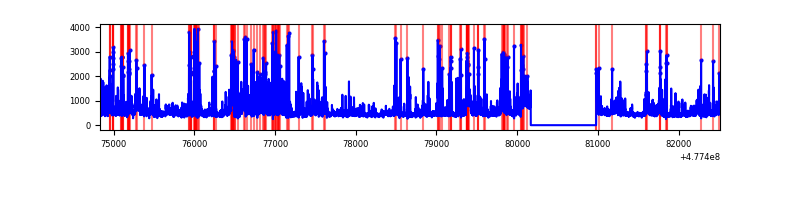 |
Top three noisy pixels from each quadrant. If the there are fewer than three noisy pixels in the level2.evt file, extra rows are filled as -1
| Pixel properties | Quadrant properties | ||||||
|---|---|---|---|---|---|---|---|
| Quadrant | DetID | PixID | Counts | Sigma | Mean | Median | Sigma |
| A | 3 | 63 | 113382 | 620.14 | 726 | 707 | 181.7 |
| A | 4 | 249 | 102779 | 561.78 | 726 | 707 | 181.7 |
| A | 10 | 253 | 93244 | 509.3 | 726 | 707 | 181.7 |
| B | 10 | 247 | 68735 | 446.23 | 717 | 693 | 152.5 |
| B | 8 | 128 | 64175 | 416.33 | 717 | 693 | 152.5 |
| B | 4 | 206 | 58978 | 382.25 | 717 | 693 | 152.5 |
| C | 5 | 10 | 3138057 | 16652.47 | 672 | 666 | 188.4 |
| C | 0 | 193 | 637308 | 3379.13 | 672 | 666 | 188.4 |
| C | 1 | 44 | 421262 | 2232.42 | 672 | 666 | 188.4 |
| D | 2 | 249 | 541260 | 2791.63 | 689 | 662 | 193.6 |
| D | 2 | 216 | 268568 | 1383.46 | 689 | 662 | 193.6 |
| D | 7 | 96 | 161840 | 832.32 | 689 | 662 | 193.6 |
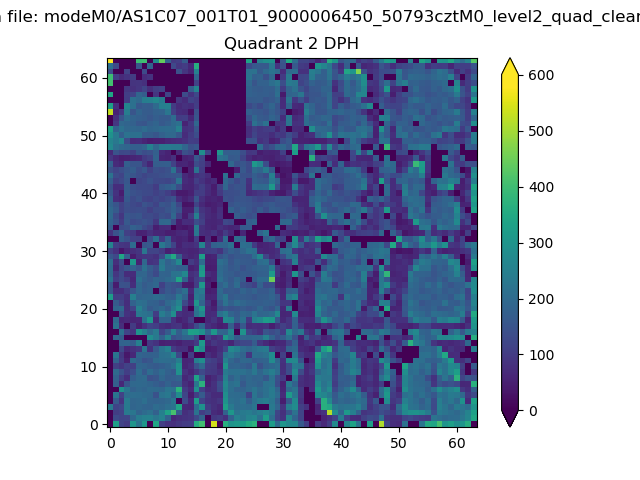
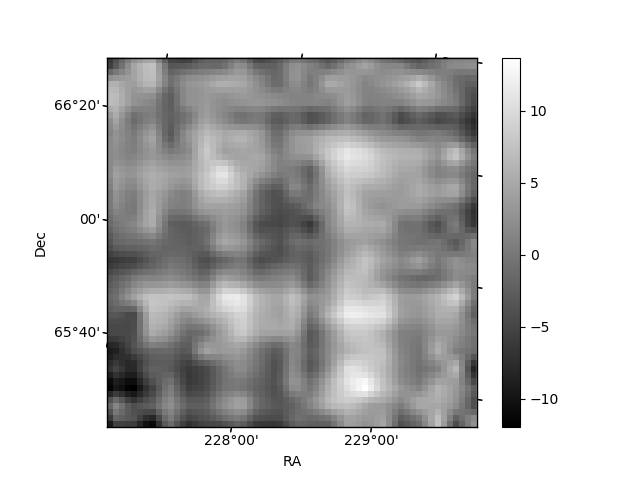
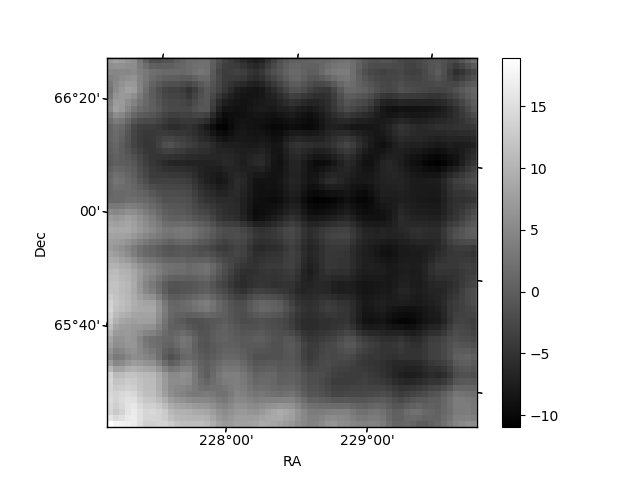
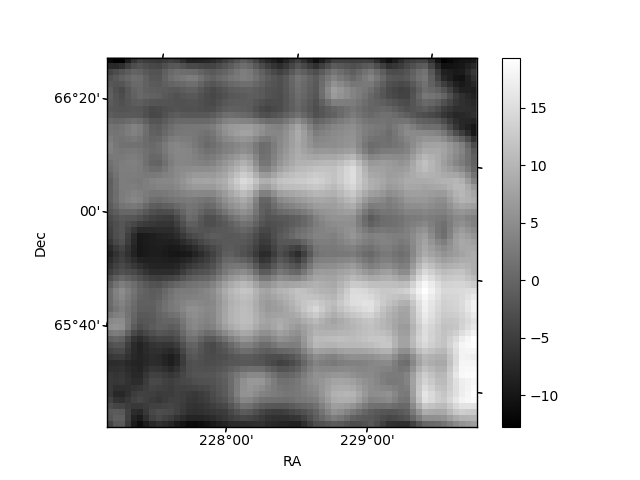
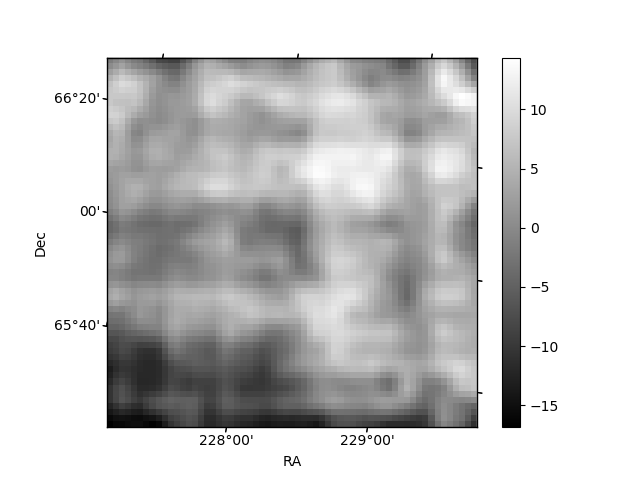
Histogram calculated using DETX and DETY for each event in the final _common_clean file
| Quadrant A | 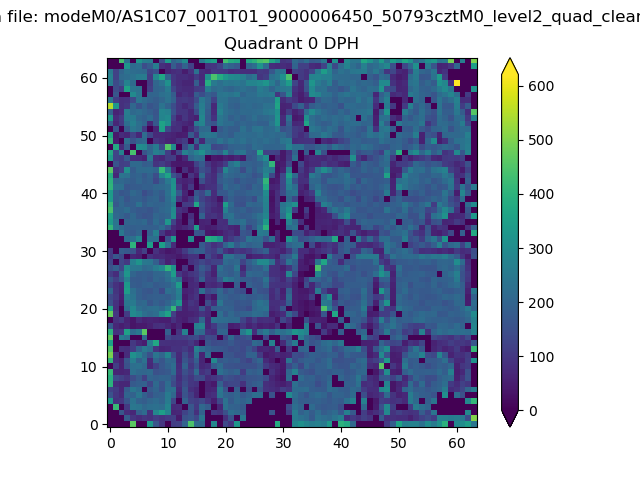 |
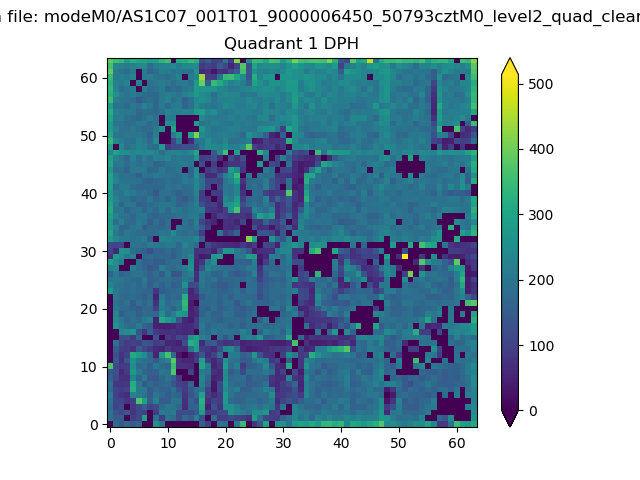 |
Quadrant B |
|---|---|---|---|
| Quadrant D | 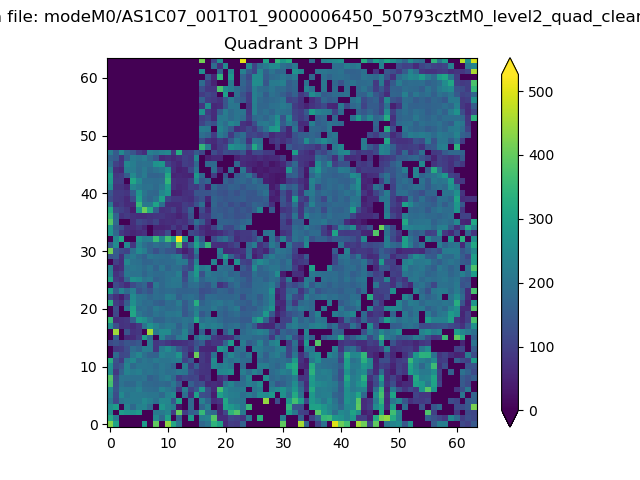 |
 |
Quadrant C |
| Plot type | Count rate plots | Images |
|---|---|---|
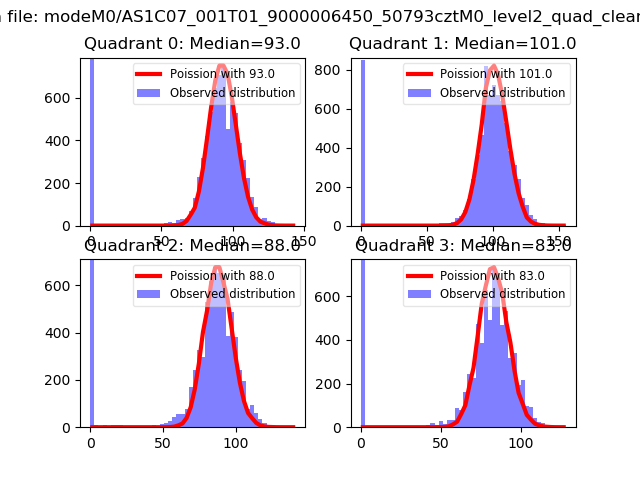
| Comparison with Poisson distribution Blue bars denote a histogram of data divided into 1 sec bins. Red curve is a Poisson curve with rate = median count rate of data. |
 |
 |
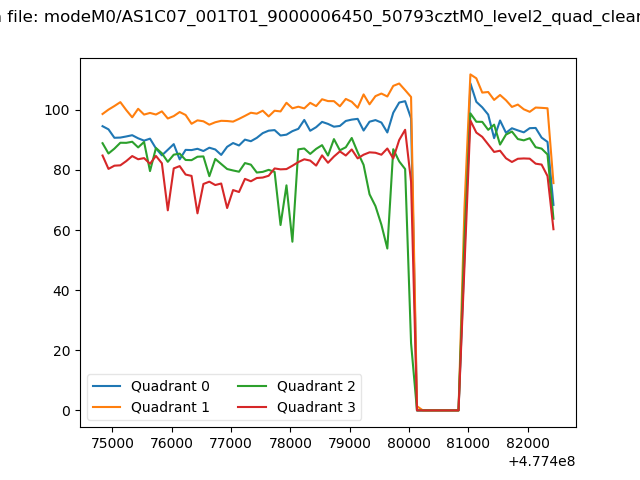
| Quadrant-wise count rates Data is divided into 100 sec bins |
 |
|
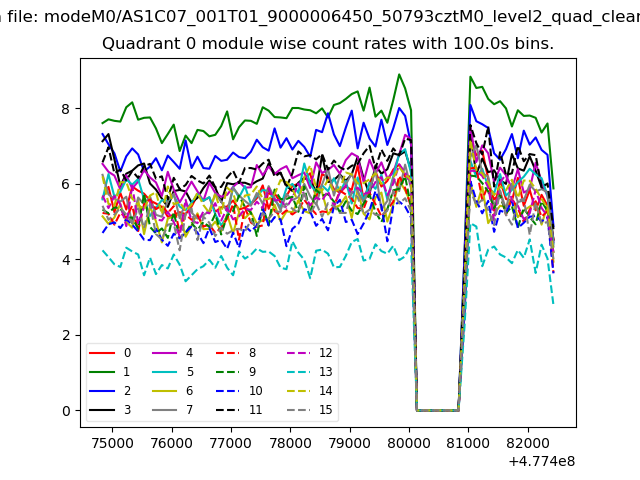
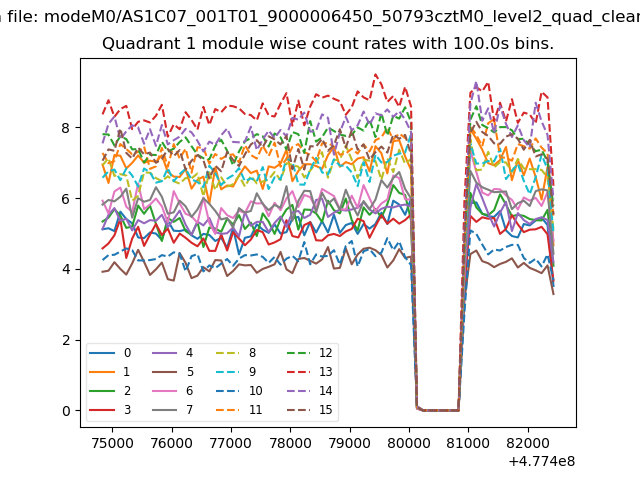
| Module-wise count rates for Quadrant A Data is divided into 100 sec bins |
 |
 |
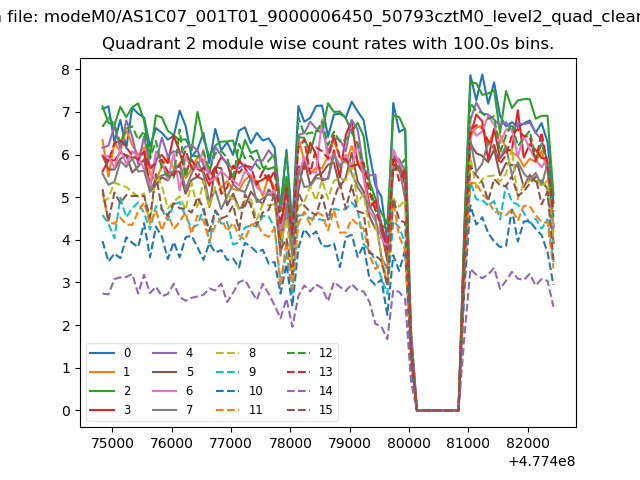
| Module-wise count rates for Quadrant B Data is divided into 100 sec bins |
 |
 |
| Module-wise count rates for Quadrant C Data is divided into 100 sec bins |
 |
 |
| Module-wise count rates for Quadrant D Data is divided into 100 sec bins |
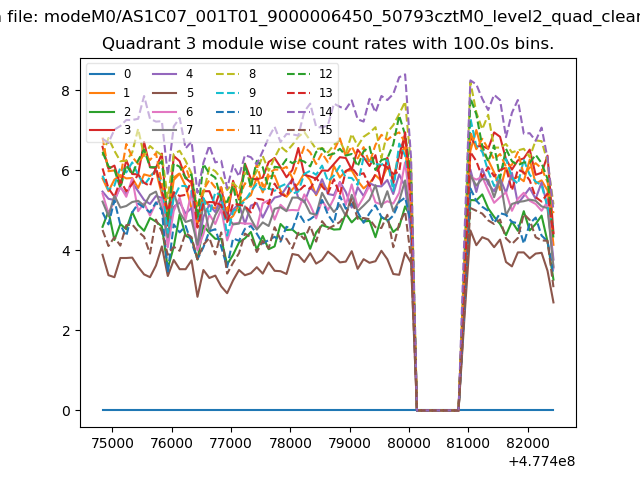 |
 |
| Parameter | Plot |
|---|---|
| CZT HV Monitor | 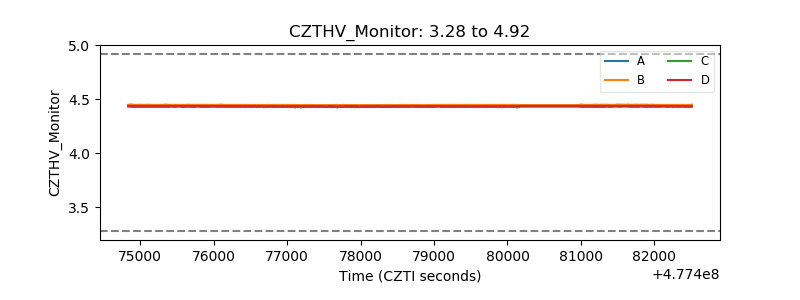 |
| D_VDD | 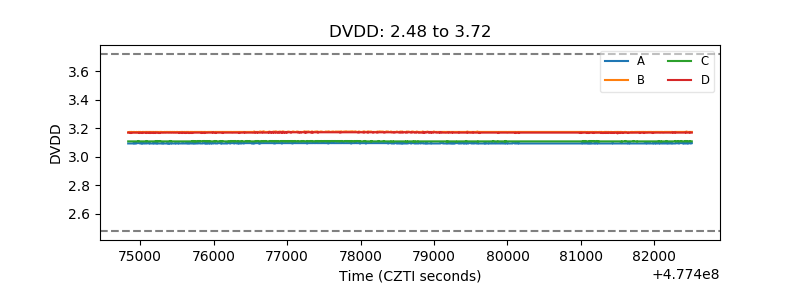 |
| Temperature 1 | 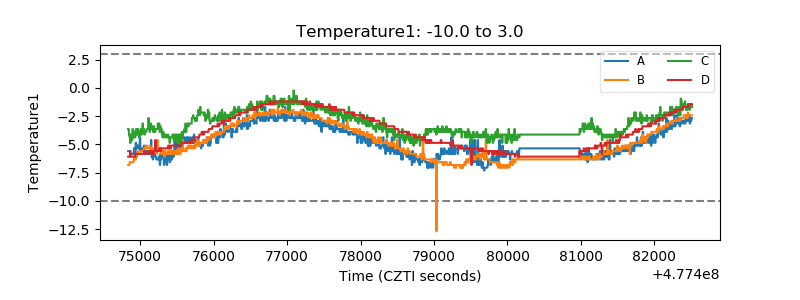 |
| Veto HV Monitor | 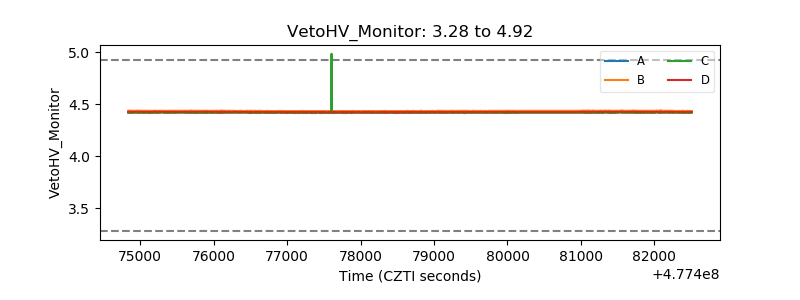 |
| Veto LLD | 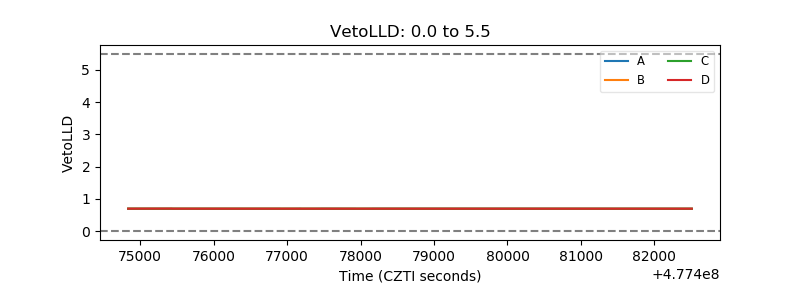 |
| Alpha Counter | 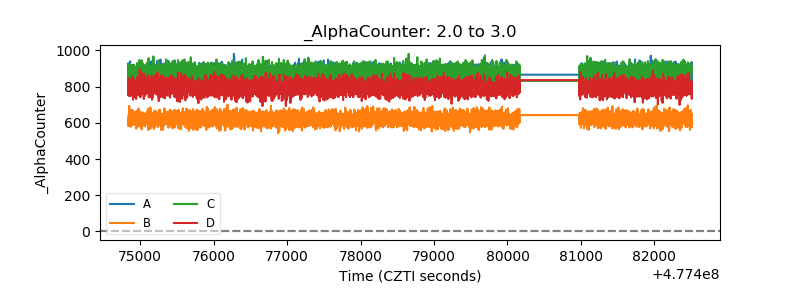 |
| _CPM_Rate | 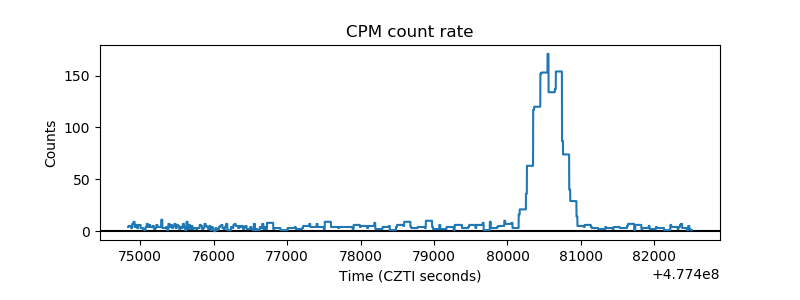 |
| CZT Counter | 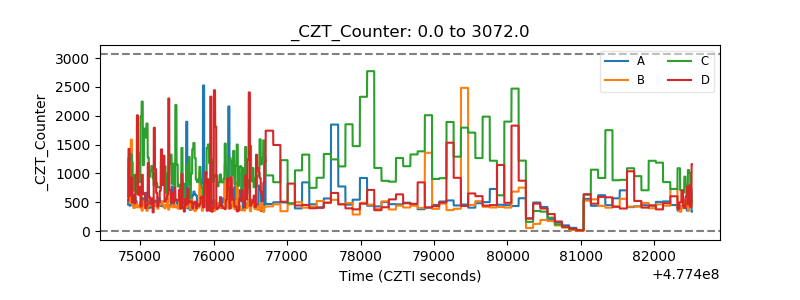 |
| +2.5 Volts monitor | 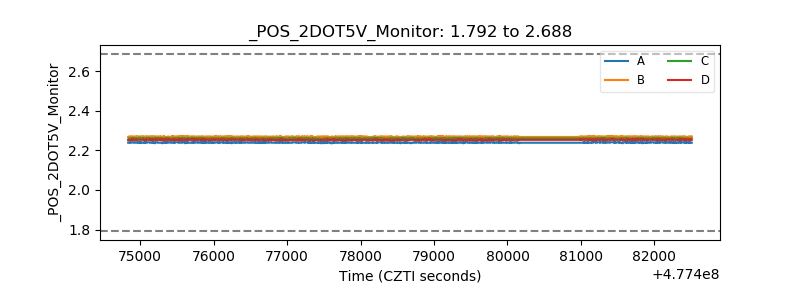 |
| +5 Volts monitor | 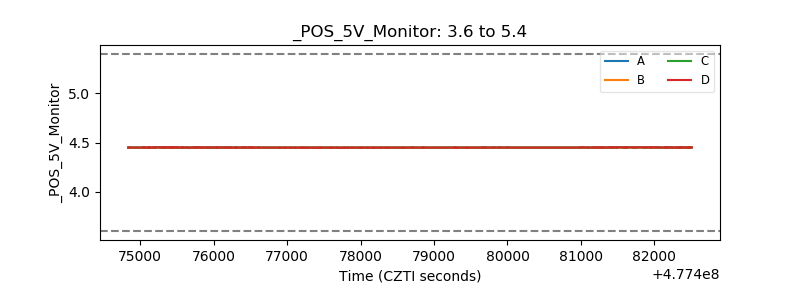 |
| _ROLL_ROT | 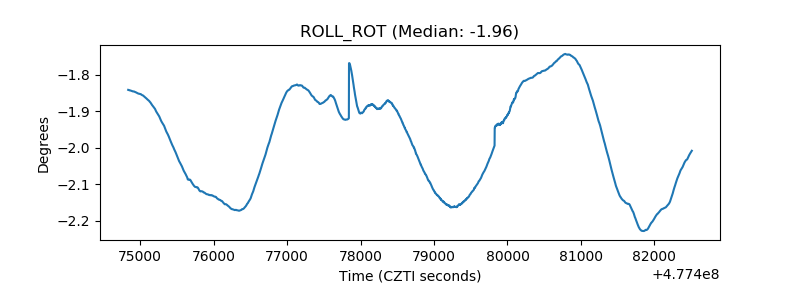 |
| _Roll_DEC | 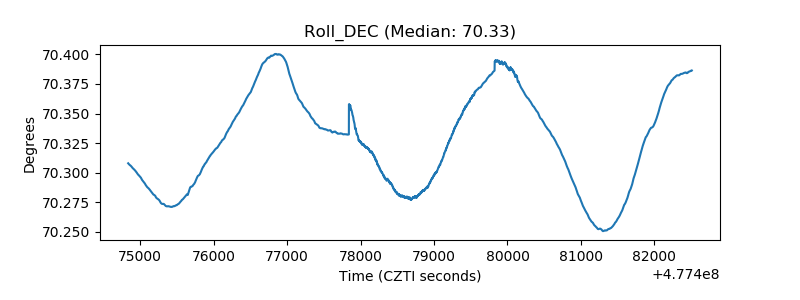 |
| _Roll_RA | 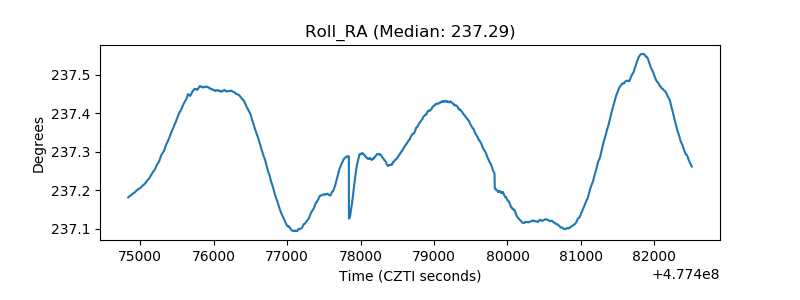 |
| Veto Counter | 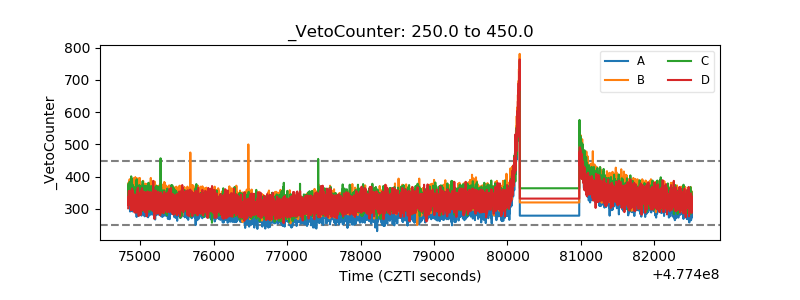 |