| Param | Original file | Final file |
|---|---|---|
| Filename | modeM0/AS1C07_001T01_9000006450_50795cztM0_level2.fits | modeM0/AS1C07_001T01_9000006450_50795cztM0_level2_quad_clean.evt |
| Size (bytes) | 476,527,680 | 85,043,520 |
| Size | 454.5 MB | 81.1 MB |
| Events in quadrant A | 3,240,067 | 561,896 |
| Events in quadrant B | 2,991,023 | 609,835 |
| Events in quadrant C | 6,613,256 | 498,726 |
| Events in quadrant D | 4,331,545 | 487,174 |
| Mode SS | |||
|---|---|---|---|
| Quadrant | BADHDUFLAG | Total packets | Discarded packets |
| A | 0 | 122 | 0 |
| B | 0 | 122 | 0 |
| C | 0 | 122 | 0 |
| D | 0 | 122 | 0 |
| Mode M0 | |||
|---|---|---|---|
| Quadrant | BADHDUFLAG | Total packets | Discarded packets |
| A | 0 | 13545 | 1 |
| B | 0 | 13156 | 1 |
| C | 0 | 23880 | 1 |
| D | 0 | 17061 | 1 |
| Mode M9 | |||
|---|---|---|---|
| Quadrant | BADHDUFLAG | Total packets | Discarded packets |
| A | 0 | 10 | 0 |
| B | 0 | 10 | 0 |
| C | 0 | 10 | 0 |
| D | 0 | 10 | 0 |
| Quadrant | Total seconds | Saturated seconds | Saturation percentage |
|---|---|---|---|
| A | 5972 | 128 | 2.143336% |
| B | 5972 | 120 | 2.009377% |
| C | 5973 | 629 | 10.530722% |
| D | 5973 | 325 | 5.441152% |
Noise dominated data is calculated using 1-second bins in cleaned event files. If a bin has >2000 counts, and if more than 50% of those come from <1% of pixels, then it is considered to be noise-dominated and hence unusable.
| Quadrant | # 1 sec bins | Bins with >0 counts | Bins with >2000 counts | High rate bins dominated by noise | Noise dominated (total time) | Noise dominated (detector-on time) | Marked lightcurve |
|---|---|---|---|---|---|---|---|
| A | 6942 | 5972 | 59 | 59 | 0.85% | 0.99% | 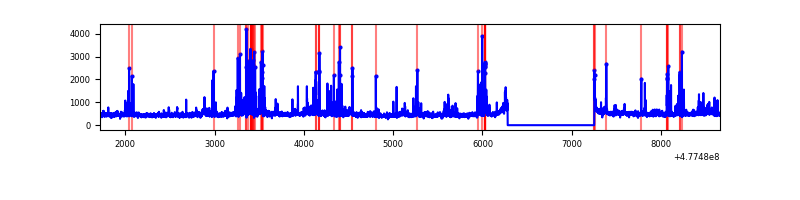 |
| B | 6942 | 5972 | 40 | 40 | 0.58% | 0.67% | 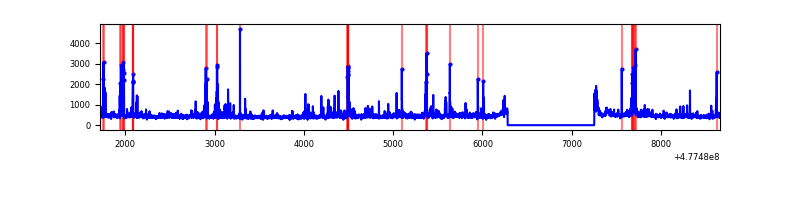 |
| C | 6943 | 5973 | 513 | 513 | 7.39% | 8.59% | 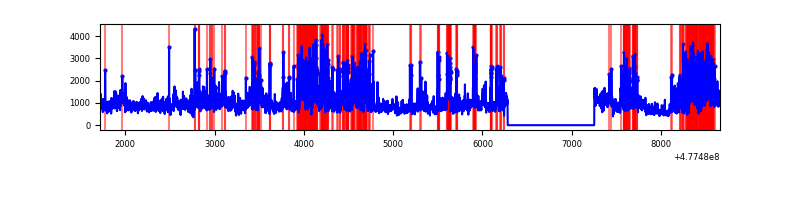 |
| D | 6943 | 5973 | 237 | 237 | 3.41% | 3.97% | 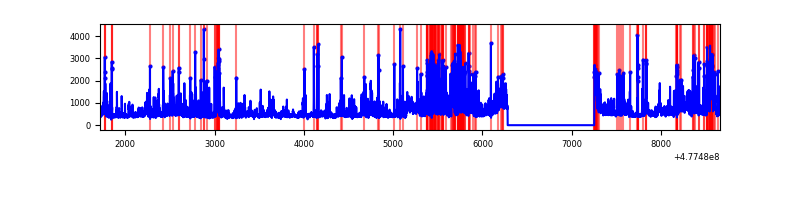 |
Top three noisy pixels from each quadrant. If the there are fewer than three noisy pixels in the level2.evt file, extra rows are filled as -1
| Pixel properties | Quadrant properties | ||||||
|---|---|---|---|---|---|---|---|
| Quadrant | DetID | PixID | Counts | Sigma | Mean | Median | Sigma |
| A | 3 | 63 | 122480 | 765.87 | 635 | 619 | 159.1 |
| A | 4 | 3 | 116392 | 727.61 | 635 | 619 | 159.1 |
| A | 3 | 130 | 98719 | 616.54 | 635 | 619 | 159.1 |
| B | 10 | 247 | 113093 | 839.49 | 627 | 603 | 134.0 |
| B | 4 | 206 | 98547 | 730.93 | 627 | 603 | 134.0 |
| B | 0 | 171 | 59843 | 442.09 | 627 | 603 | 134.0 |
| C | 5 | 10 | 2140159 | 13186.87 | 590 | 585 | 162.3 |
| C | 0 | 193 | 732190 | 4509.11 | 590 | 585 | 162.3 |
| C | 2 | 207 | 587248 | 3615.79 | 590 | 585 | 162.3 |
| D | 2 | 216 | 533055 | 3191.44 | 600 | 582 | 166.8 |
| D | 2 | 249 | 213173 | 1274.19 | 600 | 582 | 166.8 |
| D | 15 | 169 | 190301 | 1137.1 | 600 | 582 | 166.8 |
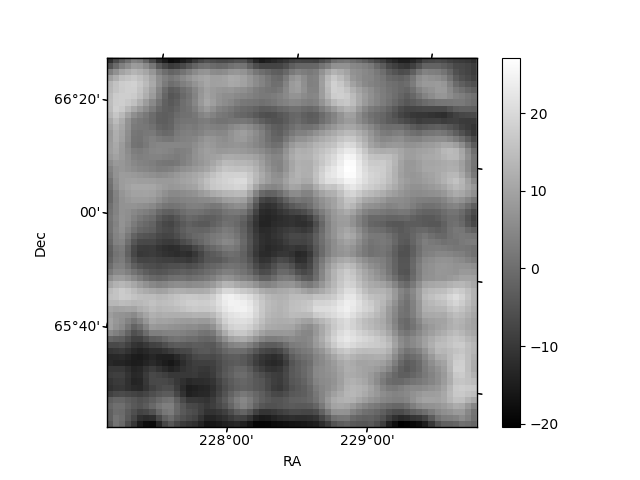
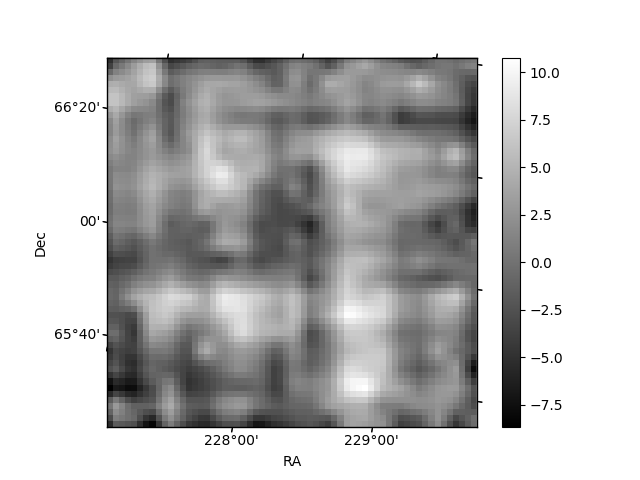
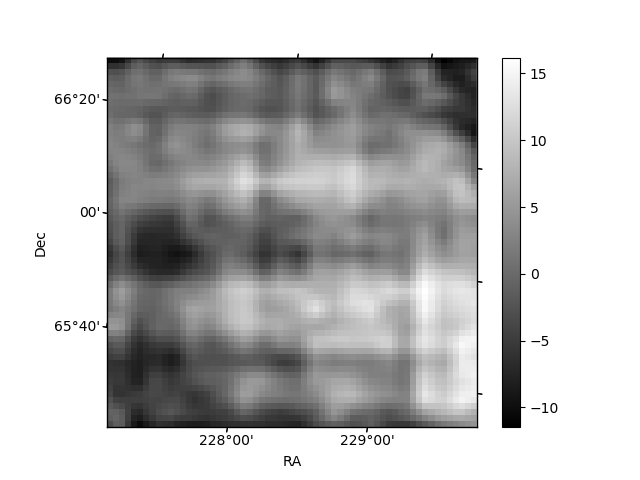
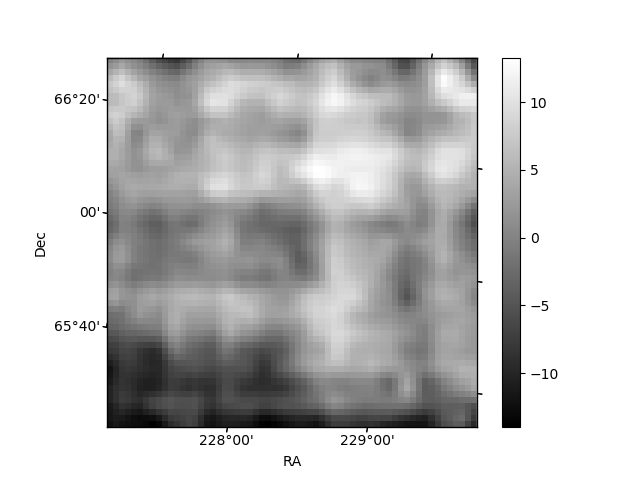
Histogram calculated using DETX and DETY for each event in the final _common_clean file
| Quadrant A | 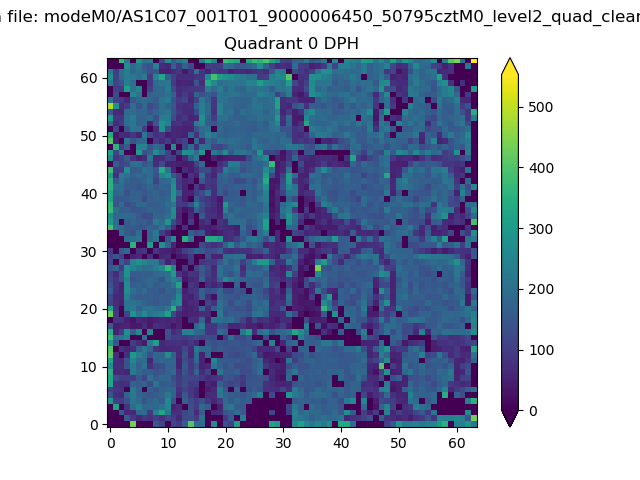 |
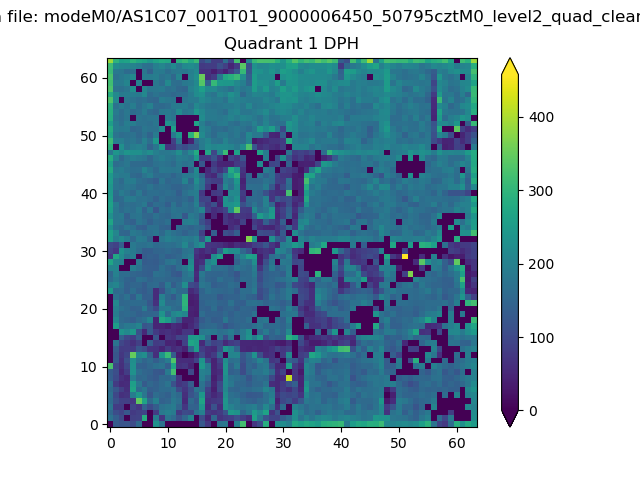 |
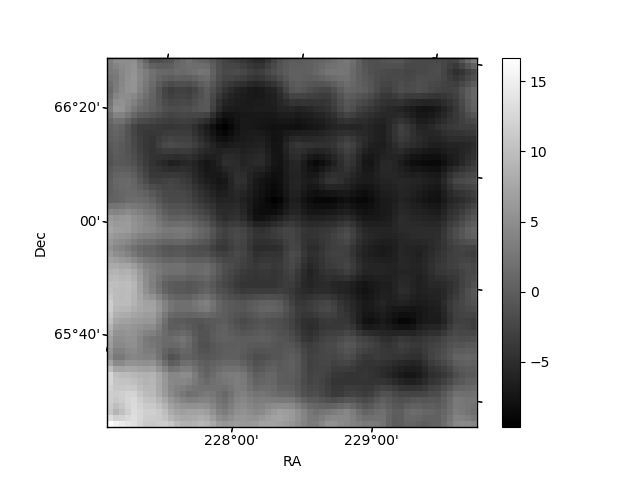
Quadrant B |
|---|---|---|---|
| Quadrant D | 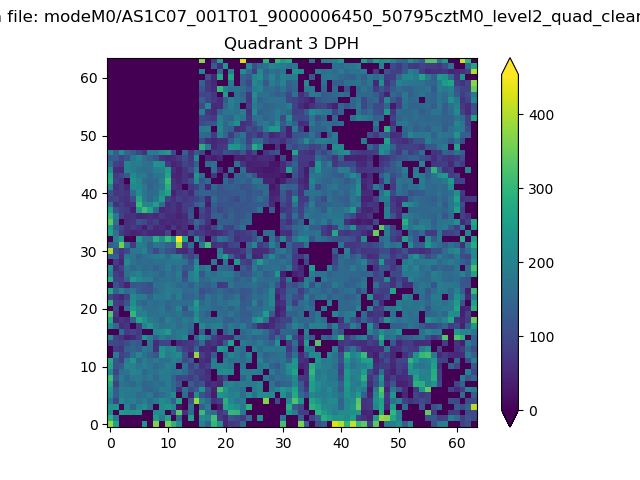 |
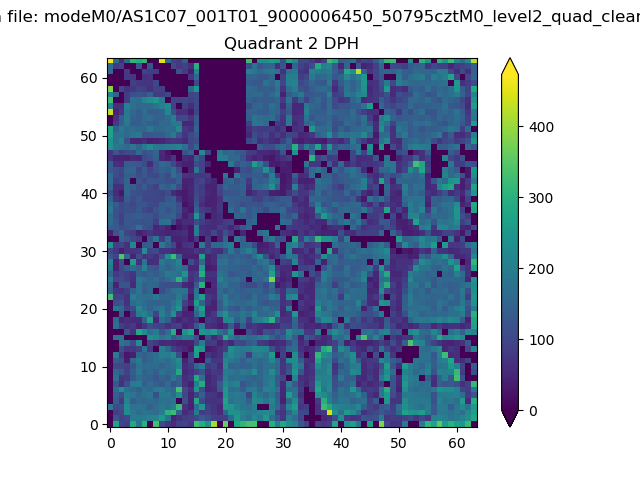 |
Quadrant C |
| Plot type | Count rate plots | Images |
|---|---|---|
| Comparison with Poisson distribution Blue bars denote a histogram of data divided into 1 sec bins. Red curve is a Poisson curve with rate = median count rate of data. |
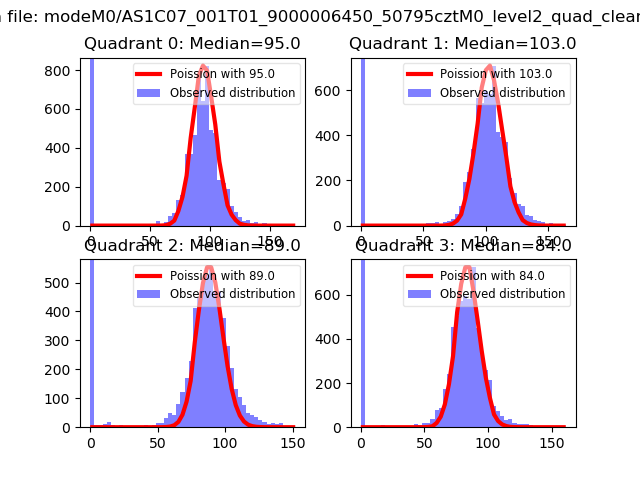 |
 |
| Quadrant-wise count rates Data is divided into 100 sec bins |
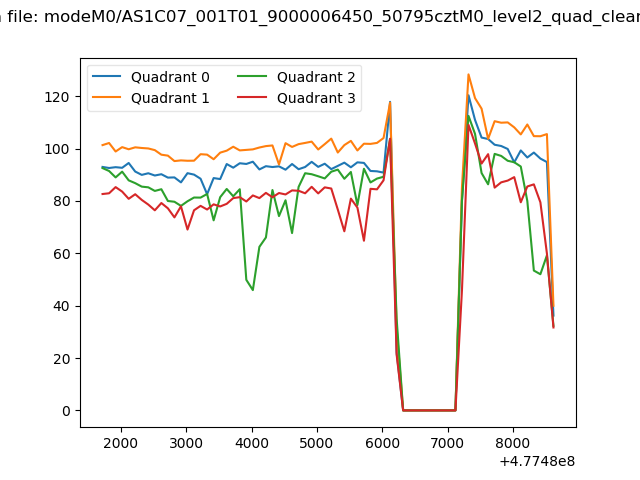 |
|
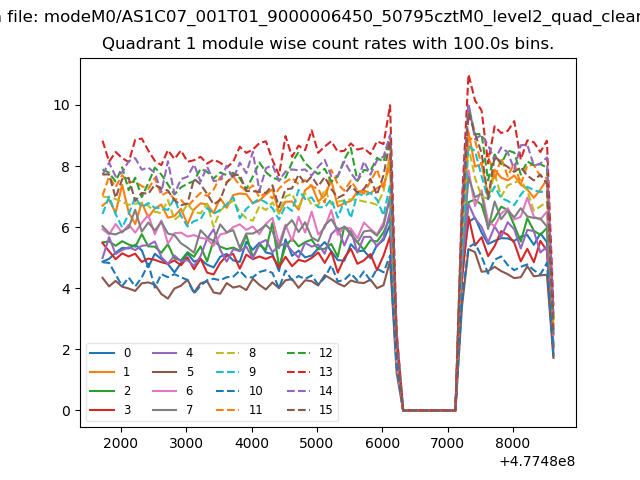
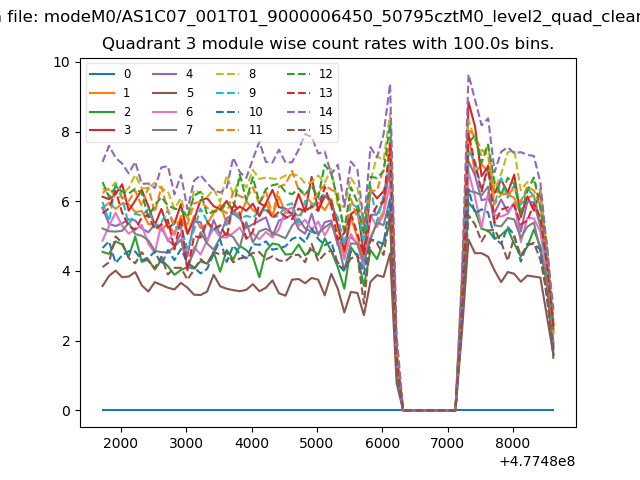
| Module-wise count rates for Quadrant A Data is divided into 100 sec bins |
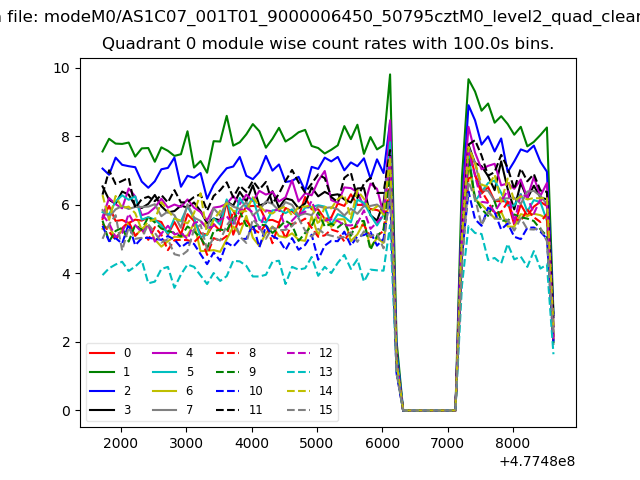 |
 |
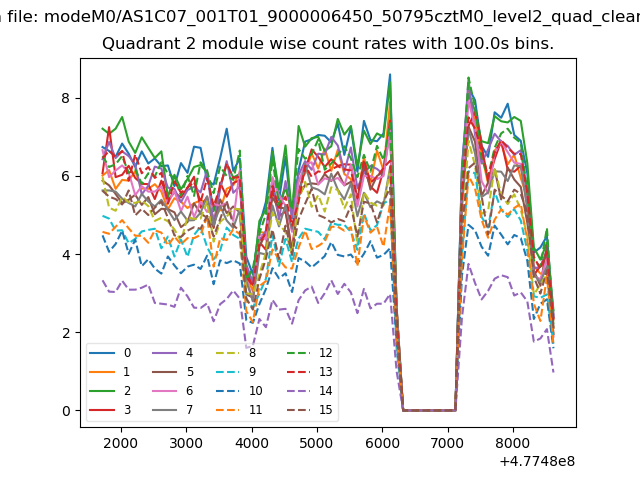
| Module-wise count rates for Quadrant B Data is divided into 100 sec bins |
 |
 |
| Module-wise count rates for Quadrant C Data is divided into 100 sec bins |
 |
 |
| Module-wise count rates for Quadrant D Data is divided into 100 sec bins |
 |
 |
| Parameter | Plot |
|---|---|
| CZT HV Monitor |  |
| D_VDD | 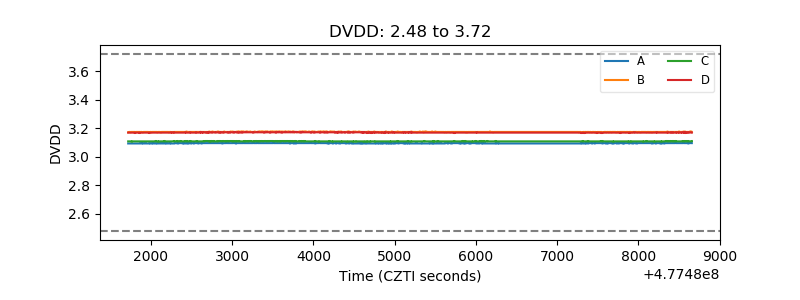 |
| Temperature 1 | 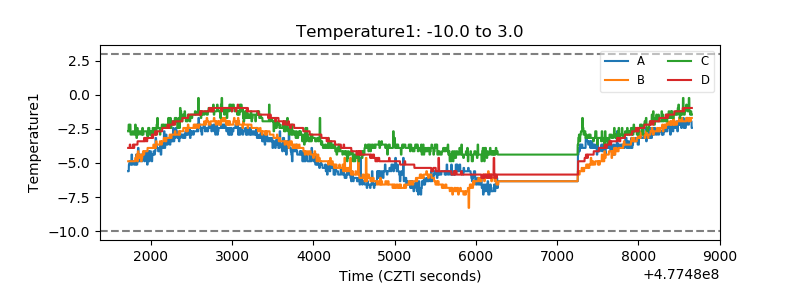 |
| Veto HV Monitor | 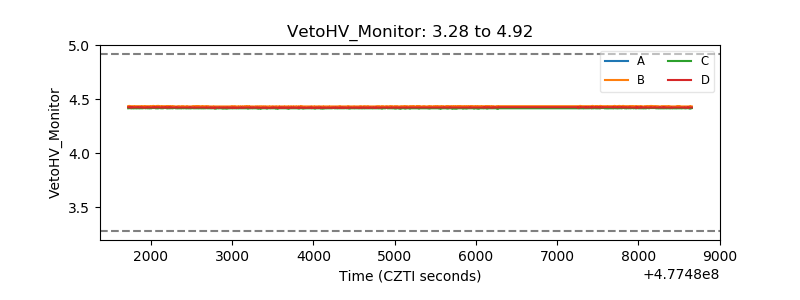 |
| Veto LLD | 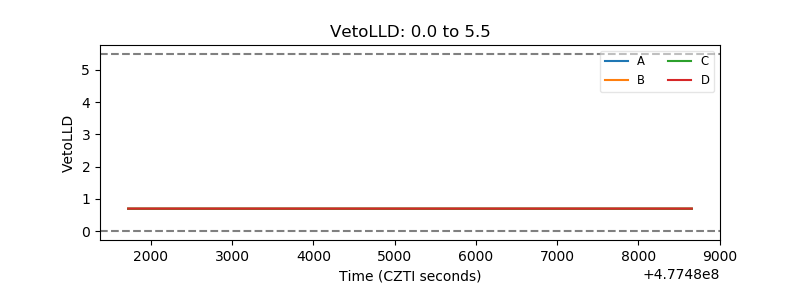 |
| Alpha Counter | 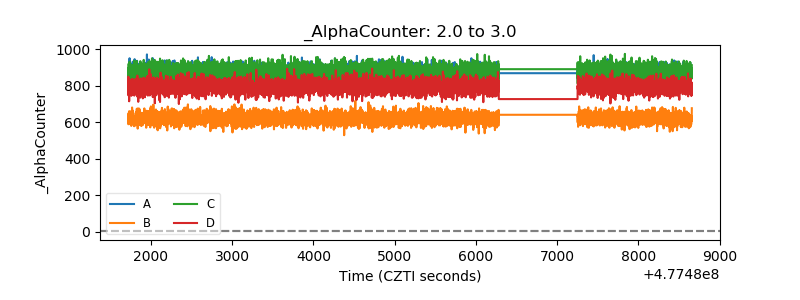 |
| _CPM_Rate | 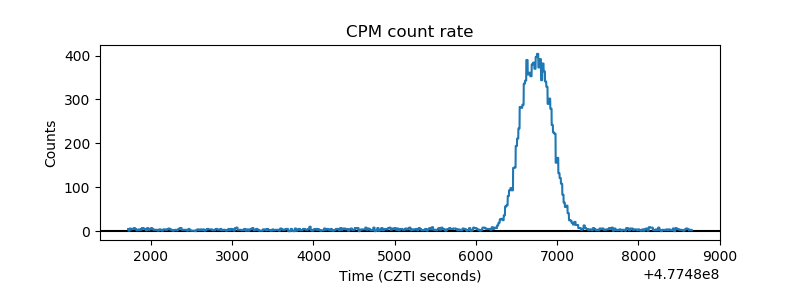 |
| CZT Counter | 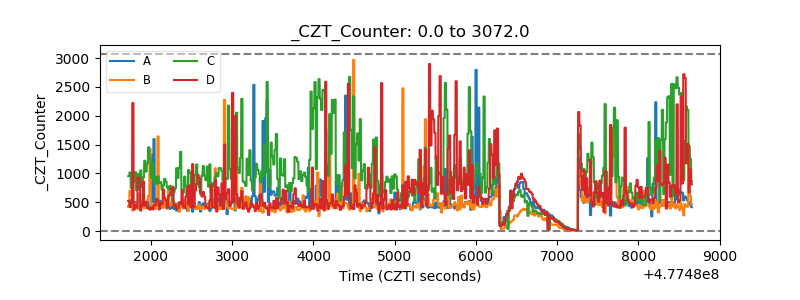 |
| +2.5 Volts monitor | 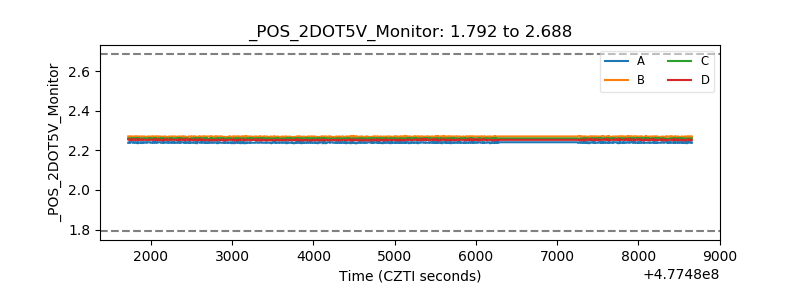 |
| +5 Volts monitor | 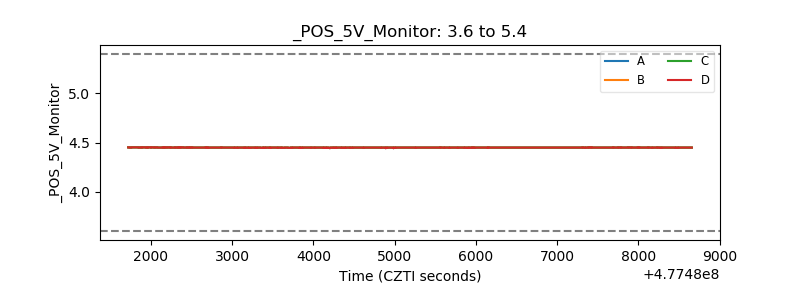 |
| _ROLL_ROT | 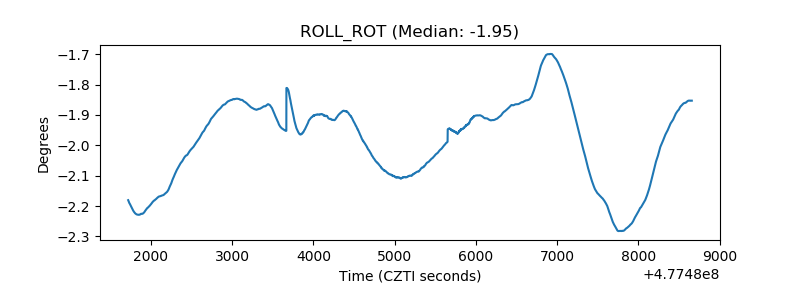 |
| _Roll_DEC | 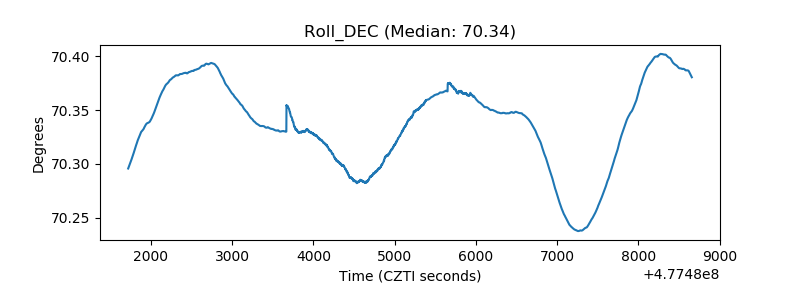 |
| _Roll_RA | 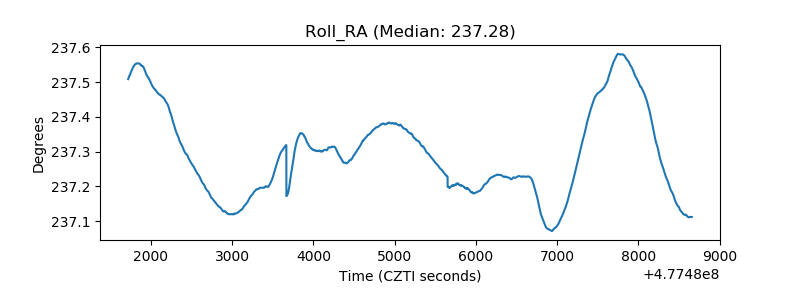 |
| Veto Counter | 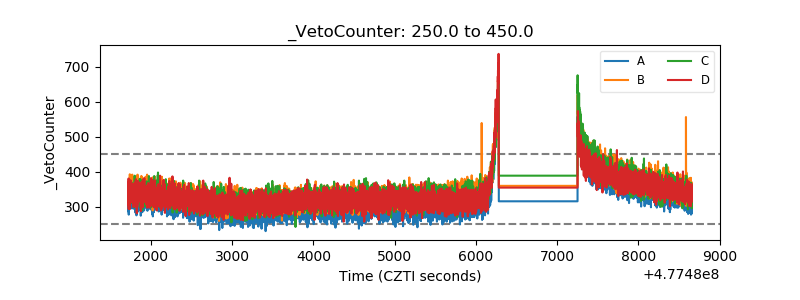 |