| Param | Original file | Final file |
|---|---|---|
| Filename | modeM0/AS1C07_001T01_9000006450_50796cztM0_level2.fits | modeM0/AS1C07_001T01_9000006450_50796cztM0_level2_quad_clean.evt |
| Size (bytes) | 580,530,240 | 87,451,200 |
| Size | 553.6 MB | 83.4 MB |
| Events in quadrant A | 3,855,518 | 588,171 |
| Events in quadrant B | 4,721,616 | 587,560 |
| Events in quadrant C | 6,949,476 | 536,619 |
| Events in quadrant D | 5,484,897 | 504,937 |
| Mode SS | |||
|---|---|---|---|
| Quadrant | BADHDUFLAG | Total packets | Discarded packets |
| A | 0 | 124 | 0 |
| B | 0 | 124 | 0 |
| C | 0 | 124 | 0 |
| D | 0 | 124 | 0 |
| Mode M0 | |||
|---|---|---|---|
| Quadrant | BADHDUFLAG | Total packets | Discarded packets |
| A | 0 | 15416 | 1 |
| B | 0 | 18334 | 1 |
| C | 0 | 25058 | 1 |
| D | 0 | 20589 | 1 |
| Mode M9 | |||
|---|---|---|---|
| Quadrant | BADHDUFLAG | Total packets | Discarded packets |
| A | 0 | 11 | 0 |
| B | 0 | 11 | 0 |
| C | 0 | 11 | 0 |
| D | 0 | 11 | 0 |
| Quadrant | Total seconds | Saturated seconds | Saturation percentage |
|---|---|---|---|
| A | 6172 | 190 | 3.078419% |
| B | 6173 | 717 | 11.615098% |
| C | 6173 | 465 | 7.532804% |
| D | 6173 | 475 | 7.694800% |
Noise dominated data is calculated using 1-second bins in cleaned event files. If a bin has >2000 counts, and if more than 50% of those come from <1% of pixels, then it is considered to be noise-dominated and hence unusable.
| Quadrant | # 1 sec bins | Bins with >0 counts | Bins with >2000 counts | High rate bins dominated by noise | Noise dominated (total time) | Noise dominated (detector-on time) | Marked lightcurve |
|---|---|---|---|---|---|---|---|
| A | 7197 | 6172 | 93 | 93 | 1.29% | 1.51% | 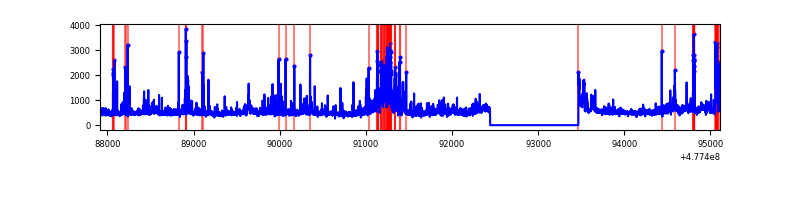 |
| B | 7198 | 6173 | 420 | 420 | 5.83% | 6.80% | 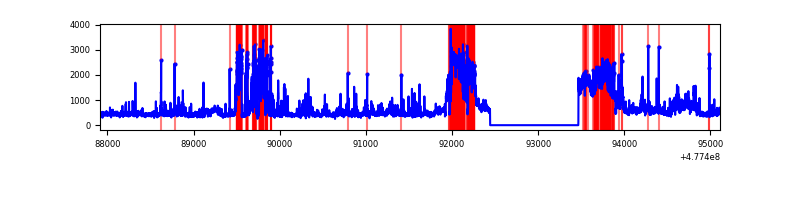 |
| C | 7198 | 6173 | 353 | 353 | 4.90% | 5.72% | 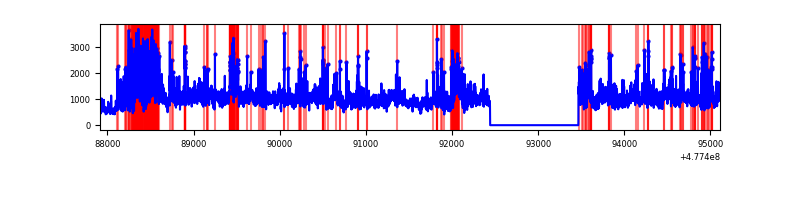 |
| D | 7198 | 6173 | 403 | 403 | 5.60% | 6.53% | 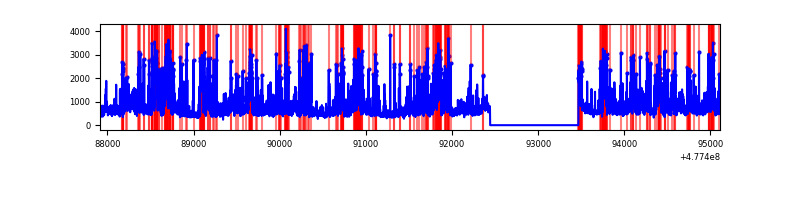 |
Top three noisy pixels from each quadrant. If the there are fewer than three noisy pixels in the level2.evt file, extra rows are filled as -1
| Pixel properties | Quadrant properties | ||||||
|---|---|---|---|---|---|---|---|
| Quadrant | DetID | PixID | Counts | Sigma | Mean | Median | Sigma |
| A | 14 | 254 | 342564 | 2085.01 | 666 | 652 | 164.0 |
| A | 4 | 3 | 131871 | 800.19 | 666 | 652 | 164.0 |
| A | 8 | 234 | 101444 | 614.64 | 666 | 652 | 164.0 |
| B | 4 | 206 | 1896445 | 13993.54 | 642 | 620 | 135.5 |
| B | 0 | 216 | 75011 | 549.1 | 642 | 620 | 135.5 |
| B | 0 | 171 | 38311 | 278.21 | 642 | 620 | 135.5 |
| C | 5 | 10 | 2753987 | 15971.57 | 633 | 627 | 172.4 |
| C | 2 | 207 | 497342 | 2881.32 | 633 | 627 | 172.4 |
| C | 1 | 44 | 281013 | 1626.45 | 633 | 627 | 172.4 |
| D | 2 | 216 | 587655 | 3391.72 | 626 | 603 | 173.1 |
| D | 8 | 48 | 500915 | 2890.57 | 626 | 603 | 173.1 |
| D | 7 | 96 | 401935 | 2318.71 | 626 | 603 | 173.1 |
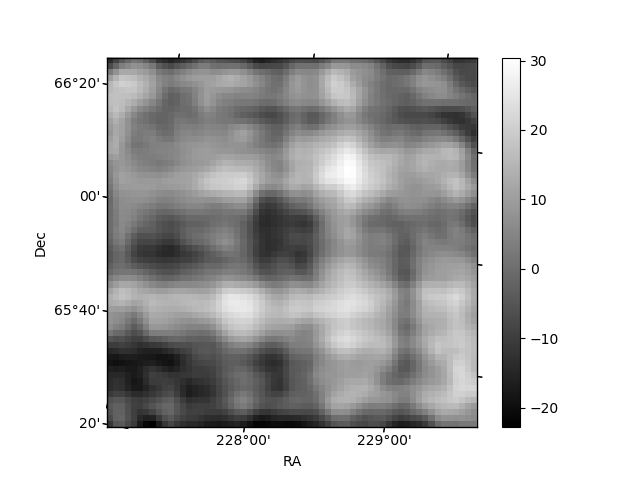
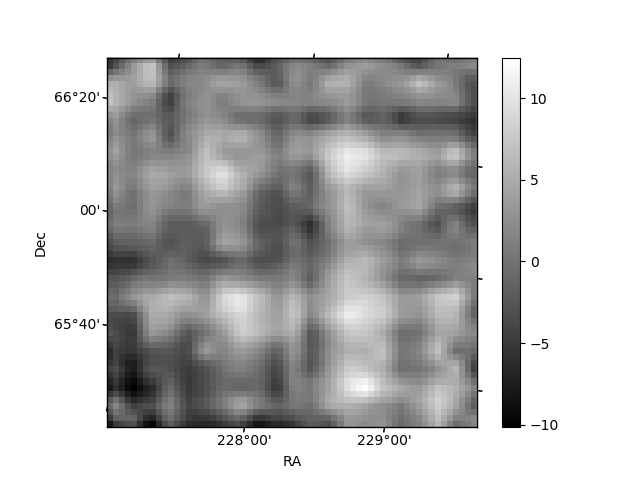
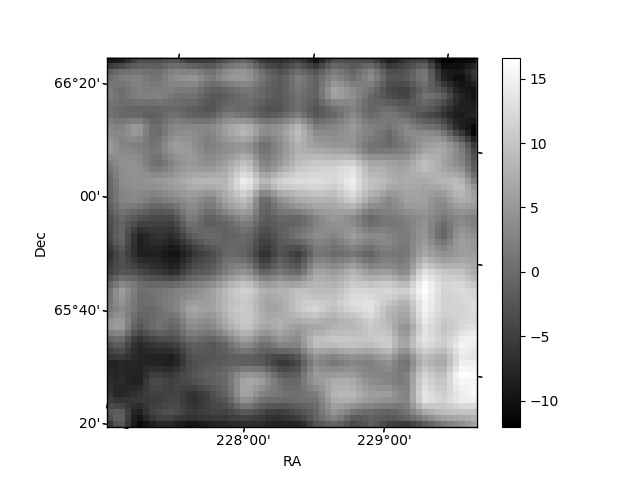
Histogram calculated using DETX and DETY for each event in the final _common_clean file
| Quadrant A | 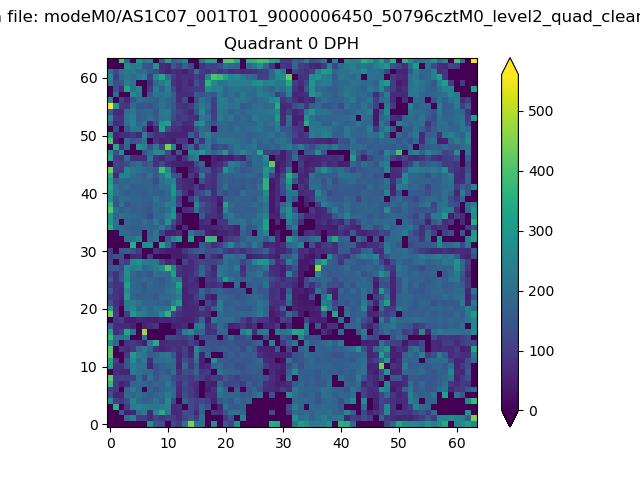 |
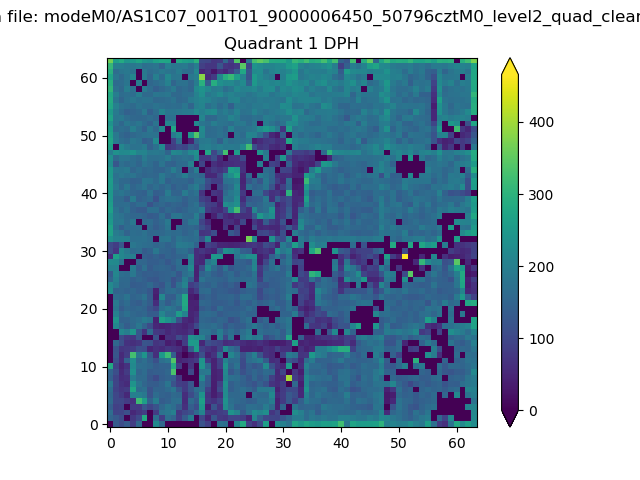 |
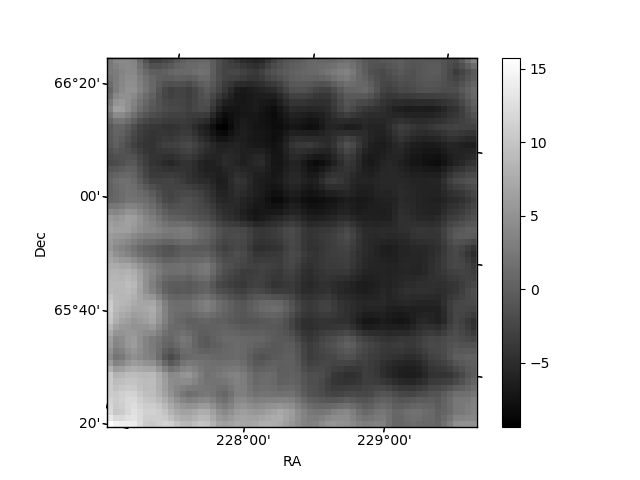
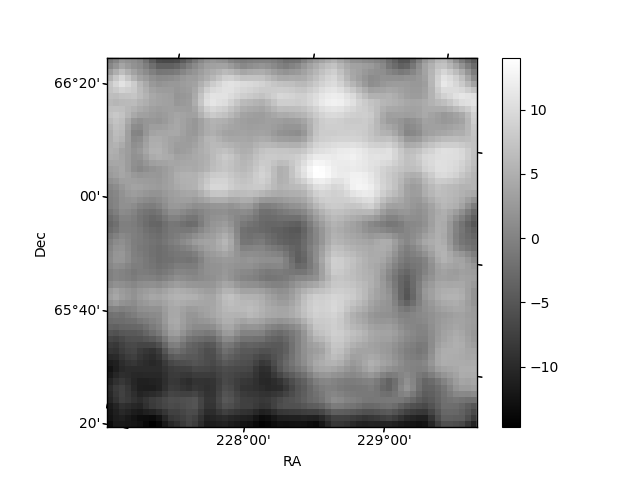
Quadrant B |
|---|---|---|---|
| Quadrant D | 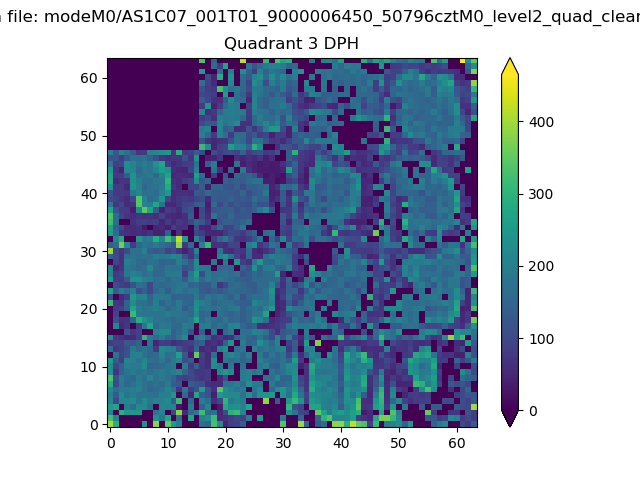 |
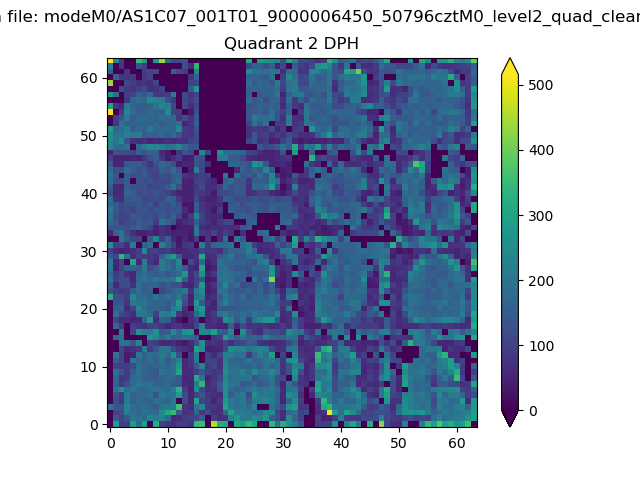 |
Quadrant C |
| Plot type | Count rate plots | Images |
|---|---|---|
| Comparison with Poisson distribution Blue bars denote a histogram of data divided into 1 sec bins. Red curve is a Poisson curve with rate = median count rate of data. |
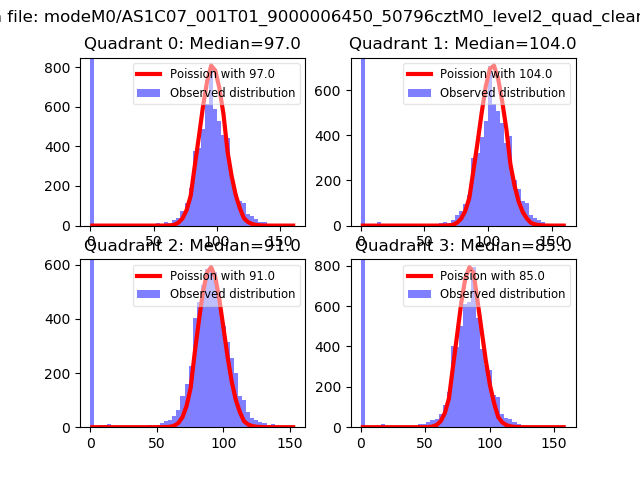 |
 |
| Quadrant-wise count rates Data is divided into 100 sec bins |
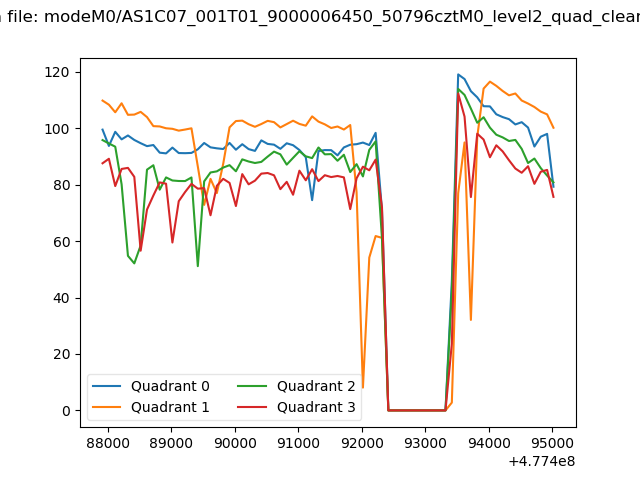 |
|
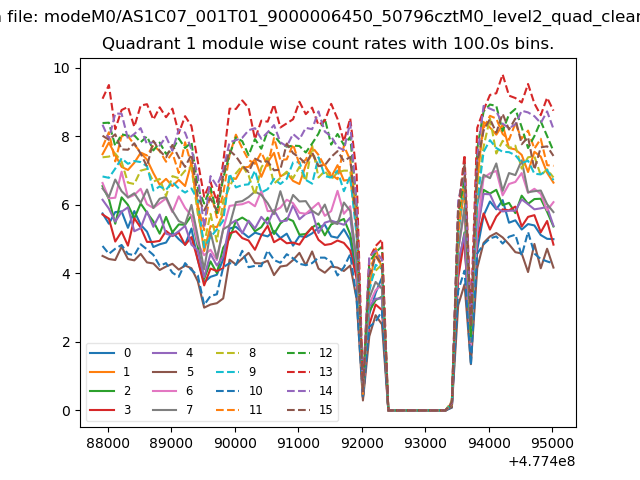
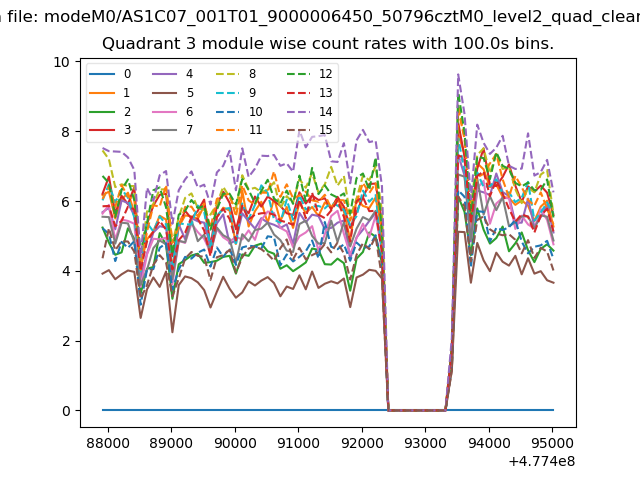
| Module-wise count rates for Quadrant A Data is divided into 100 sec bins |
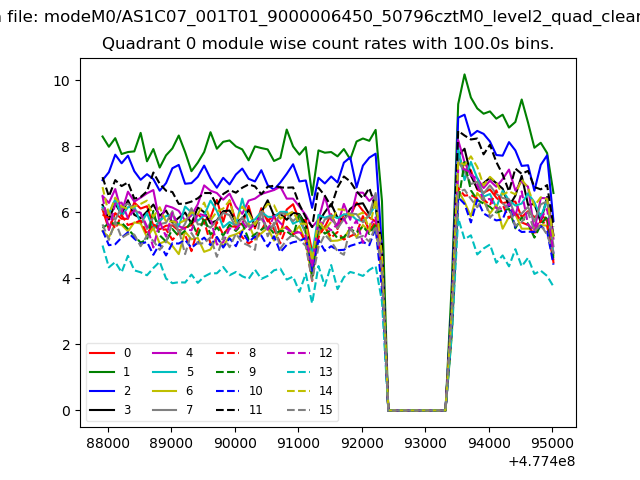 |
 |
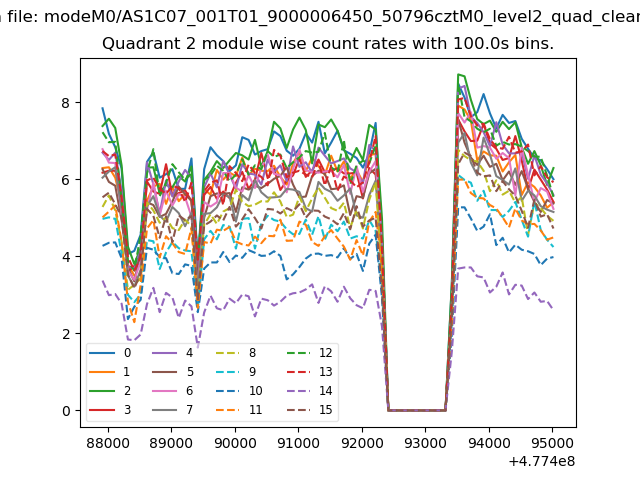
| Module-wise count rates for Quadrant B Data is divided into 100 sec bins |
 |
 |
| Module-wise count rates for Quadrant C Data is divided into 100 sec bins |
 |
 |
| Module-wise count rates for Quadrant D Data is divided into 100 sec bins |
 |
 |
| Parameter | Plot |
|---|---|
| CZT HV Monitor | 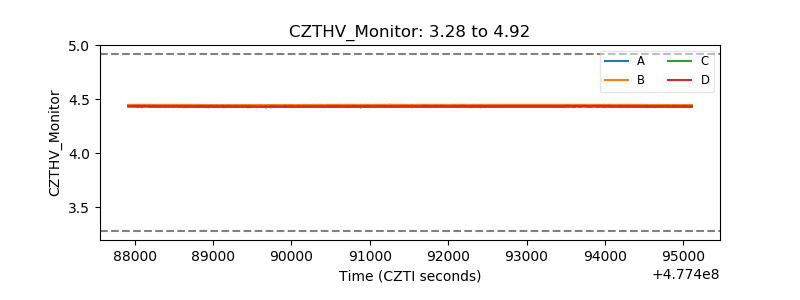 |
| D_VDD |  |
| Temperature 1 | 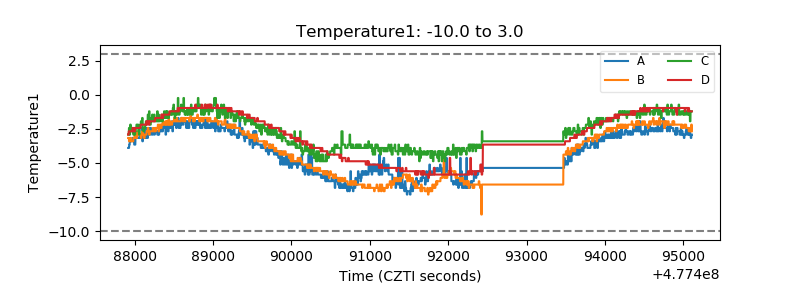 |
| Veto HV Monitor | 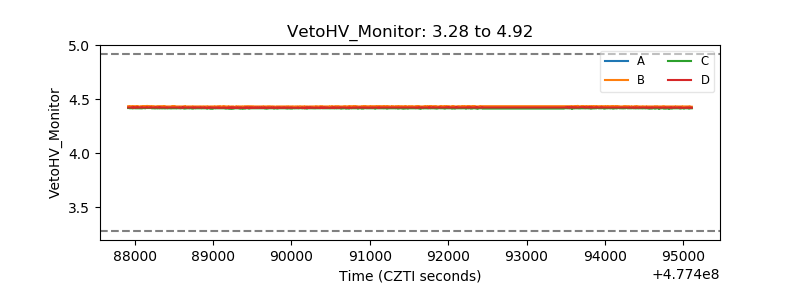 |
| Veto LLD | 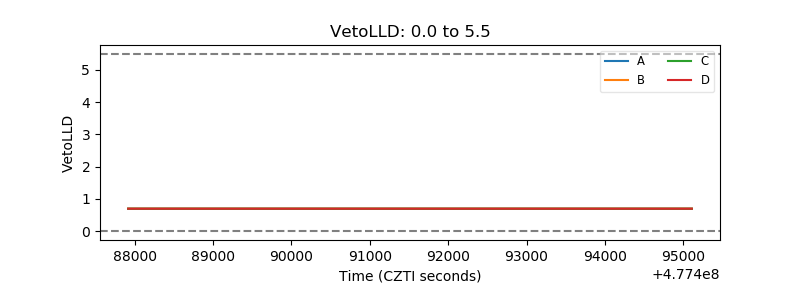 |
| Alpha Counter | 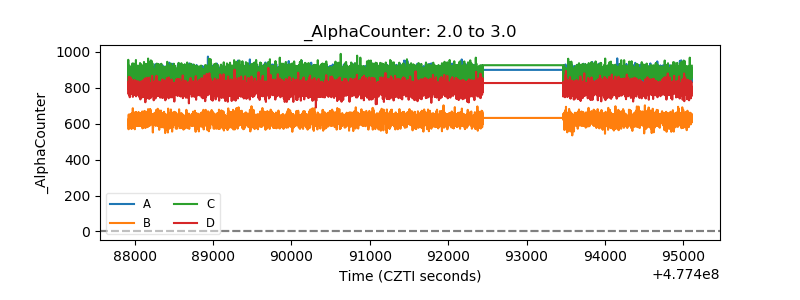 |
| _CPM_Rate | 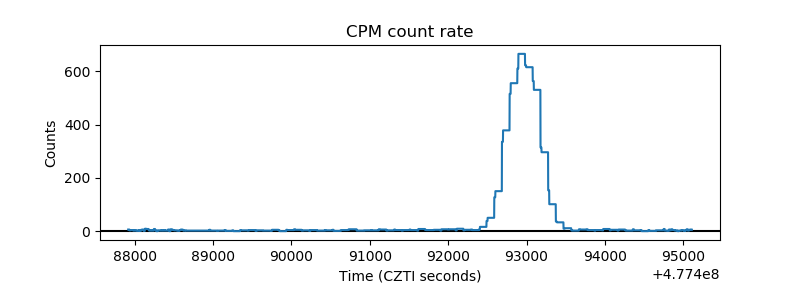 |
| CZT Counter | 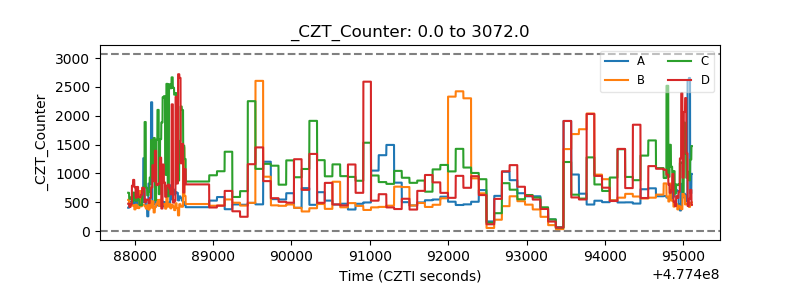 |
| +2.5 Volts monitor | 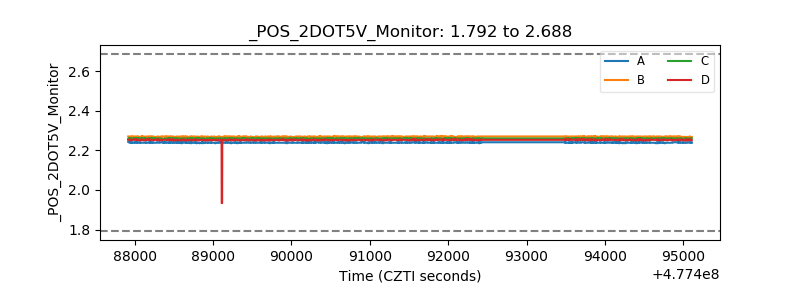 |
| +5 Volts monitor |  |
| _ROLL_ROT | 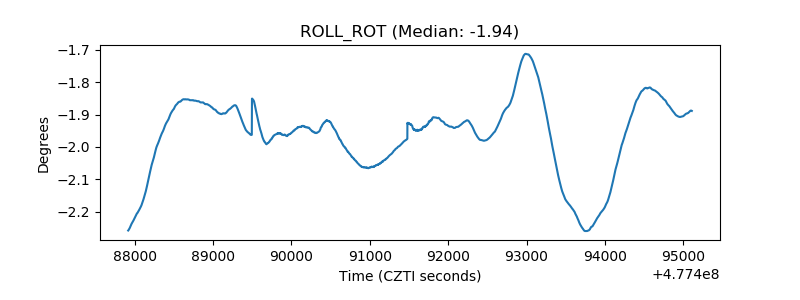 |
| _Roll_DEC | 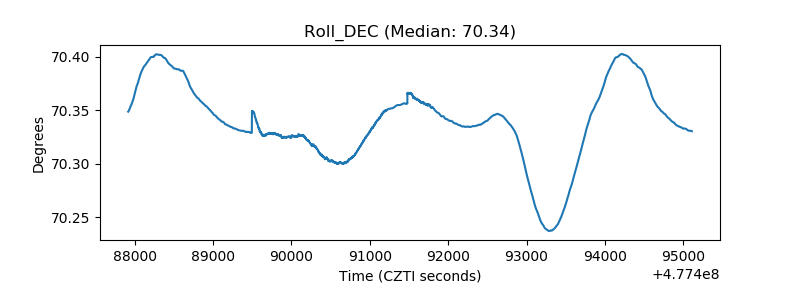 |
| _Roll_RA | 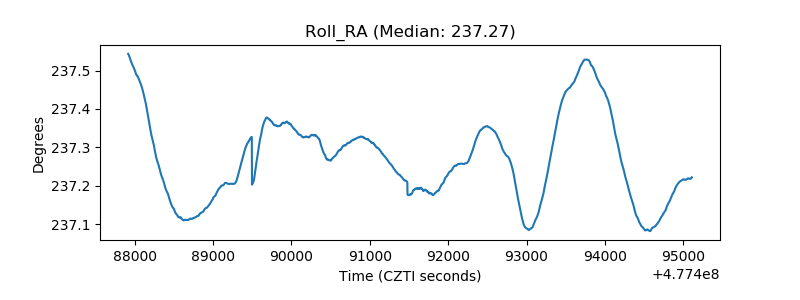 |
| Veto Counter | 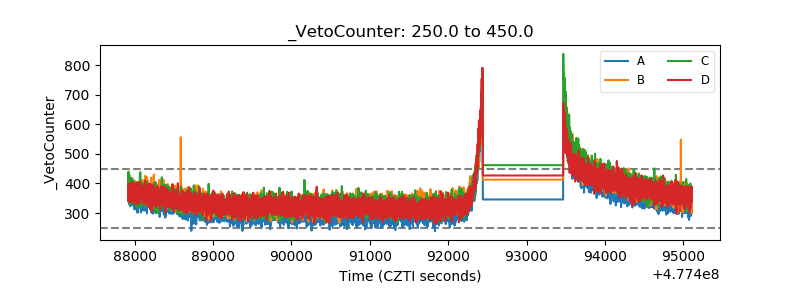 |