| Param | Original file | Final file |
|---|---|---|
| Filename | modeM0/AS1C07_001T01_9000006450_50798cztM0_level2.fits | modeM0/AS1C07_001T01_9000006450_50798cztM0_level2_quad_clean.evt |
| Size (bytes) | 536,088,960 | 91,800,000 |
| Size | 511.3 MB | 87.5 MB |
| Events in quadrant A | 3,835,060 | 603,213 |
| Events in quadrant B | 3,328,471 | 663,192 |
| Events in quadrant C | 7,898,081 | 545,686 |
| Events in quadrant D | 4,304,269 | 536,918 |
| Mode SS | |||
|---|---|---|---|
| Quadrant | BADHDUFLAG | Total packets | Discarded packets |
| A | 0 | 124 | 0 |
| B | 0 | 124 | 0 |
| C | 0 | 124 | 0 |
| D | 0 | 124 | 0 |
| Mode M0 | |||
|---|---|---|---|
| Quadrant | BADHDUFLAG | Total packets | Discarded packets |
| A | 0 | 15488 | 1 |
| B | 0 | 14189 | 1 |
| C | 0 | 27800 | 4 |
| D | 0 | 16957 | 1 |
| Mode M9 | |||
|---|---|---|---|
| Quadrant | BADHDUFLAG | Total packets | Discarded packets |
| A | 0 | 12 | 0 |
| B | 0 | 12 | 0 |
| C | 0 | 12 | 0 |
| D | 0 | 12 | 0 |
| Quadrant | Total seconds | Saturated seconds | Saturation percentage |
|---|---|---|---|
| A | 6174 | 250 | 4.049239% |
| B | 6174 | 164 | 2.656301% |
| C | 6174 | 671 | 10.868157% |
| D | 6174 | 282 | 4.567541% |
Noise dominated data is calculated using 1-second bins in cleaned event files. If a bin has >2000 counts, and if more than 50% of those come from <1% of pixels, then it is considered to be noise-dominated and hence unusable.
| Quadrant | # 1 sec bins | Bins with >0 counts | Bins with >2000 counts | High rate bins dominated by noise | Noise dominated (total time) | Noise dominated (detector-on time) | Marked lightcurve |
|---|---|---|---|---|---|---|---|
| A | 7309 | 6174 | 125 | 125 | 1.71% | 2.02% | 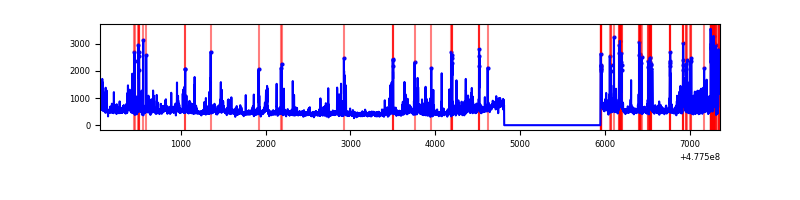 |
| B | 7309 | 6174 | 42 | 42 | 0.57% | 0.68% | 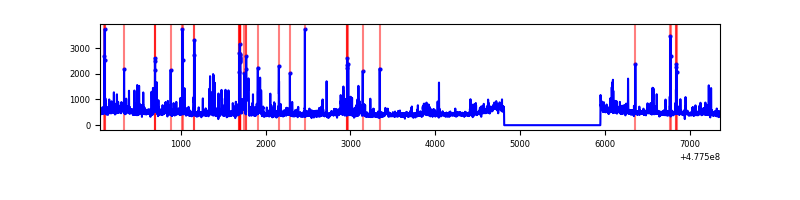 |
| C | 7309 | 6174 | 579 | 579 | 7.92% | 9.38% | 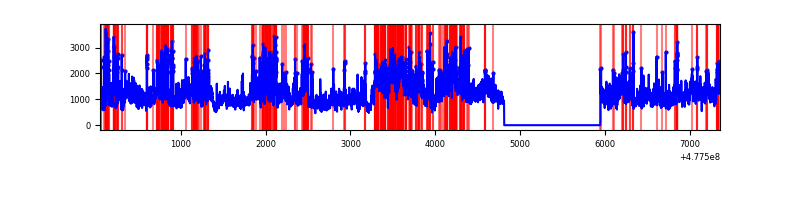 |
| D | 7309 | 6174 | 177 | 177 | 2.42% | 2.87% | 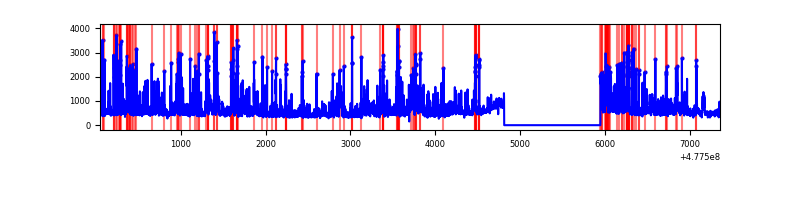 |
Top three noisy pixels from each quadrant. If the there are fewer than three noisy pixels in the level2.evt file, extra rows are filled as -1
| Pixel properties | Quadrant properties | ||||||
|---|---|---|---|---|---|---|---|
| Quadrant | DetID | PixID | Counts | Sigma | Mean | Median | Sigma |
| A | 8 | 38 | 129682 | 767.06 | 674 | 658 | 168.2 |
| A | 4 | 3 | 117130 | 692.44 | 674 | 658 | 168.2 |
| A | 11 | 3 | 106672 | 630.27 | 674 | 658 | 168.2 |
| B | 0 | 229 | 193551 | 1364.11 | 674 | 649 | 141.4 |
| B | 4 | 206 | 176780 | 1245.51 | 674 | 649 | 141.4 |
| B | 8 | 128 | 64877 | 454.19 | 674 | 649 | 141.4 |
| C | 5 | 10 | 3017898 | 17196.27 | 645 | 639 | 175.5 |
| C | 1 | 44 | 1084771 | 6178.79 | 645 | 639 | 175.5 |
| C | 13 | 3 | 259835 | 1477.24 | 645 | 639 | 175.5 |
| D | 2 | 216 | 425090 | 2362.21 | 652 | 629 | 179.7 |
| D | 2 | 249 | 205212 | 1138.54 | 652 | 629 | 179.7 |
| D | 2 | 153 | 135601 | 751.15 | 652 | 629 | 179.7 |
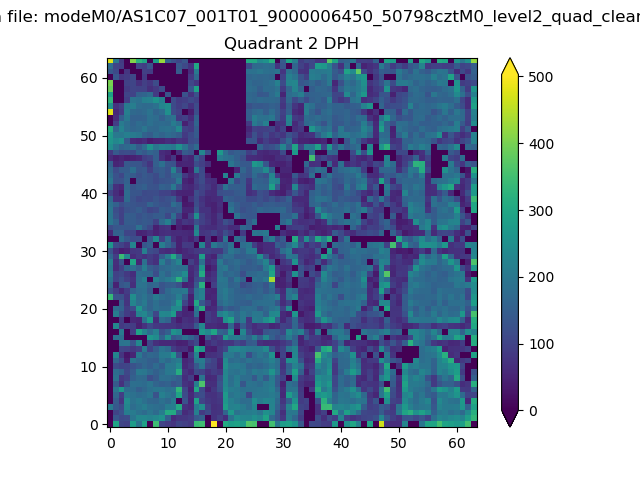
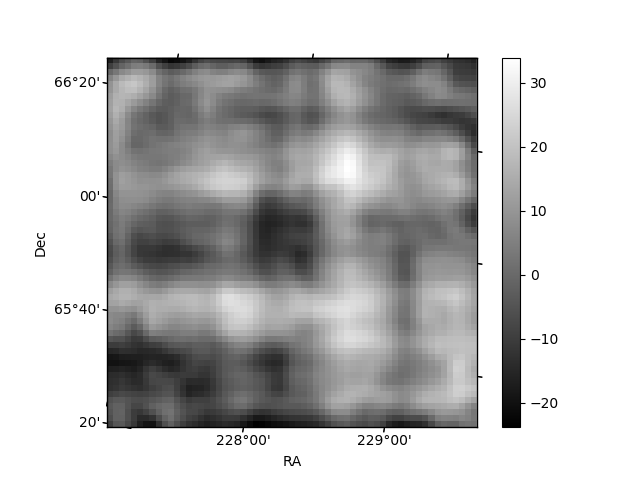
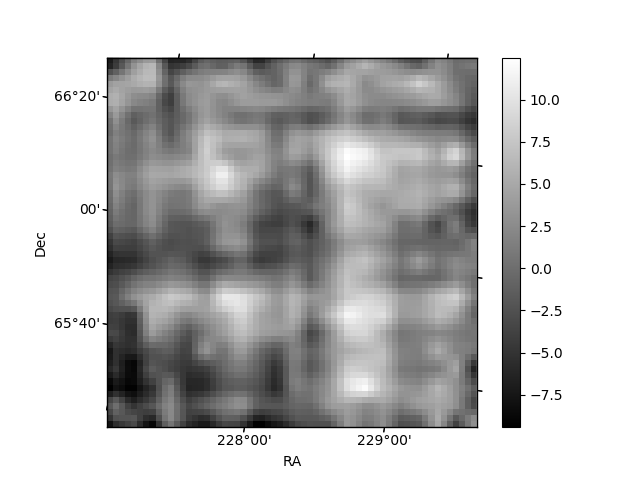
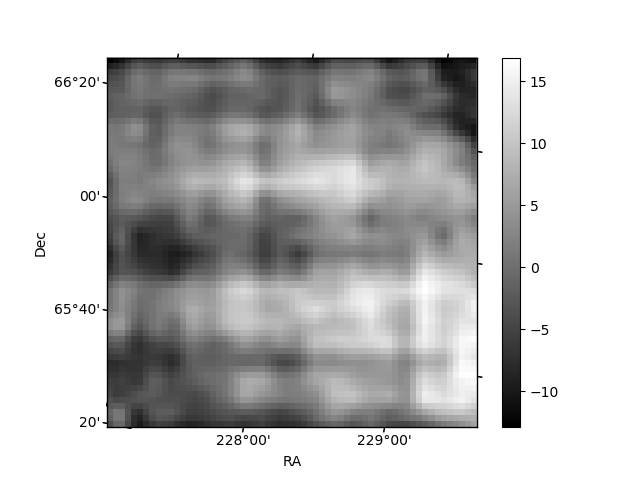
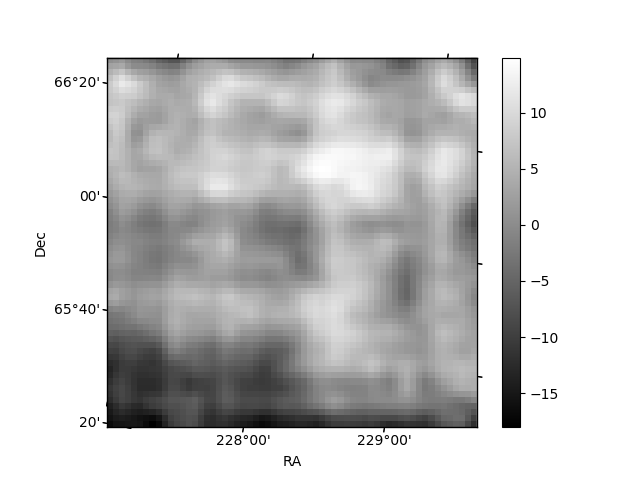
Histogram calculated using DETX and DETY for each event in the final _common_clean file
| Quadrant A | 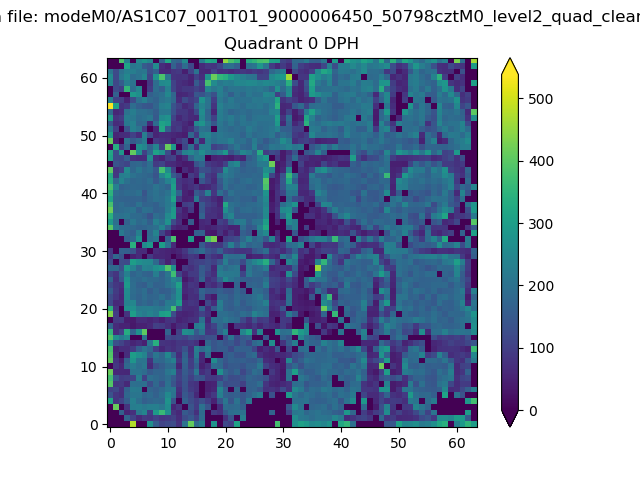 |
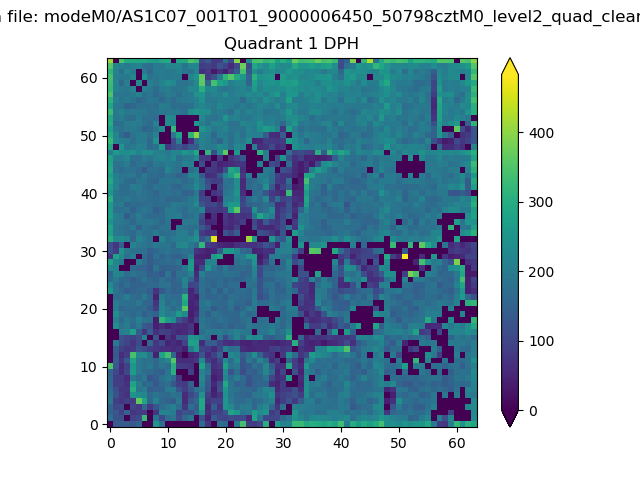 |
Quadrant B |
|---|---|---|---|
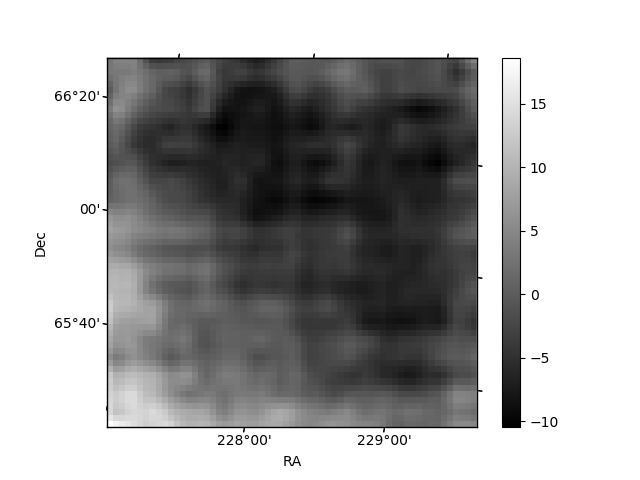
| Quadrant D | 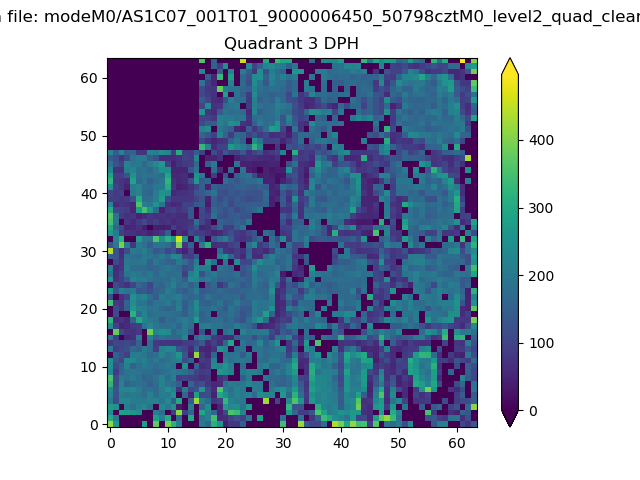 |
 |
Quadrant C |
| Plot type | Count rate plots | Images |
|---|---|---|
| Comparison with Poisson distribution Blue bars denote a histogram of data divided into 1 sec bins. Red curve is a Poisson curve with rate = median count rate of data. |
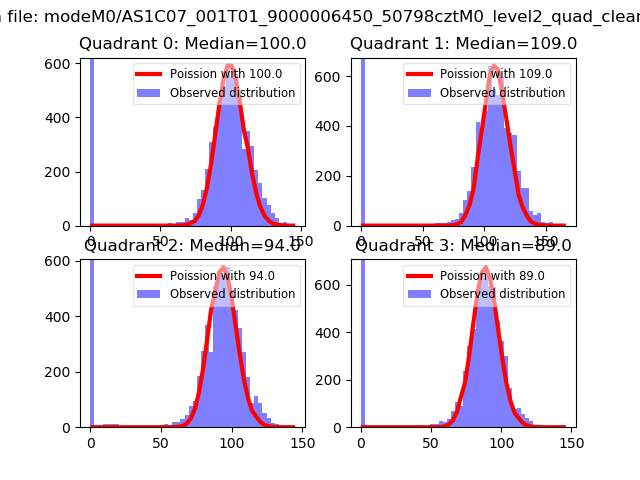 |
 |
| Quadrant-wise count rates Data is divided into 100 sec bins |
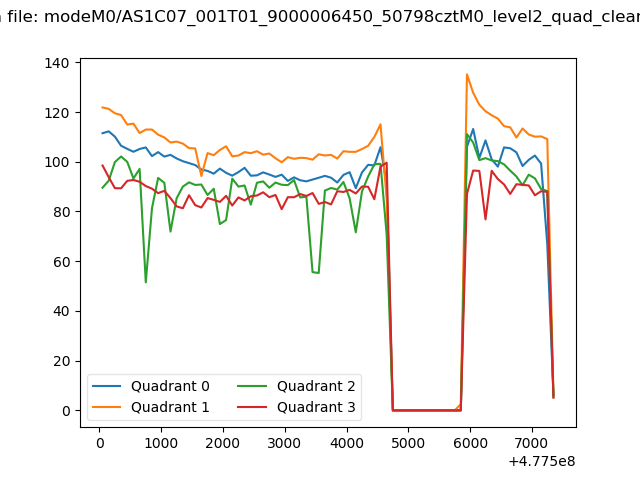 |
|
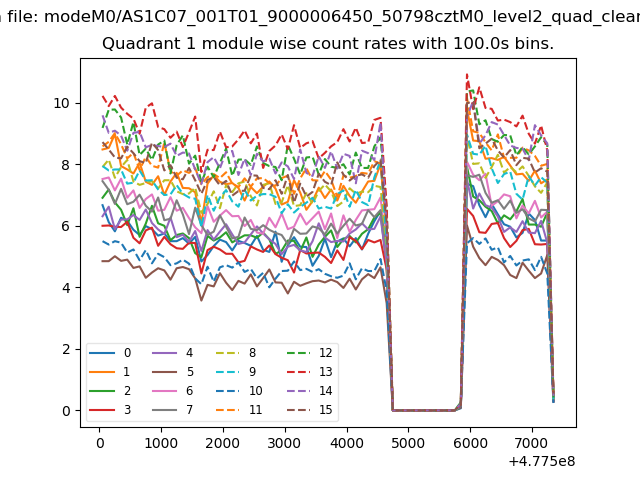
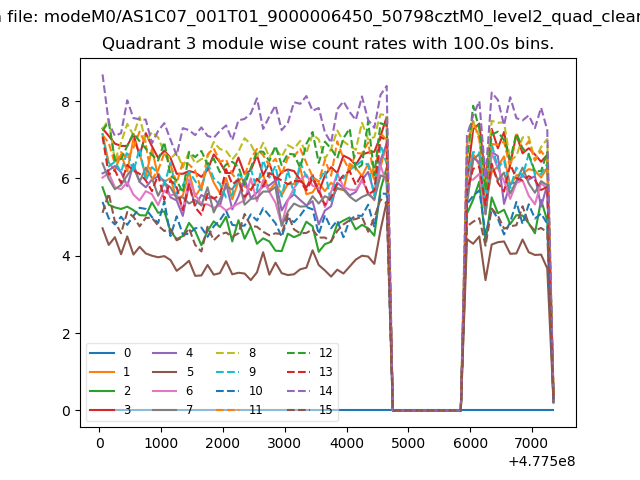
| Module-wise count rates for Quadrant A Data is divided into 100 sec bins |
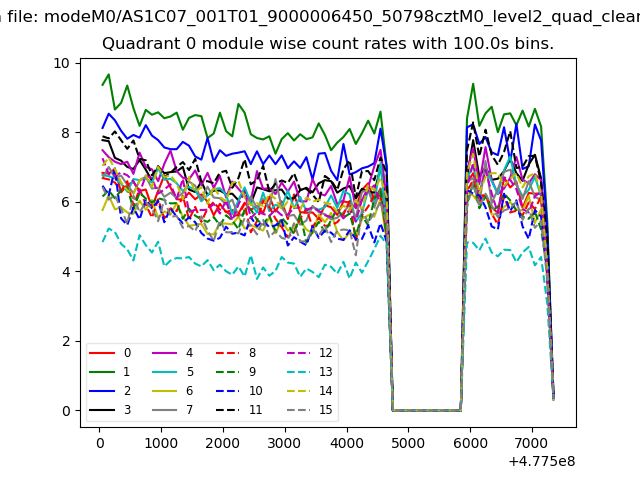 |
 |
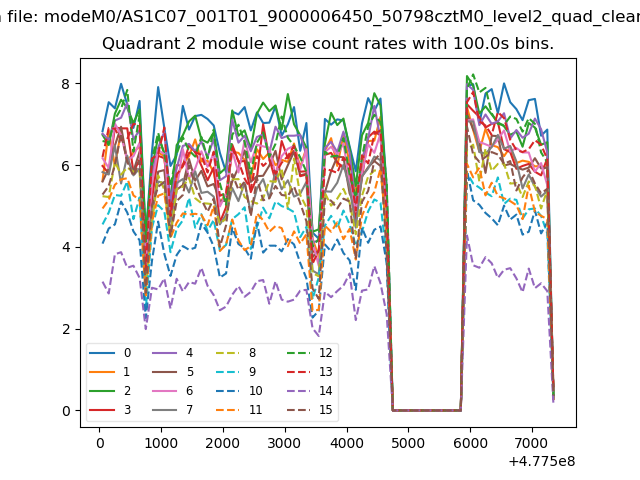
| Module-wise count rates for Quadrant B Data is divided into 100 sec bins |
 |
 |
| Module-wise count rates for Quadrant C Data is divided into 100 sec bins |
 |
 |
| Module-wise count rates for Quadrant D Data is divided into 100 sec bins |
 |
 |
| Parameter | Plot |
|---|---|
| CZT HV Monitor | 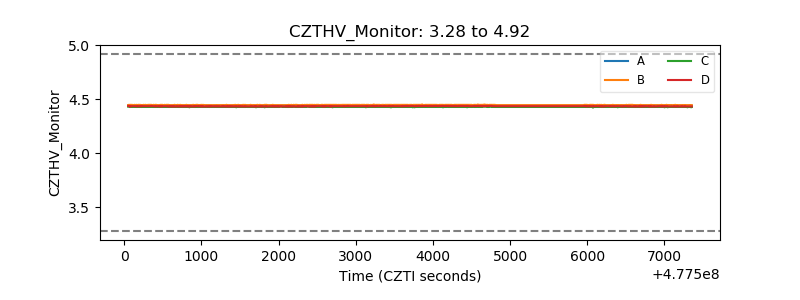 |
| D_VDD | 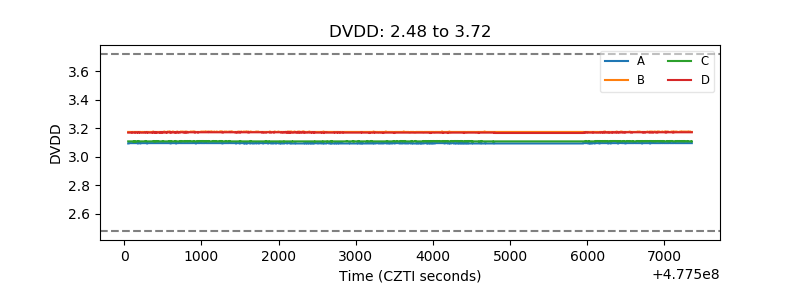 |
| Temperature 1 | 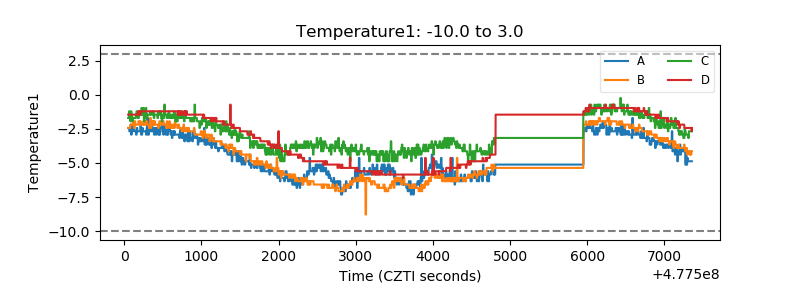 |
| Veto HV Monitor | 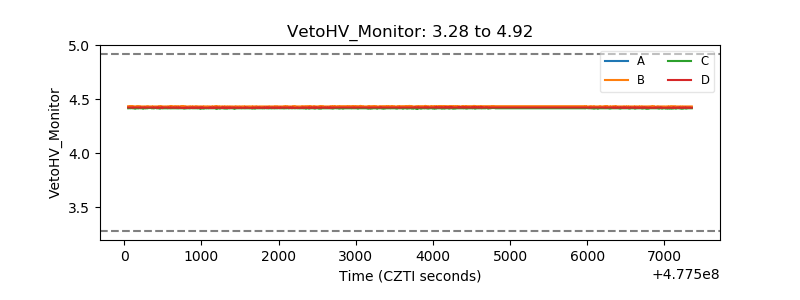 |
| Veto LLD | 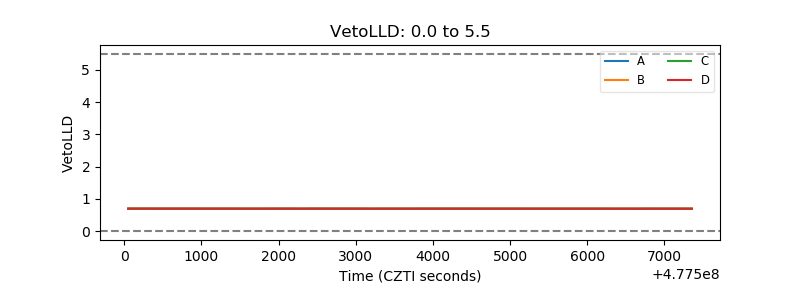 |
| Alpha Counter | 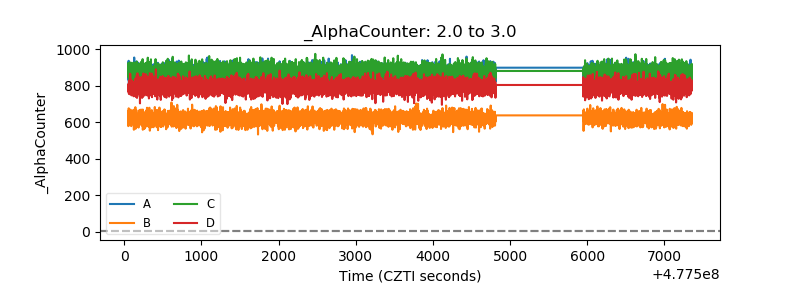 |
| _CPM_Rate | 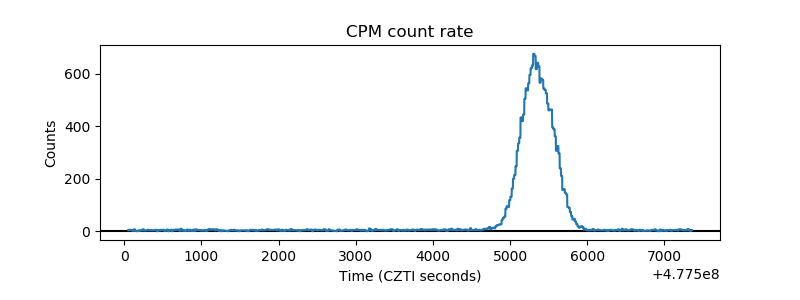 |
| CZT Counter | 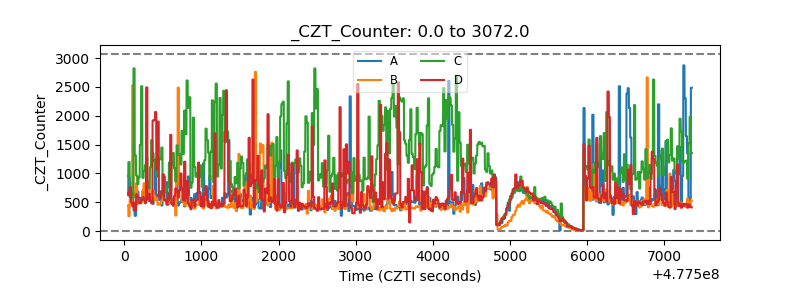 |
| +2.5 Volts monitor |  |
| +5 Volts monitor | 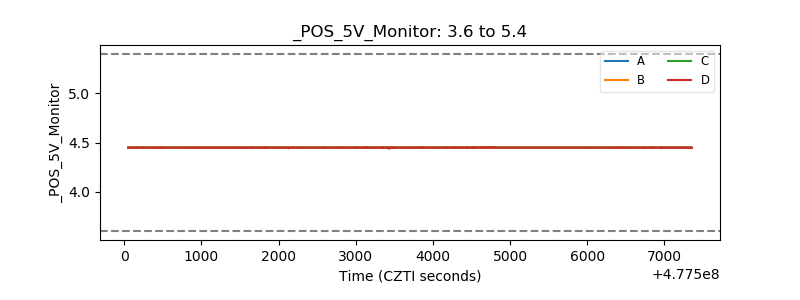 |
| _ROLL_ROT | 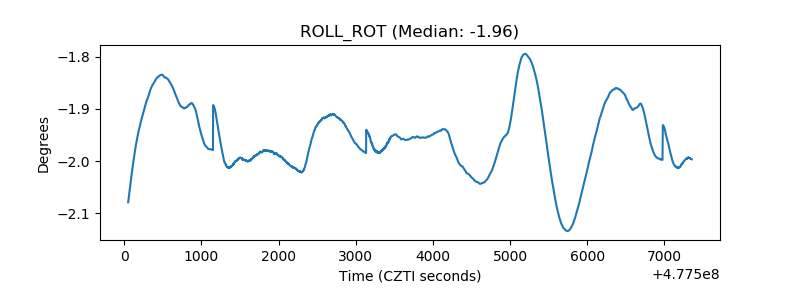 |
| _Roll_DEC | 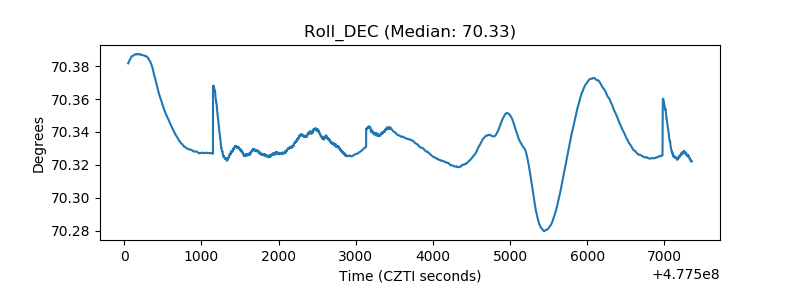 |
| _Roll_RA | 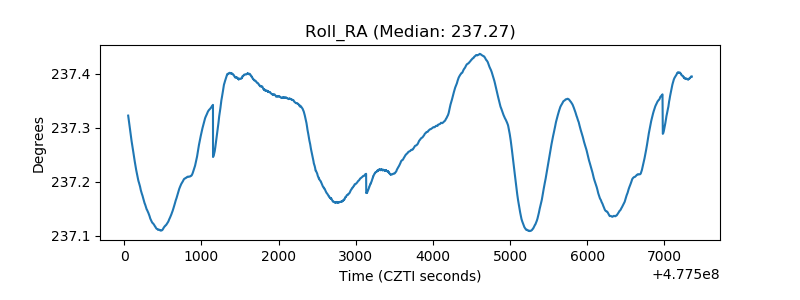 |
| Veto Counter | 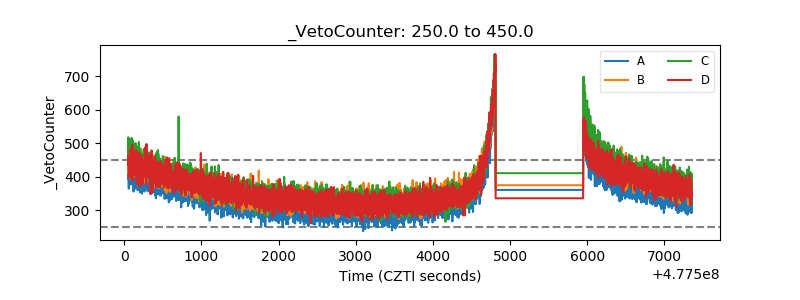 |