| Param | Original file | Final file |
|---|---|---|
| Filename | modeM0/AS1C07_001T01_9000006450_50799cztM0_level2.fits | modeM0/AS1C07_001T01_9000006450_50799cztM0_level2_quad_clean.evt |
| Size (bytes) | 548,688,960 | 92,079,360 |
| Size | 523.3 MB | 87.8 MB |
| Events in quadrant A | 3,823,344 | 610,332 |
| Events in quadrant B | 3,529,696 | 667,961 |
| Events in quadrant C | 6,334,570 | 568,481 |
| Events in quadrant D | 6,133,947 | 500,805 |
| Mode SS | |||
|---|---|---|---|
| Quadrant | BADHDUFLAG | Total packets | Discarded packets |
| A | 0 | 128 | 0 |
| B | 0 | 128 | 0 |
| C | 0 | 128 | 0 |
| D | 0 | 128 | 0 |
| Mode M0 | |||
|---|---|---|---|
| Quadrant | BADHDUFLAG | Total packets | Discarded packets |
| A | 0 | 15588 | 1 |
| B | 0 | 14901 | 1 |
| C | 0 | 23296 | 1 |
| D | 0 | 22553 | 4 |
| Mode M9 | |||
|---|---|---|---|
| Quadrant | BADHDUFLAG | Total packets | Discarded packets |
| A | 0 | 11 | 0 |
| B | 0 | 11 | 0 |
| C | 0 | 11 | 0 |
| D | 0 | 11 | 0 |
| Quadrant | Total seconds | Saturated seconds | Saturation percentage |
|---|---|---|---|
| A | 6313 | 216 | 3.421511% |
| B | 6313 | 177 | 2.803738% |
| C | 6313 | 371 | 5.876762% |
| D | 6313 | 784 | 12.418818% |
Noise dominated data is calculated using 1-second bins in cleaned event files. If a bin has >2000 counts, and if more than 50% of those come from <1% of pixels, then it is considered to be noise-dominated and hence unusable.
| Quadrant | # 1 sec bins | Bins with >0 counts | Bins with >2000 counts | High rate bins dominated by noise | Noise dominated (total time) | Noise dominated (detector-on time) | Marked lightcurve |
|---|---|---|---|---|---|---|---|
| A | 7383 | 6313 | 127 | 127 | 1.72% | 2.01% | 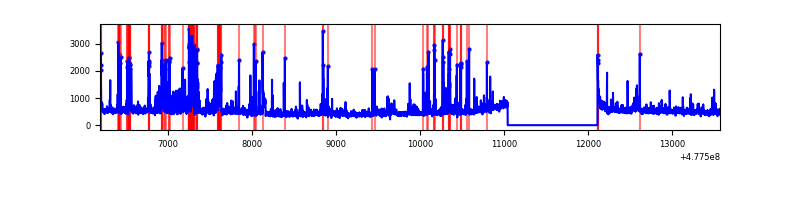 |
| B | 7383 | 6313 | 67 | 67 | 0.91% | 1.06% | 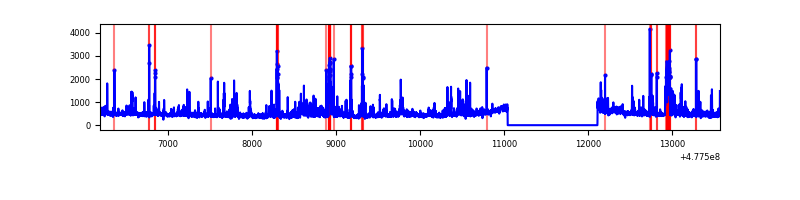 |
| C | 7383 | 6313 | 206 | 206 | 2.79% | 3.26% | 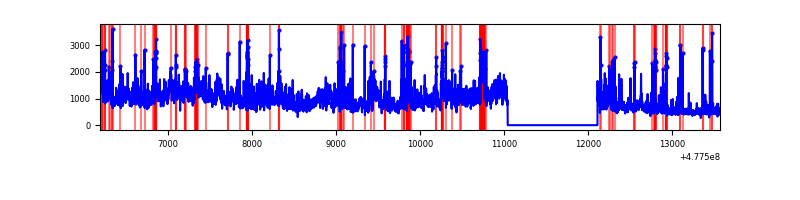 |
| D | 7382 | 6312 | 678 | 678 | 9.18% | 10.74% | 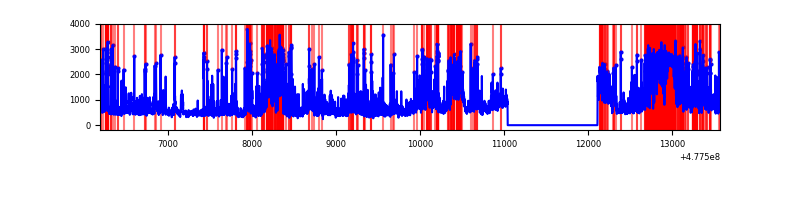 |
Top three noisy pixels from each quadrant. If the there are fewer than three noisy pixels in the level2.evt file, extra rows are filled as -1
| Pixel properties | Quadrant properties | ||||||
|---|---|---|---|---|---|---|---|
| Quadrant | DetID | PixID | Counts | Sigma | Mean | Median | Sigma |
| A | 11 | 3 | 224236 | 1320.49 | 681 | 665 | 169.3 |
| A | 4 | 3 | 175710 | 1033.87 | 681 | 665 | 169.3 |
| A | 4 | 191 | 132019 | 775.82 | 681 | 665 | 169.3 |
| B | 4 | 206 | 264349 | 1836.32 | 683 | 658 | 143.6 |
| B | 5 | 185 | 122846 | 850.9 | 683 | 658 | 143.6 |
| B | 0 | 229 | 98160 | 678.99 | 683 | 658 | 143.6 |
| C | 5 | 10 | 2505304 | 13773.45 | 662 | 656 | 181.8 |
| C | 1 | 44 | 271048 | 1486.93 | 662 | 656 | 181.8 |
| C | 1 | 60 | 151689 | 830.55 | 662 | 656 | 181.8 |
| D | 15 | 125 | 801051 | 4534.26 | 636 | 611 | 176.5 |
| D | 2 | 249 | 595501 | 3369.88 | 636 | 611 | 176.5 |
| D | 1 | 47 | 561894 | 3179.5 | 636 | 611 | 176.5 |
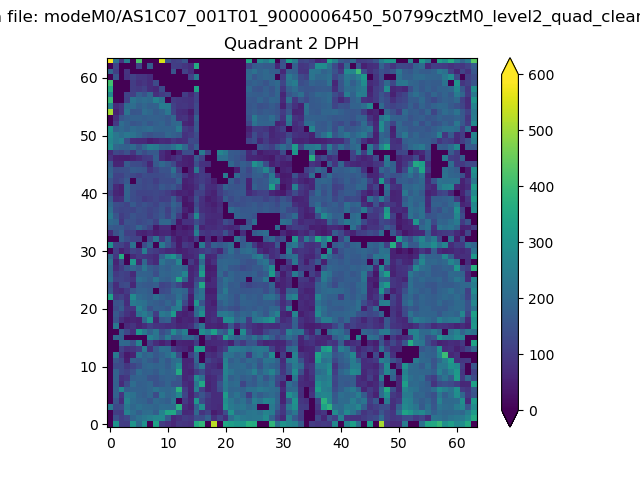
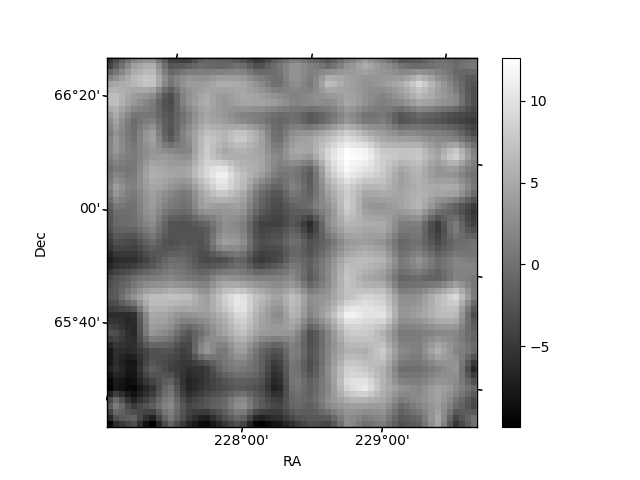
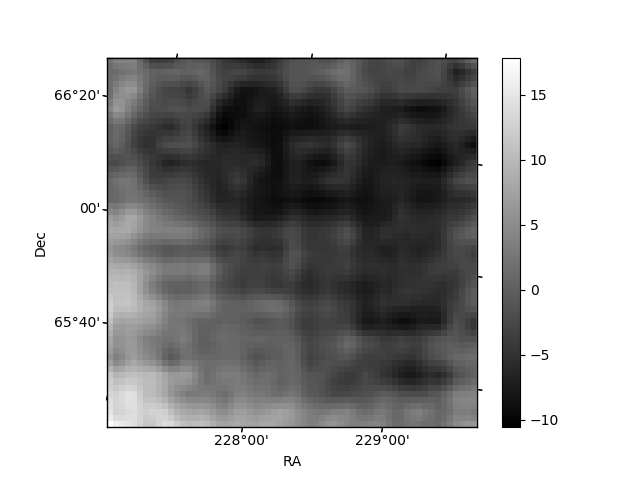
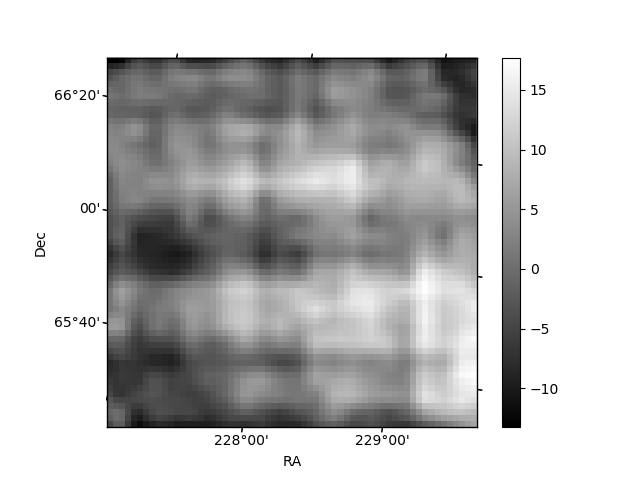
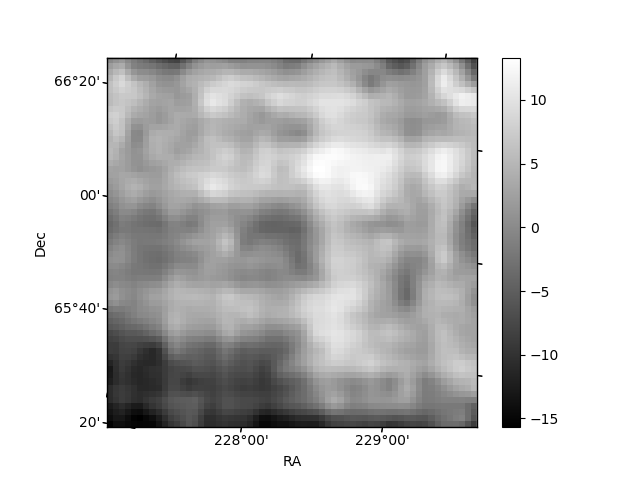
Histogram calculated using DETX and DETY for each event in the final _common_clean file
| Quadrant A | 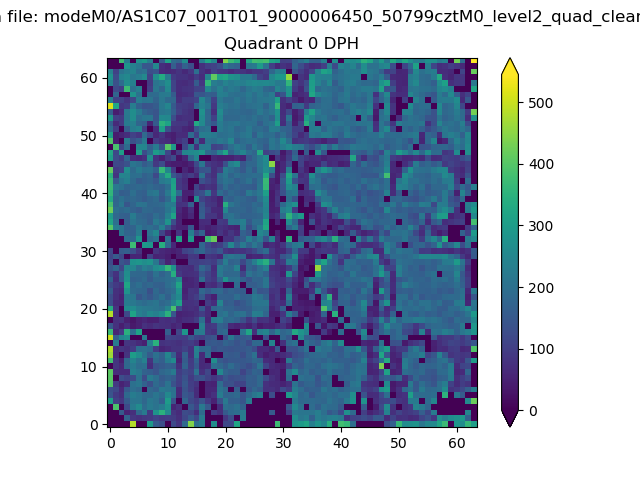 |
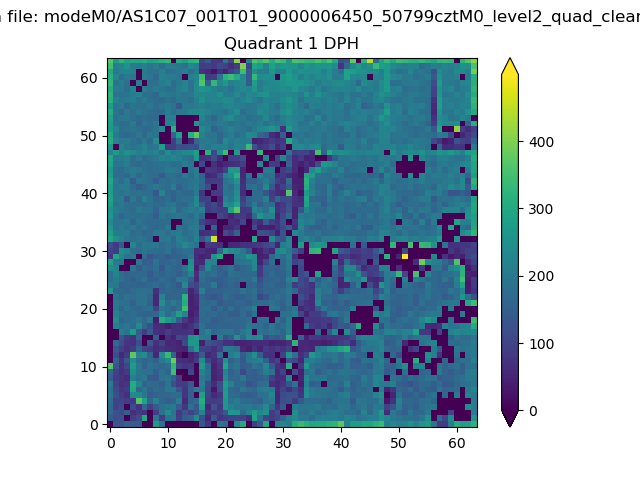 |
Quadrant B |
|---|---|---|---|
| Quadrant D | 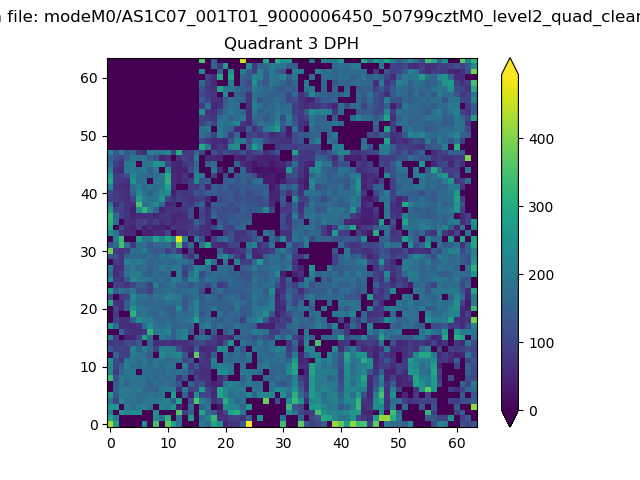 |
 |
Quadrant C |
| Plot type | Count rate plots | Images |
|---|---|---|
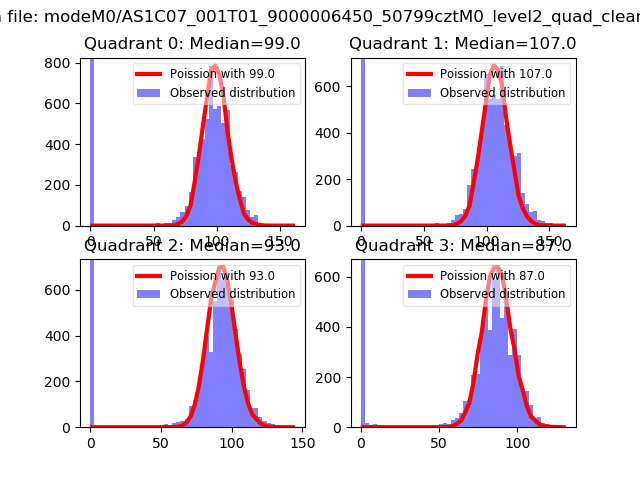
| Comparison with Poisson distribution Blue bars denote a histogram of data divided into 1 sec bins. Red curve is a Poisson curve with rate = median count rate of data. |
 |
 |
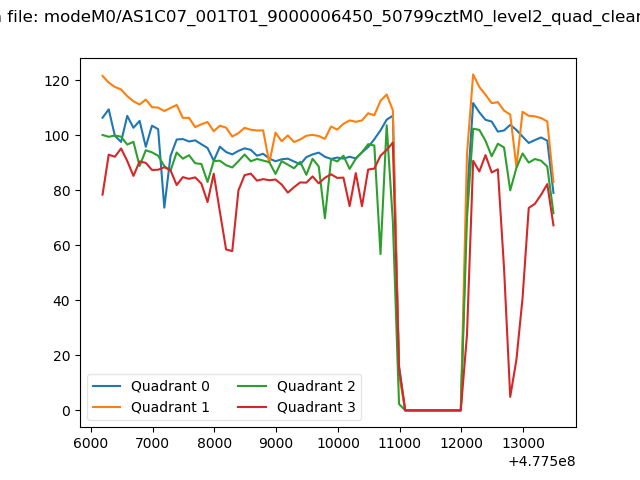
| Quadrant-wise count rates Data is divided into 100 sec bins |
 |
|
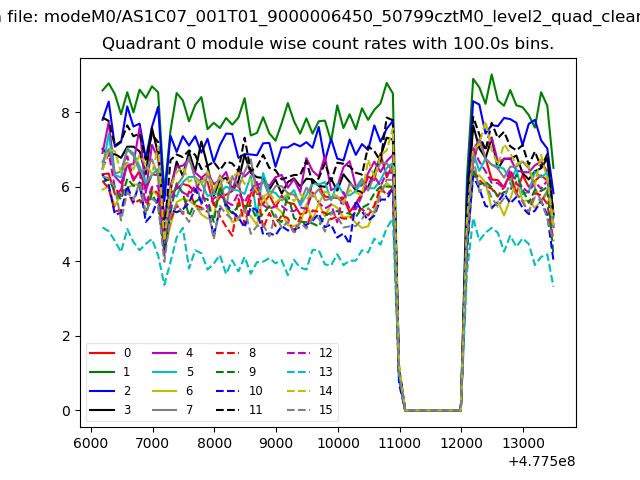
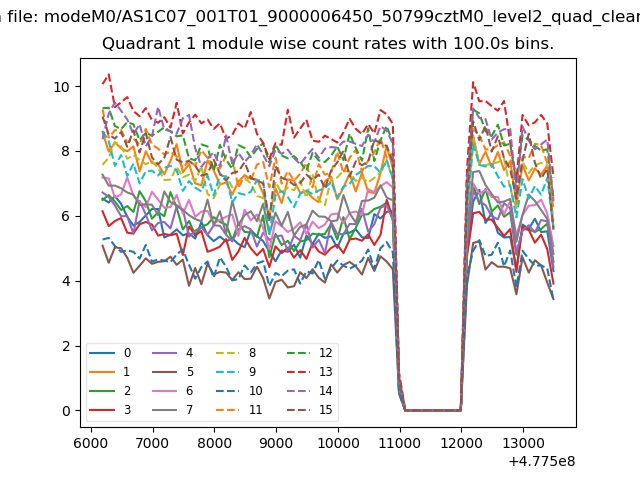
| Module-wise count rates for Quadrant A Data is divided into 100 sec bins |
 |
 |
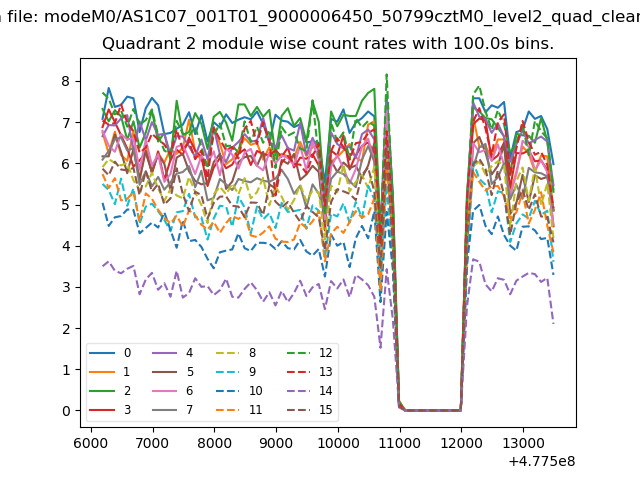
| Module-wise count rates for Quadrant B Data is divided into 100 sec bins |
 |
 |
| Module-wise count rates for Quadrant C Data is divided into 100 sec bins |
 |
 |
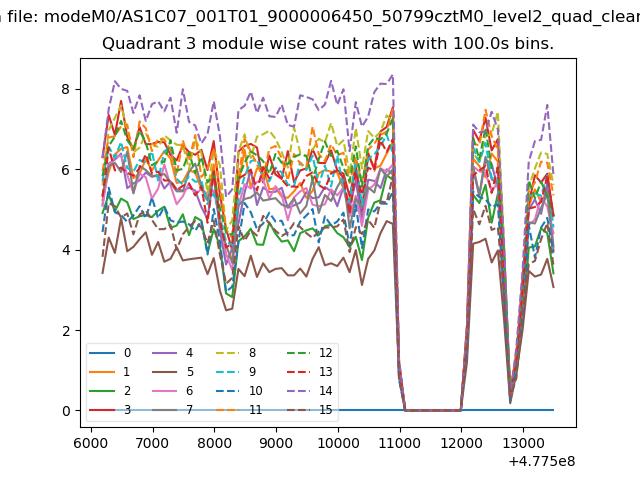
| Module-wise count rates for Quadrant D Data is divided into 100 sec bins |
 |
 |
| Parameter | Plot |
|---|---|
| CZT HV Monitor | 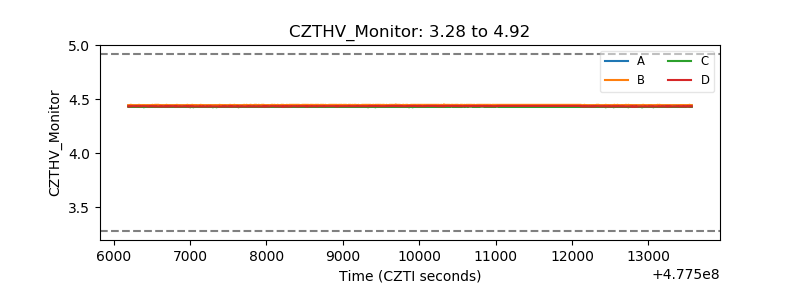 |
| D_VDD | 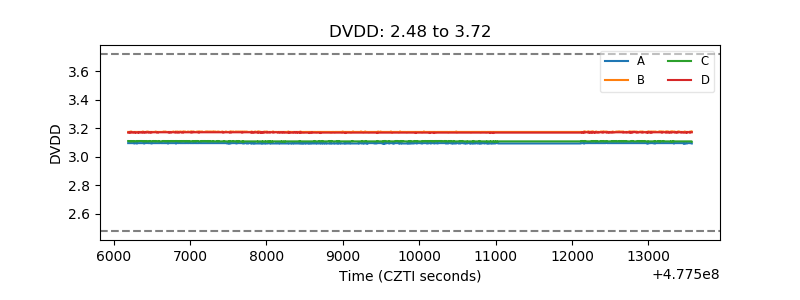 |
| Temperature 1 |  |
| Veto HV Monitor | 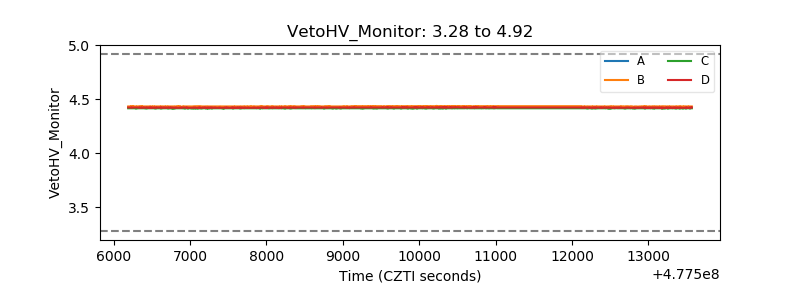 |
| Veto LLD | 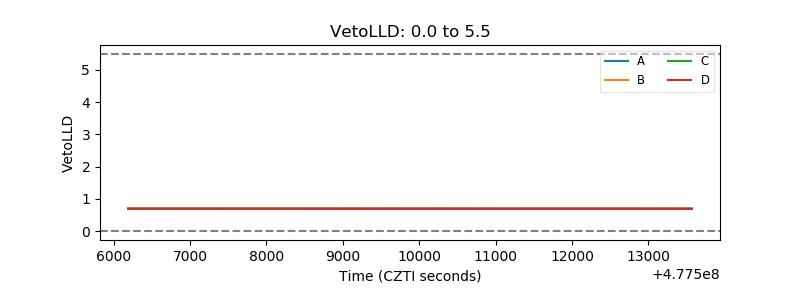 |
| Alpha Counter | 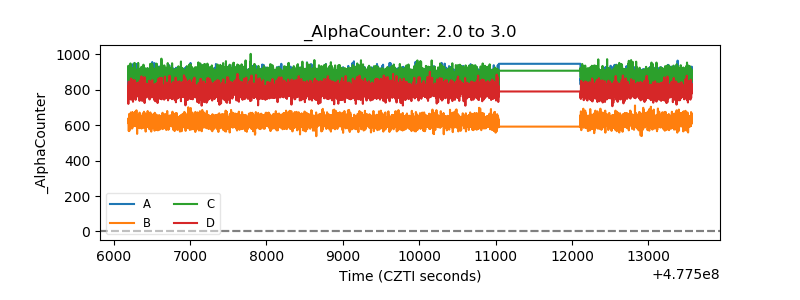 |
| _CPM_Rate | 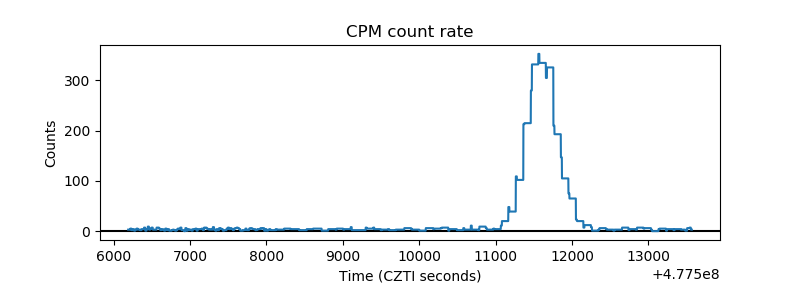 |
| CZT Counter | 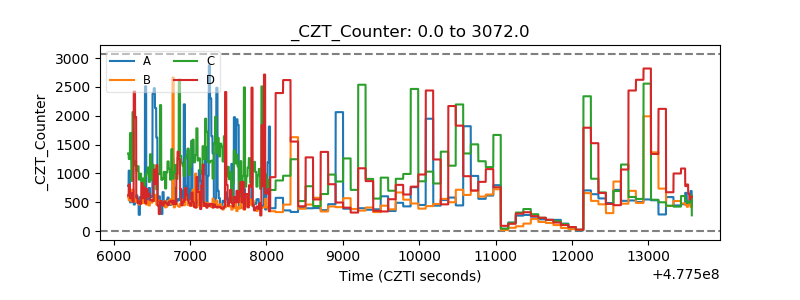 |
| +2.5 Volts monitor | 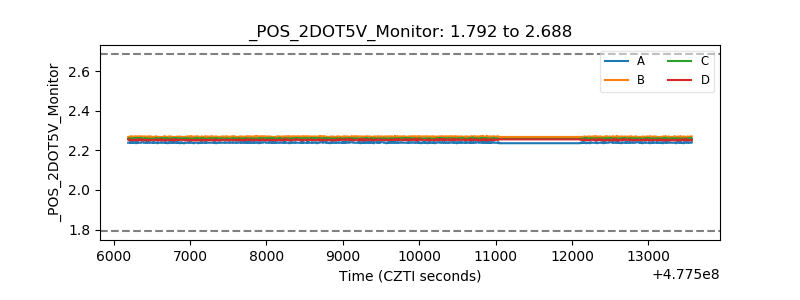 |
| +5 Volts monitor | 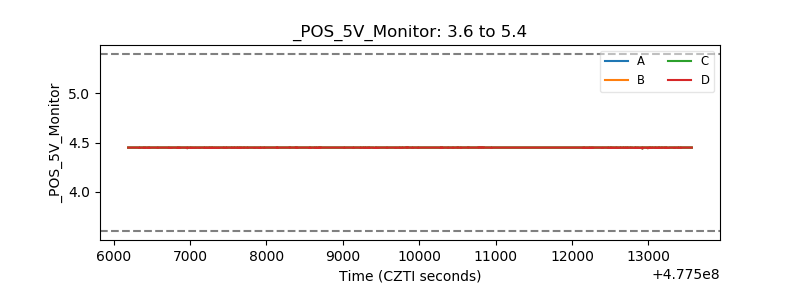 |
| _ROLL_ROT | 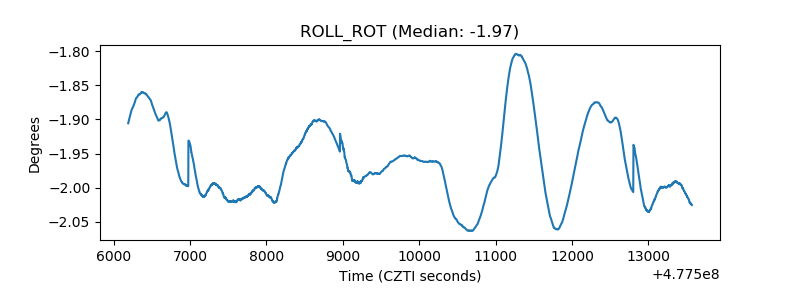 |
| _Roll_DEC | 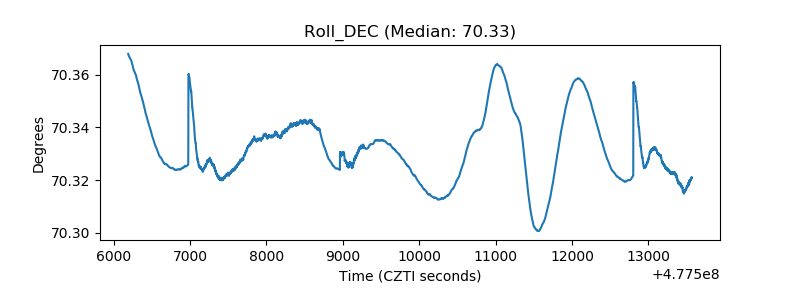 |
| _Roll_RA | 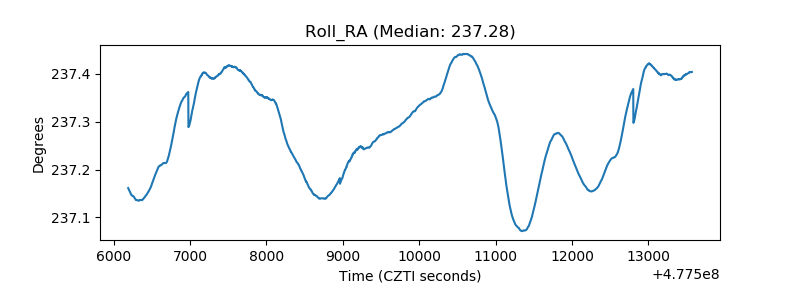 |
| Veto Counter | 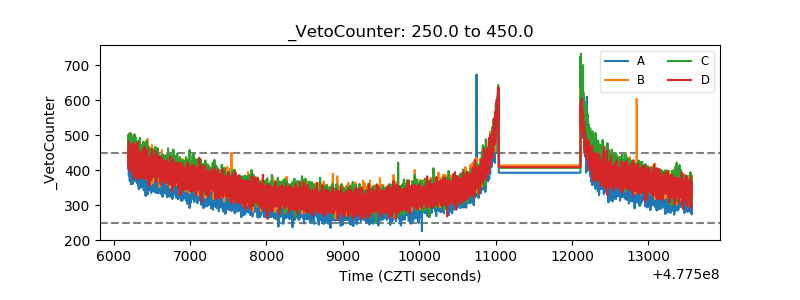 |