| Param | Original file | Final file |
|---|---|---|
| Filename | modeM0/AS1C07_001T01_9000006450_50800cztM0_level2.fits | modeM0/AS1C07_001T01_9000006450_50800cztM0_level2_quad_clean.evt |
| Size (bytes) | 530,979,840 | 91,759,680 |
| Size | 506.4 MB | 87.5 MB |
| Events in quadrant A | 3,500,683 | 612,418 |
| Events in quadrant B | 3,614,336 | 659,210 |
| Events in quadrant C | 5,415,660 | 560,657 |
| Events in quadrant D | 6,623,971 | 496,199 |
| Mode SS | |||
|---|---|---|---|
| Quadrant | BADHDUFLAG | Total packets | Discarded packets |
| A | 0 | 130 | 0 |
| B | 0 | 130 | 0 |
| C | 0 | 130 | 0 |
| D | 0 | 130 | 0 |
| Mode M0 | |||
|---|---|---|---|
| Quadrant | BADHDUFLAG | Total packets | Discarded packets |
| A | 0 | 14804 | 1 |
| B | 0 | 15312 | 1 |
| C | 0 | 20471 | 1 |
| D | 0 | 24159 | 5 |
| Mode M9 | |||
|---|---|---|---|
| Quadrant | BADHDUFLAG | Total packets | Discarded packets |
| A | 0 | 10 | 0 |
| B | 0 | 10 | 0 |
| C | 0 | 10 | 0 |
| D | 0 | 10 | 0 |
| Quadrant | Total seconds | Saturated seconds | Saturation percentage |
|---|---|---|---|
| A | 6450 | 99 | 1.534884% |
| B | 6451 | 212 | 3.286312% |
| C | 6451 | 523 | 8.107270% |
| D | 6450 | 869 | 13.472868% |
Noise dominated data is calculated using 1-second bins in cleaned event files. If a bin has >2000 counts, and if more than 50% of those come from <1% of pixels, then it is considered to be noise-dominated and hence unusable.
| Quadrant | # 1 sec bins | Bins with >0 counts | Bins with >2000 counts | High rate bins dominated by noise | Noise dominated (total time) | Noise dominated (detector-on time) | Marked lightcurve |
|---|---|---|---|---|---|---|---|
| A | 7395 | 6451 | 45 | 45 | 0.61% | 0.70% | 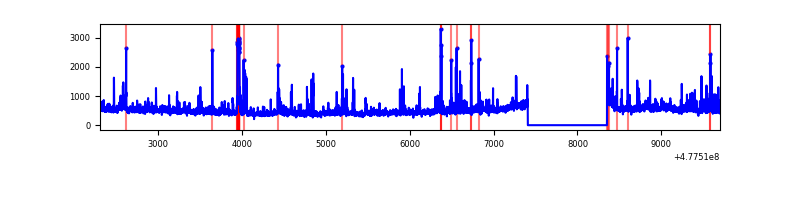 |
| B | 7396 | 6452 | 125 | 125 | 1.69% | 1.94% | 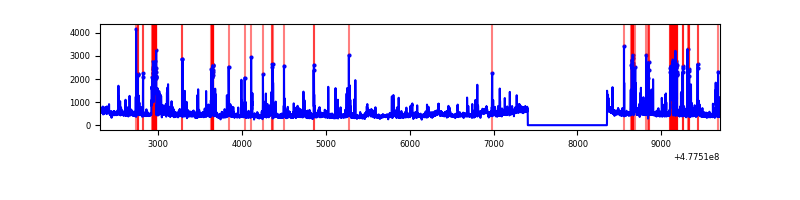 |
| C | 7396 | 6451 | 376 | 376 | 5.08% | 5.83% | 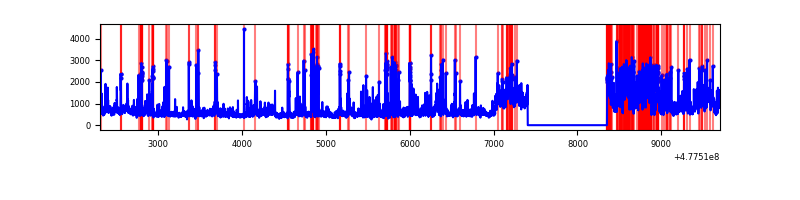 |
| D | 7395 | 6451 | 836 | 836 | 11.30% | 12.96% | 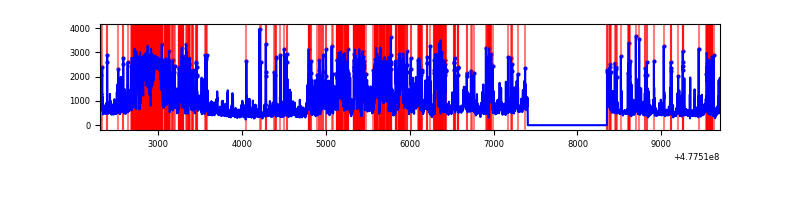 |
Top three noisy pixels from each quadrant. If the there are fewer than three noisy pixels in the level2.evt file, extra rows are filled as -1
| Pixel properties | Quadrant properties | ||||||
|---|---|---|---|---|---|---|---|
| Quadrant | DetID | PixID | Counts | Sigma | Mean | Median | Sigma |
| A | 4 | 3 | 170224 | 993.62 | 681 | 661 | 170.7 |
| A | 8 | 38 | 100537 | 585.26 | 681 | 661 | 170.7 |
| A | 5 | 240 | 85760 | 498.67 | 681 | 661 | 170.7 |
| B | 8 | 128 | 291693 | 2012.4 | 678 | 653 | 144.6 |
| B | 4 | 206 | 209889 | 1446.77 | 678 | 653 | 144.6 |
| B | 5 | 185 | 103197 | 709.04 | 678 | 653 | 144.6 |
| C | 5 | 10 | 1234310 | 6784.2 | 657 | 649 | 181.8 |
| C | 13 | 3 | 267013 | 1464.8 | 657 | 649 | 181.8 |
| C | 10 | 171 | 246079 | 1349.68 | 657 | 649 | 181.8 |
| D | 10 | 172 | 1258789 | 7109.28 | 632 | 610 | 177.0 |
| D | 15 | 125 | 716984 | 4047.84 | 632 | 610 | 177.0 |
| D | 2 | 249 | 653109 | 3686.91 | 632 | 610 | 177.0 |
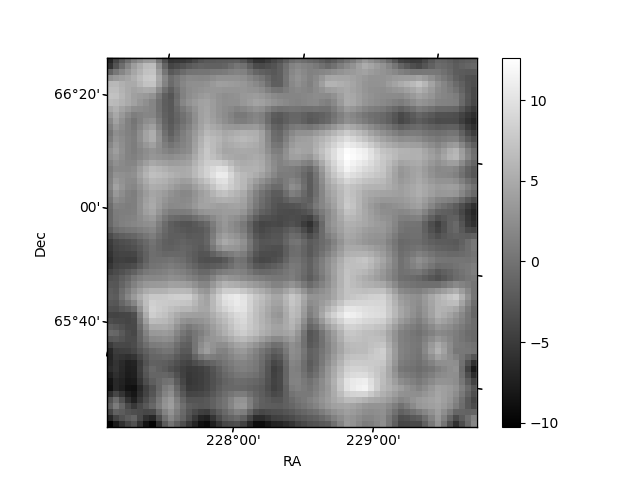
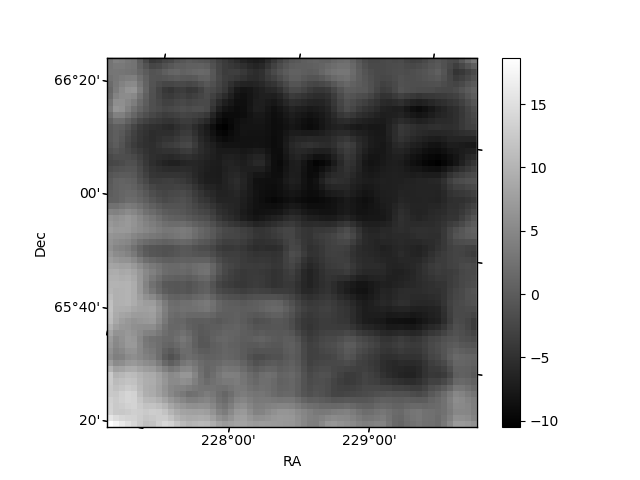
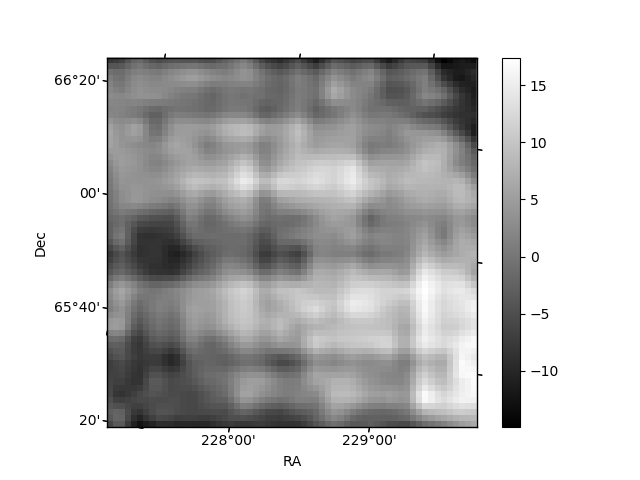
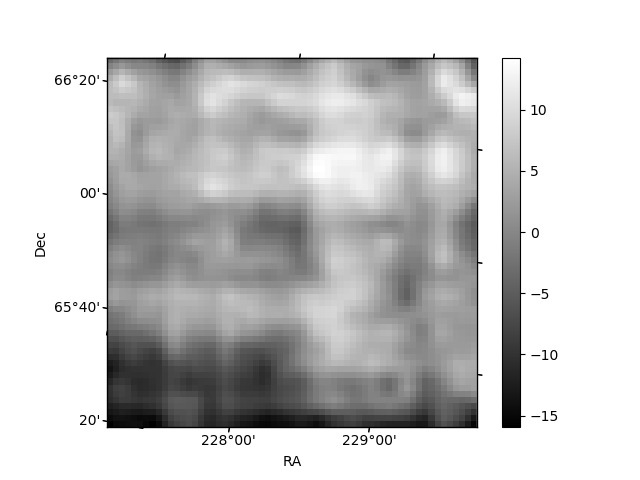
Histogram calculated using DETX and DETY for each event in the final _common_clean file
| Quadrant A | 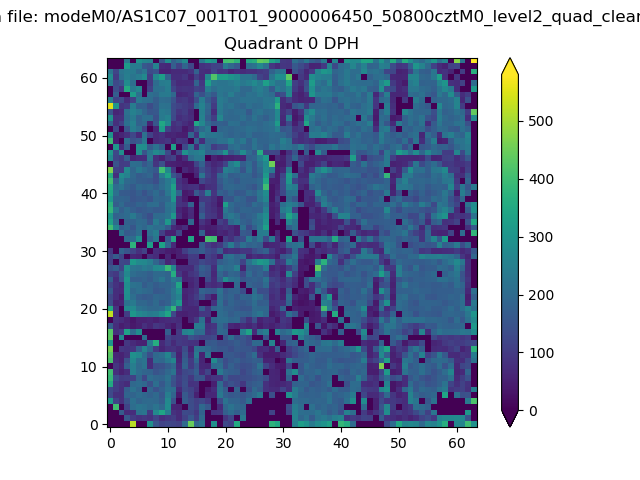 |
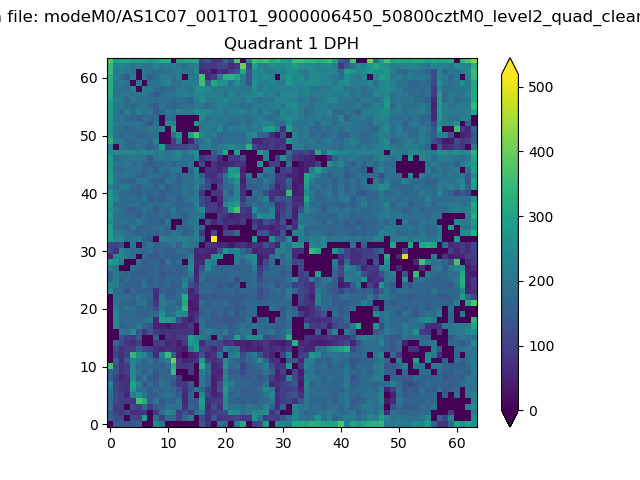 |
Quadrant B |
|---|---|---|---|
| Quadrant D | 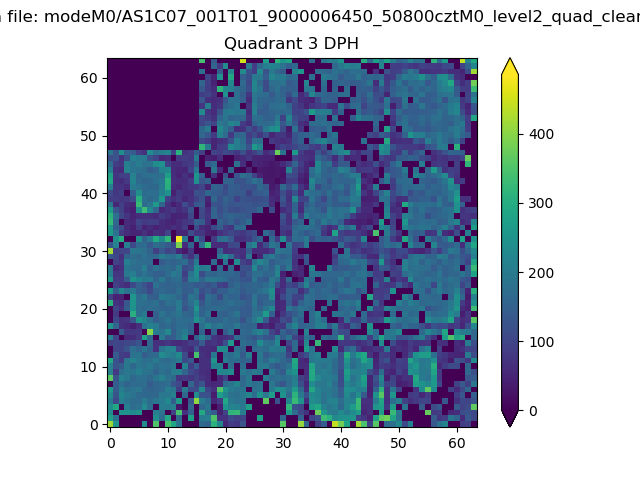 |
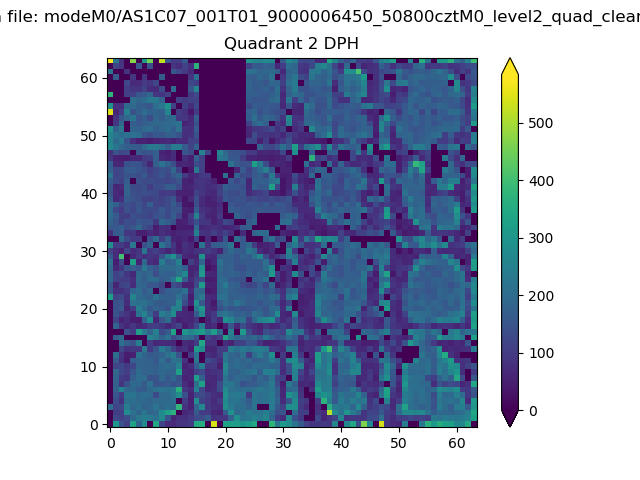 |
Quadrant C |
| Plot type | Count rate plots | Images |
|---|---|---|
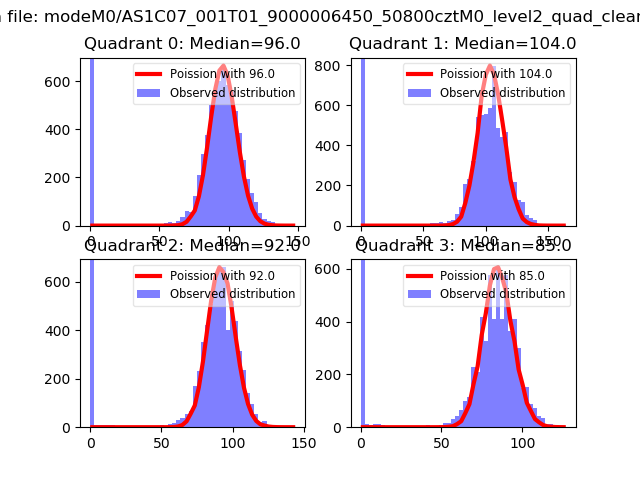
| Comparison with Poisson distribution Blue bars denote a histogram of data divided into 1 sec bins. Red curve is a Poisson curve with rate = median count rate of data. |
 |
 |
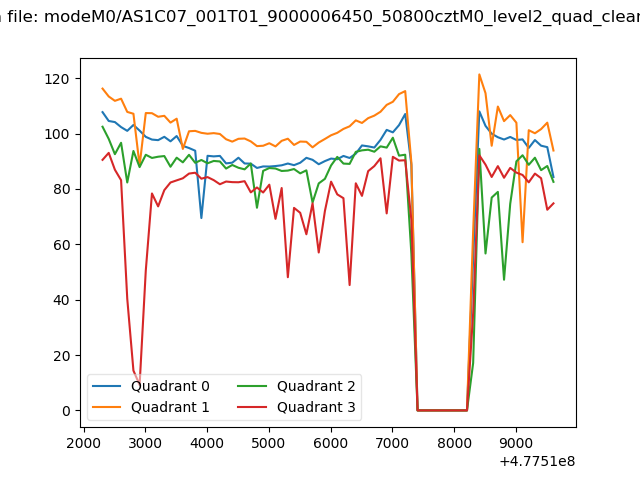
| Quadrant-wise count rates Data is divided into 100 sec bins |
 |
|
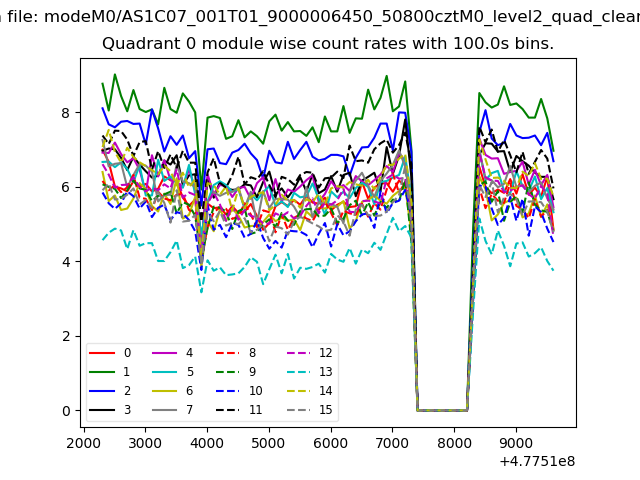
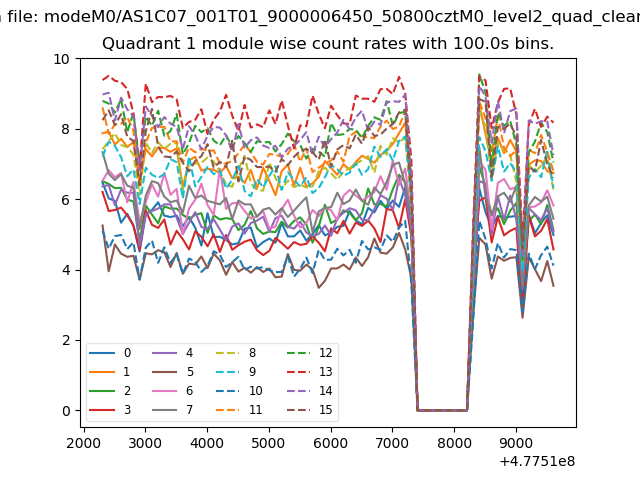
| Module-wise count rates for Quadrant A Data is divided into 100 sec bins |
 |
 |
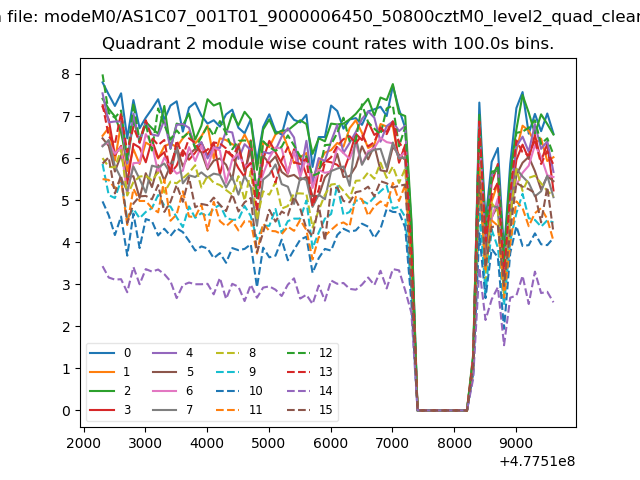
| Module-wise count rates for Quadrant B Data is divided into 100 sec bins |
 |
 |
| Module-wise count rates for Quadrant C Data is divided into 100 sec bins |
 |
 |
| Module-wise count rates for Quadrant D Data is divided into 100 sec bins |
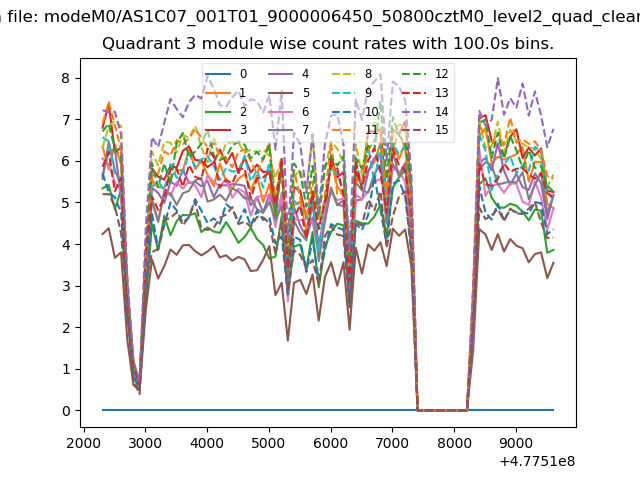 |
 |
| Parameter | Plot |
|---|---|
| CZT HV Monitor | 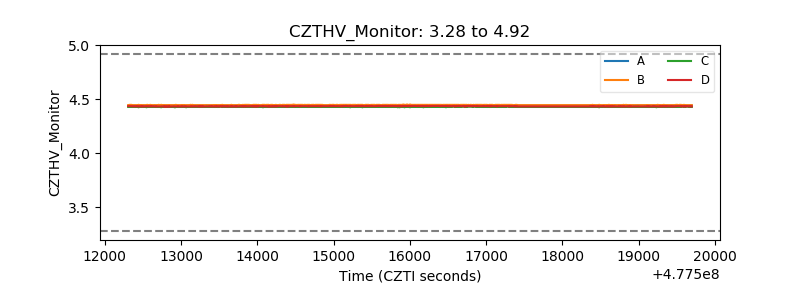 |
| D_VDD | 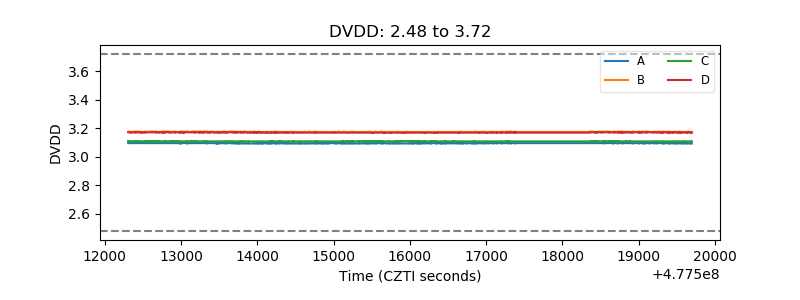 |
| Temperature 1 | 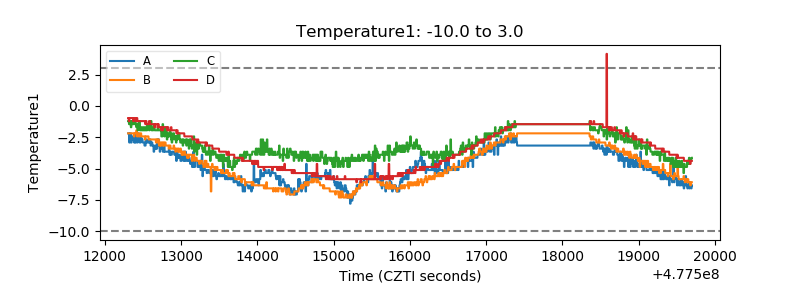 |
| Veto HV Monitor | 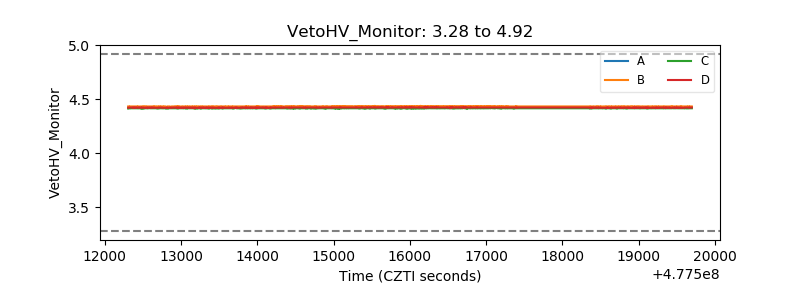 |
| Veto LLD | 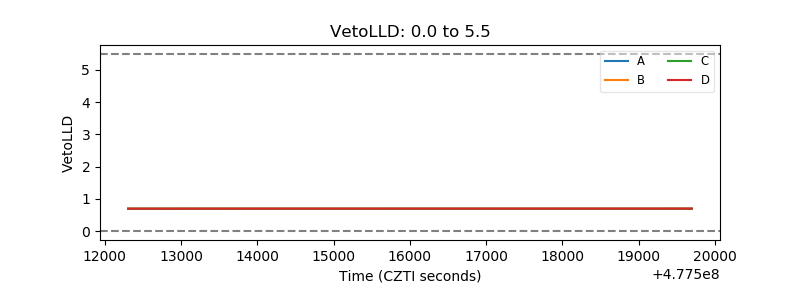 |
| Alpha Counter | 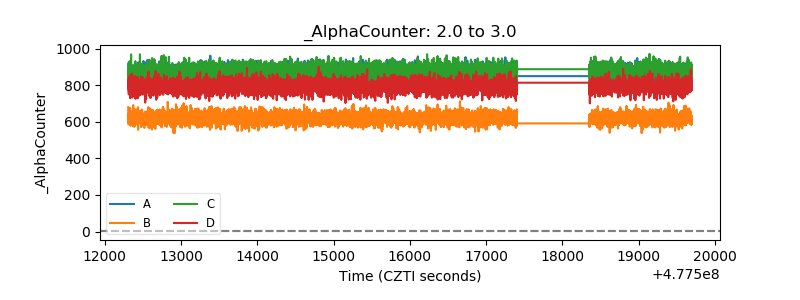 |
| _CPM_Rate | 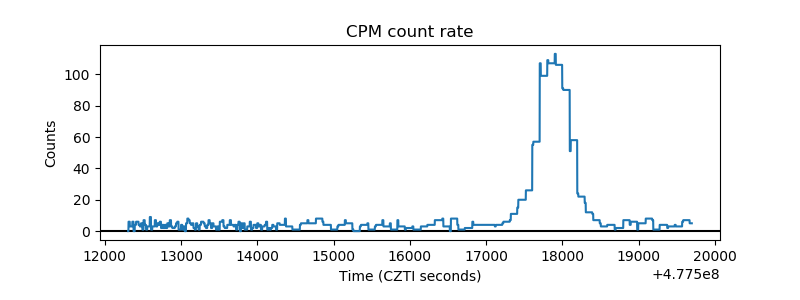 |
| CZT Counter | 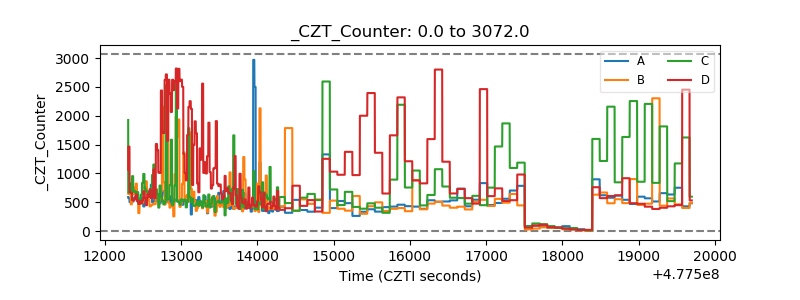 |
| +2.5 Volts monitor |  |
| +5 Volts monitor | 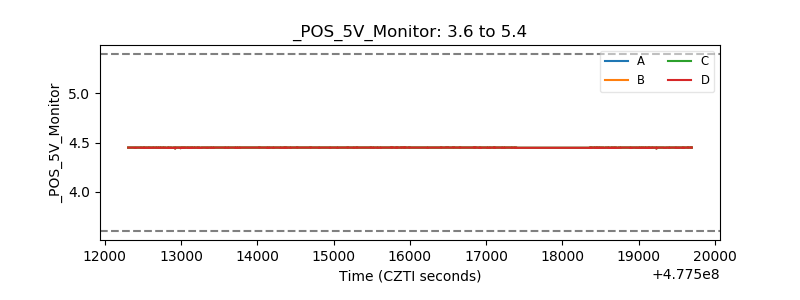 |
| _ROLL_ROT | 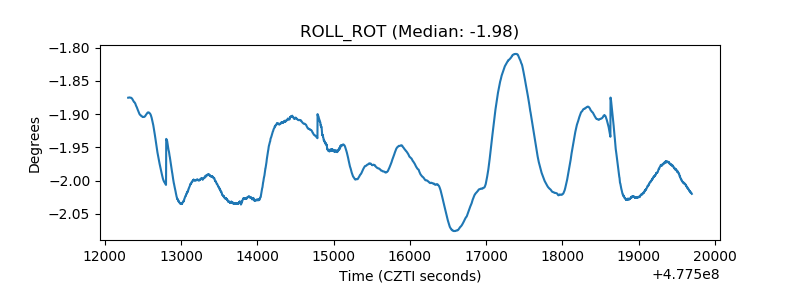 |
| _Roll_DEC | 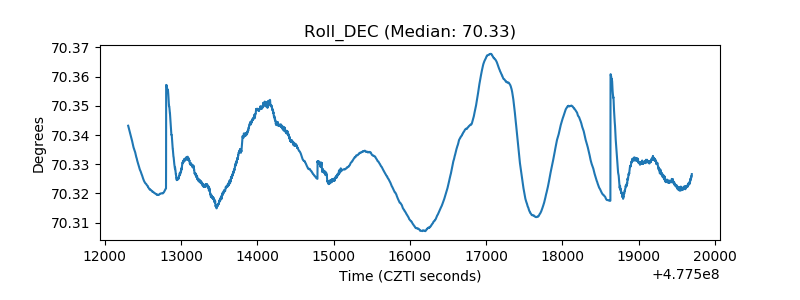 |
| _Roll_RA | 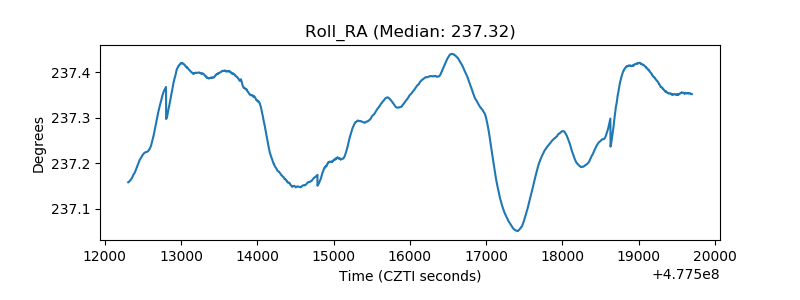 |
| Veto Counter | 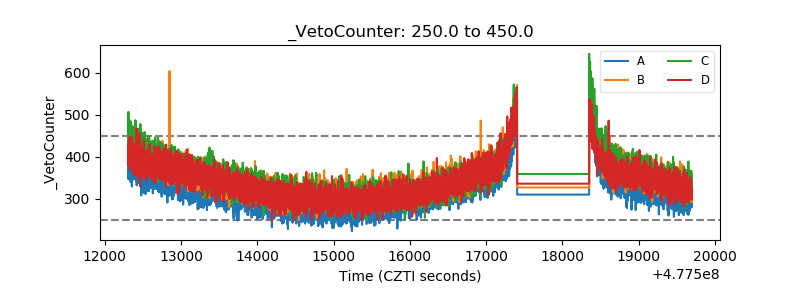 |