| Param | Original file | Final file |
|---|---|---|
| Filename | modeM0/AS1C07_001T01_9000006450_50802cztM0_level2.fits | modeM0/AS1C07_001T01_9000006450_50802cztM0_level2_quad_clean.evt |
| Size (bytes) | 651,323,520 | 108,077,760 |
| Size | 621.2 MB | 103.1 MB |
| Events in quadrant A | 5,210,445 | 692,985 |
| Events in quadrant B | 4,013,902 | 783,110 |
| Events in quadrant C | 7,477,514 | 642,760 |
| Events in quadrant D | 6,811,886 | 618,098 |
| Mode SS | |||
|---|---|---|---|
| Quadrant | BADHDUFLAG | Total packets | Discarded packets |
| A | 0 | 154 | 0 |
| B | 0 | 154 | 0 |
| C | 0 | 154 | 0 |
| D | 0 | 154 | 0 |
| Mode M0 | |||
|---|---|---|---|
| Quadrant | BADHDUFLAG | Total packets | Discarded packets |
| A | 0 | 20852 | 1 |
| B | 0 | 17466 | 1 |
| C | 0 | 27627 | 1 |
| D | 0 | 25603 | 1 |
| Quadrant | Total seconds | Saturated seconds | Saturation percentage |
|---|---|---|---|
| A | 7698 | 447 | 5.806703% |
| B | 7698 | 122 | 1.584827% |
| C | 7698 | 774 | 10.054560% |
| D | 7698 | 582 | 7.560405% |
Noise dominated data is calculated using 1-second bins in cleaned event files. If a bin has >2000 counts, and if more than 50% of those come from <1% of pixels, then it is considered to be noise-dominated and hence unusable.
| Quadrant | # 1 sec bins | Bins with >0 counts | Bins with >2000 counts | High rate bins dominated by noise | Noise dominated (total time) | Noise dominated (detector-on time) | Marked lightcurve |
|---|---|---|---|---|---|---|---|
| A | 7713 | 7699 | 405 | 405 | 5.25% | 5.26% | 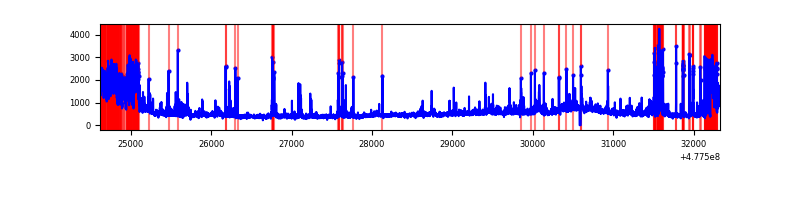 |
| B | 7713 | 7699 | 67 | 67 | 0.87% | 0.87% | 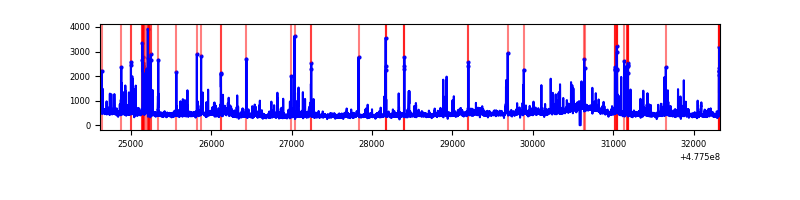 |
| C | 7713 | 7699 | 765 | 765 | 9.92% | 9.94% |  |
| D | 7713 | 7699 | 555 | 555 | 7.20% | 7.21% | 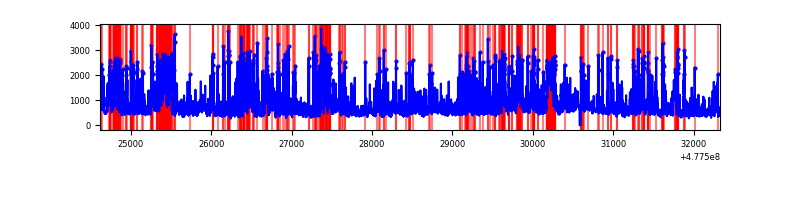 |
Top three noisy pixels from each quadrant. If the there are fewer than three noisy pixels in the level2.evt file, extra rows are filled as -1
| Pixel properties | Quadrant properties | ||||||
|---|---|---|---|---|---|---|---|
| Quadrant | DetID | PixID | Counts | Sigma | Mean | Median | Sigma |
| A | 14 | 254 | 685545 | 3450.69 | 803 | 784 | 198.4 |
| A | 4 | 249 | 560944 | 2822.79 | 803 | 784 | 198.4 |
| A | 4 | 3 | 239233 | 1201.61 | 803 | 784 | 198.4 |
| B | 8 | 128 | 196570 | 1129.3 | 817 | 787 | 173.4 |
| B | 4 | 206 | 99026 | 566.66 | 817 | 787 | 173.4 |
| B | 10 | 247 | 89798 | 513.43 | 817 | 787 | 173.4 |
| C | 5 | 10 | 2669320 | 12298.26 | 784 | 776 | 217.0 |
| C | 1 | 44 | 409732 | 1884.72 | 784 | 776 | 217.0 |
| C | 13 | 3 | 275601 | 1266.56 | 784 | 776 | 217.0 |
| D | 10 | 172 | 792319 | 3668.26 | 773 | 745 | 215.8 |
| D | 2 | 216 | 745201 | 3449.91 | 773 | 745 | 215.8 |
| D | 2 | 249 | 318036 | 1470.37 | 773 | 745 | 215.8 |
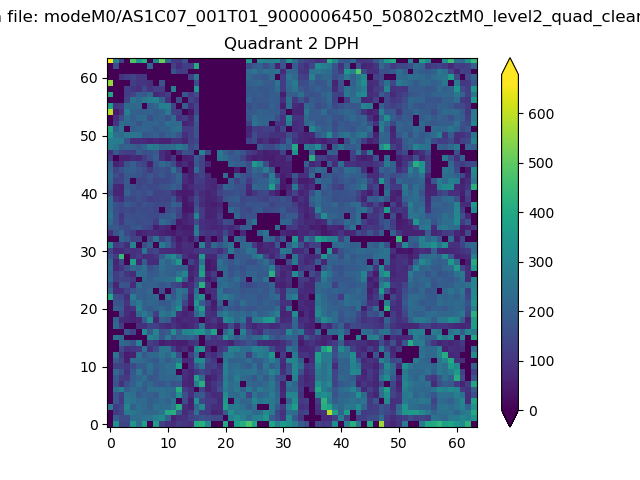
Histogram calculated using DETX and DETY for each event in the final _common_clean file
| Quadrant A | 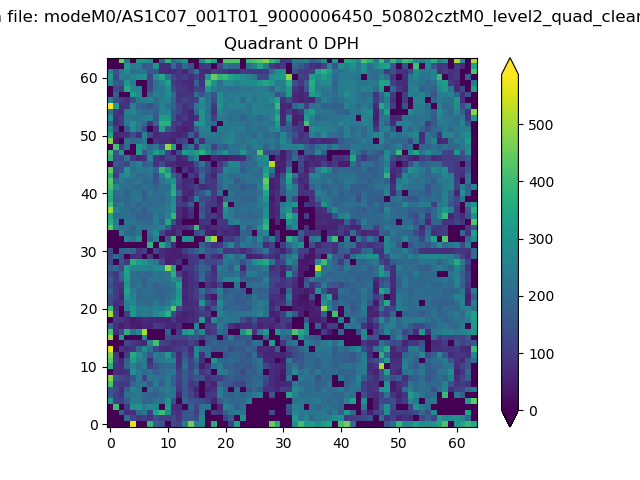 |
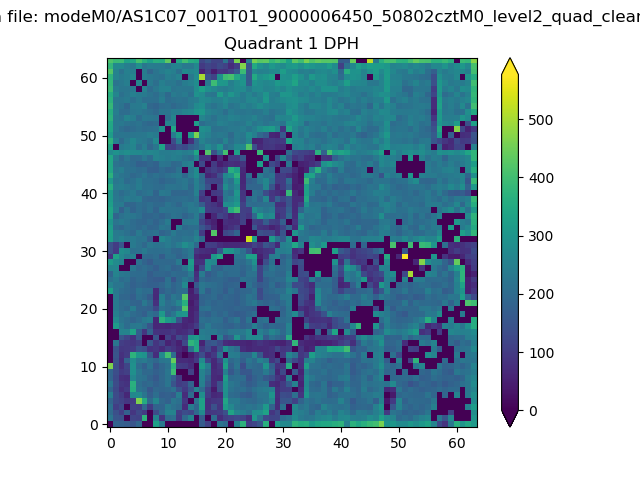 |
Quadrant B |
|---|---|---|---|
| Quadrant D | 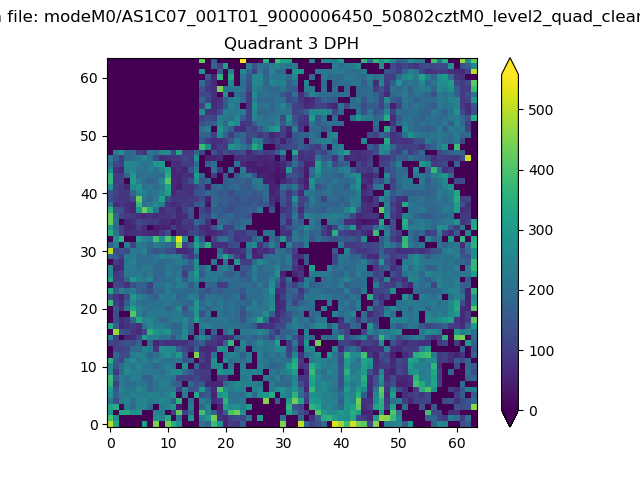 |
 |
Quadrant C |
| Plot type | Count rate plots | Images |
|---|---|---|
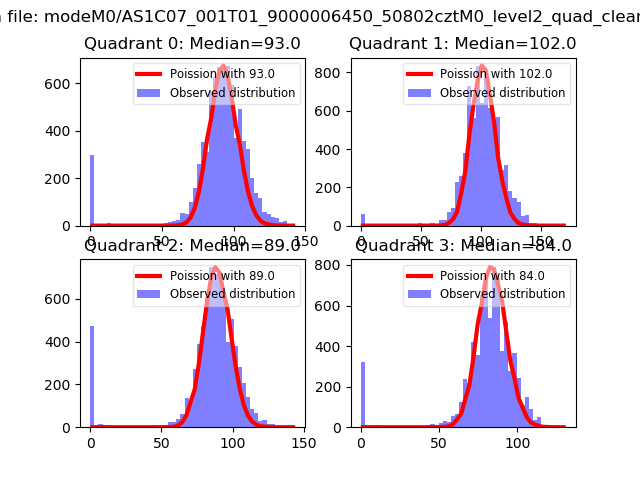
| Comparison with Poisson distribution Blue bars denote a histogram of data divided into 1 sec bins. Red curve is a Poisson curve with rate = median count rate of data. |
 |
 |
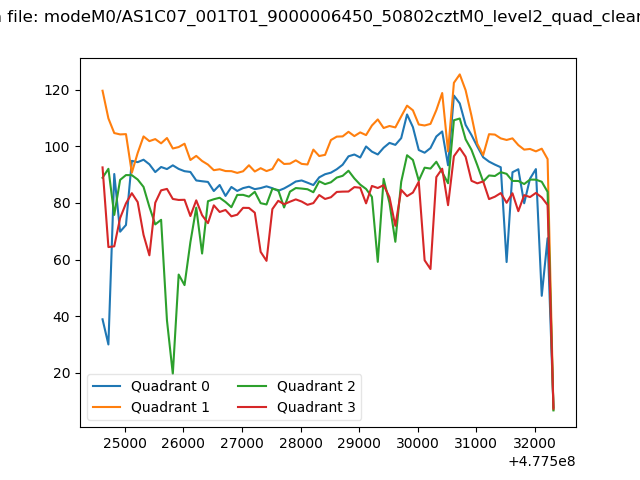
| Quadrant-wise count rates Data is divided into 100 sec bins |
 |
|
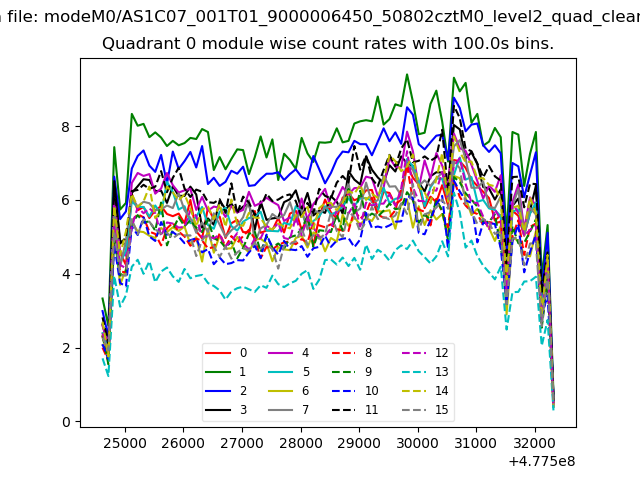
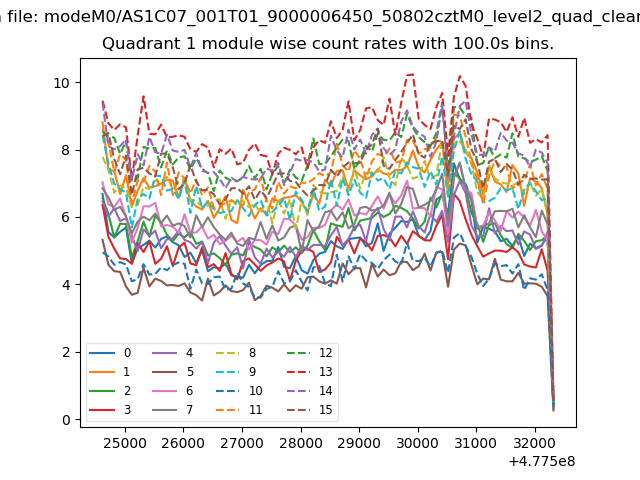
| Module-wise count rates for Quadrant A Data is divided into 100 sec bins |
 |
 |
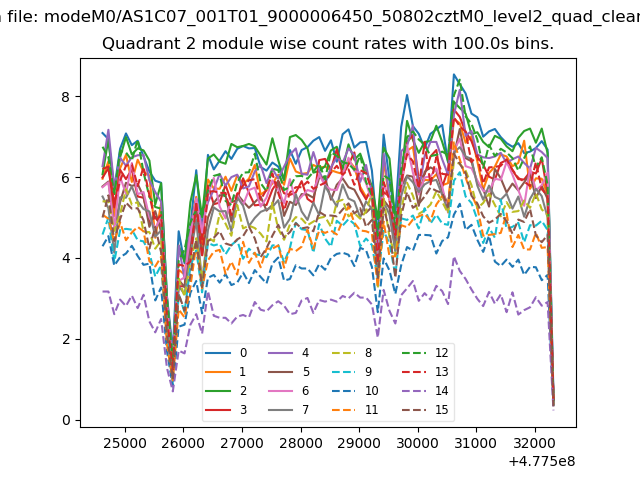
| Module-wise count rates for Quadrant B Data is divided into 100 sec bins |
 |
 |
| Module-wise count rates for Quadrant C Data is divided into 100 sec bins |
 |
 |
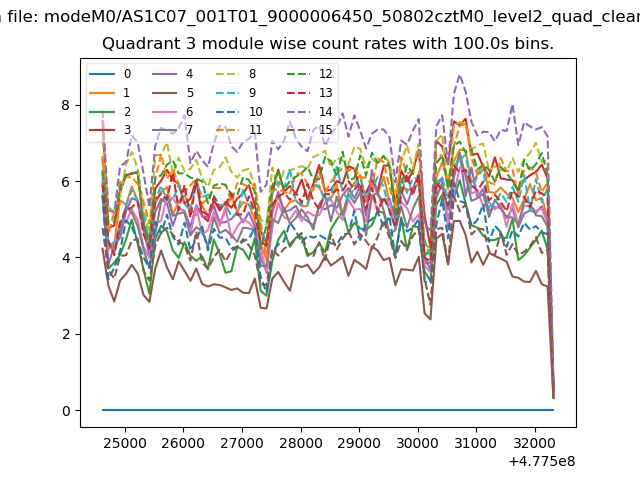
| Module-wise count rates for Quadrant D Data is divided into 100 sec bins |
 |
 |
| Parameter | Plot |
|---|---|
| CZT HV Monitor | 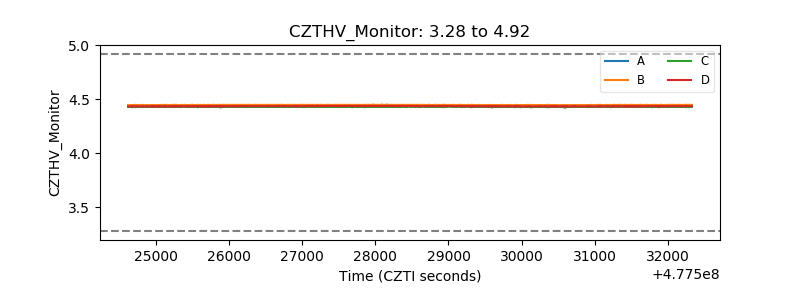 |
| D_VDD | 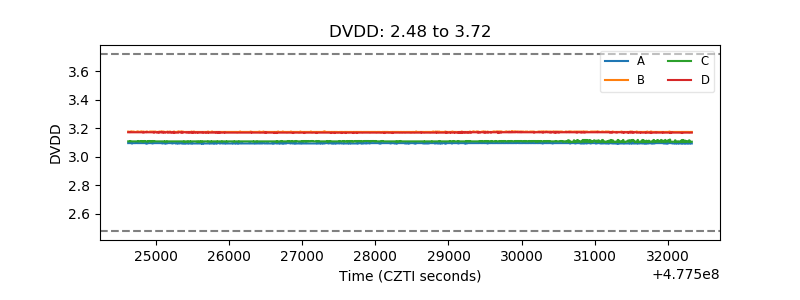 |
| Temperature 1 | 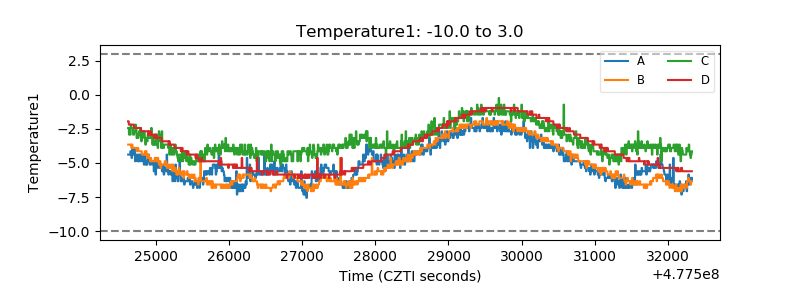 |
| Veto HV Monitor | 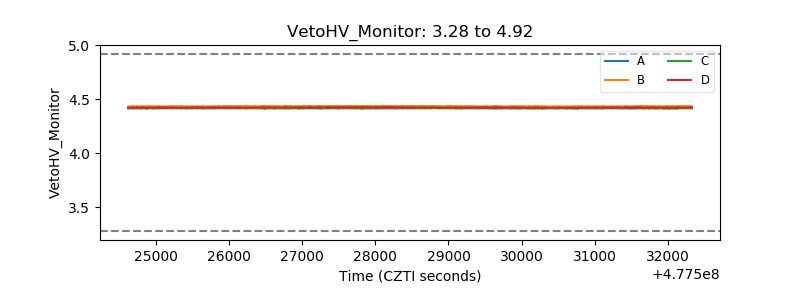 |
| Veto LLD | 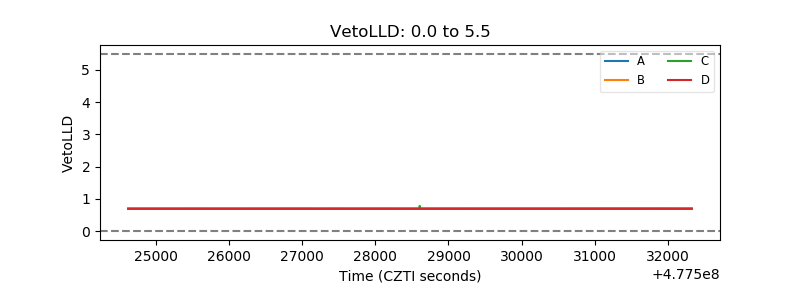 |
| Alpha Counter | 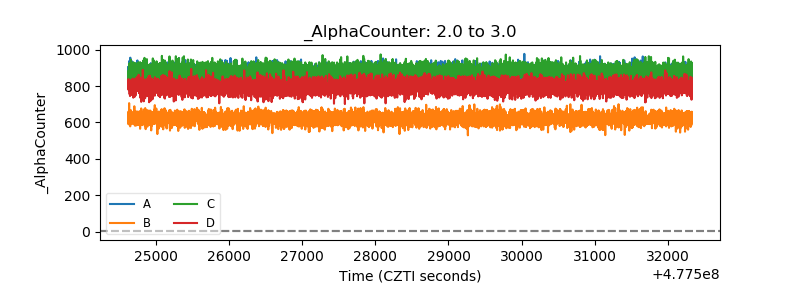 |
| _CPM_Rate | 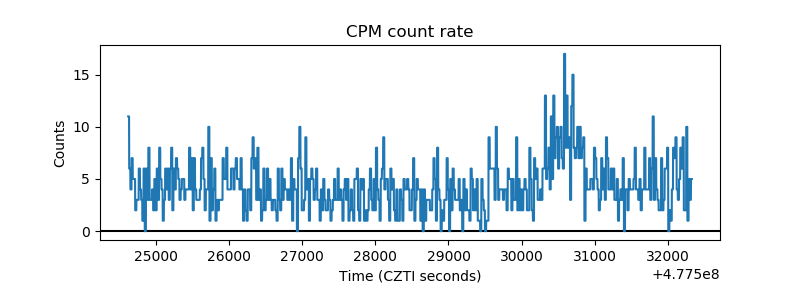 |
| CZT Counter | 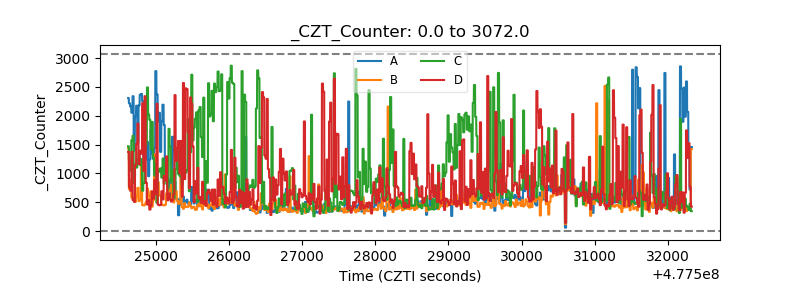 |
| +2.5 Volts monitor | 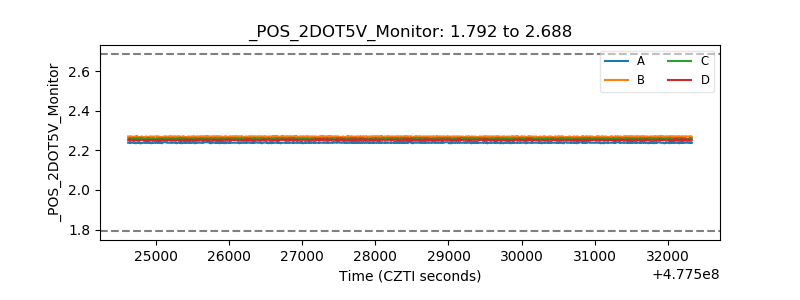 |
| +5 Volts monitor |  |
| _ROLL_ROT | 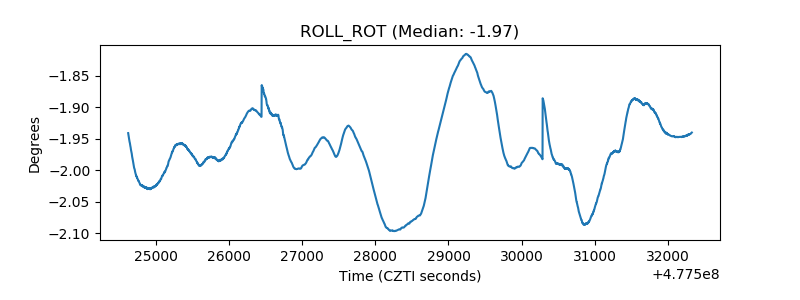 |
| _Roll_DEC | 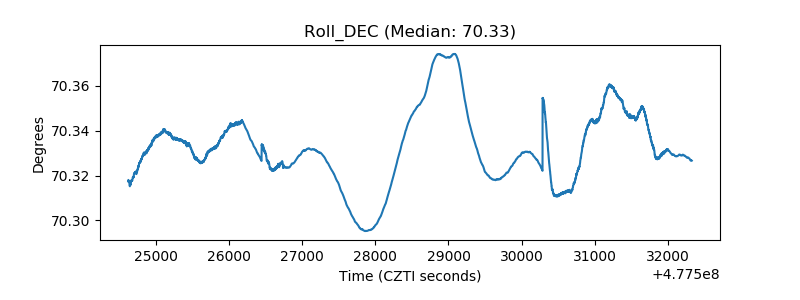 |
| _Roll_RA | 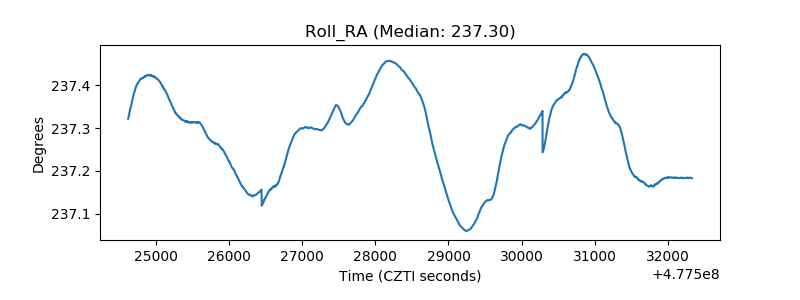 |
| Veto Counter | 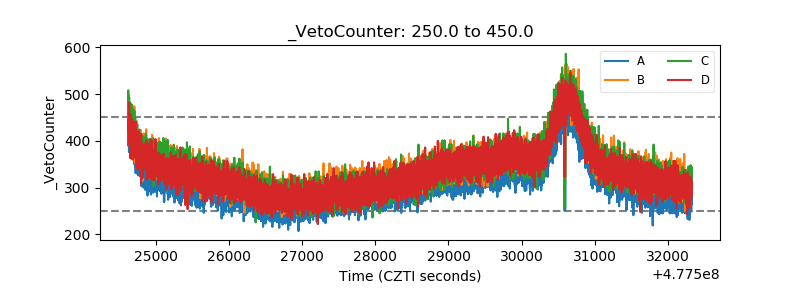 |