| Param | Original file | Final file |
|---|---|---|
| Filename | modeM0/AS1C07_001T01_9000006450_50803cztM0_level2.fits | modeM0/AS1C07_001T01_9000006450_50803cztM0_level2_quad_clean.evt |
| Size (bytes) | 646,384,320 | 118,128,960 |
| Size | 616.4 MB | 112.7 MB |
| Events in quadrant A | 5,462,225 | 770,952 |
| Events in quadrant B | 4,249,116 | 847,911 |
| Events in quadrant C | 7,028,443 | 698,540 |
| Events in quadrant D | 6,539,958 | 679,223 |
| Mode SS | |||
|---|---|---|---|
| Quadrant | BADHDUFLAG | Total packets | Discarded packets |
| A | 0 | 166 | 0 |
| B | 0 | 166 | 0 |
| C | 0 | 166 | 0 |
| D | 0 | 166 | 0 |
| Mode M0 | |||
|---|---|---|---|
| Quadrant | BADHDUFLAG | Total packets | Discarded packets |
| A | 0 | 22133 | 1 |
| B | 0 | 18916 | 1 |
| C | 0 | 26759 | 1 |
| D | 0 | 25240 | 2 |
| Quadrant | Total seconds | Saturated seconds | Saturation percentage |
|---|---|---|---|
| A | 8354 | 273 | 3.267896% |
| B | 8354 | 154 | 1.843428% |
| C | 8354 | 782 | 9.360785% |
| D | 8354 | 424 | 5.075413% |
Noise dominated data is calculated using 1-second bins in cleaned event files. If a bin has >2000 counts, and if more than 50% of those come from <1% of pixels, then it is considered to be noise-dominated and hence unusable.
| Quadrant | # 1 sec bins | Bins with >0 counts | Bins with >2000 counts | High rate bins dominated by noise | Noise dominated (total time) | Noise dominated (detector-on time) | Marked lightcurve |
|---|---|---|---|---|---|---|---|
| A | 8369 | 8355 | 248 | 248 | 2.96% | 2.97% | 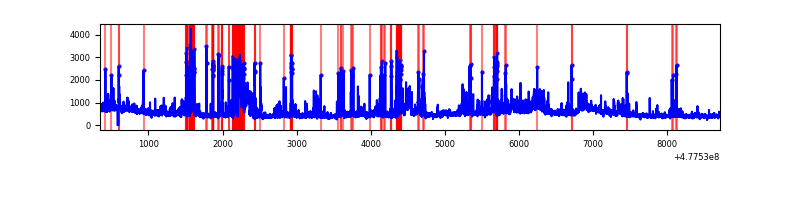 |
| B | 8369 | 8355 | 81 | 81 | 0.97% | 0.97% | 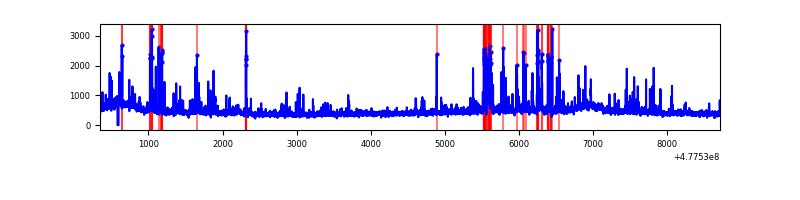 |
| C | 8369 | 8355 | 529 | 529 | 6.32% | 6.33% | 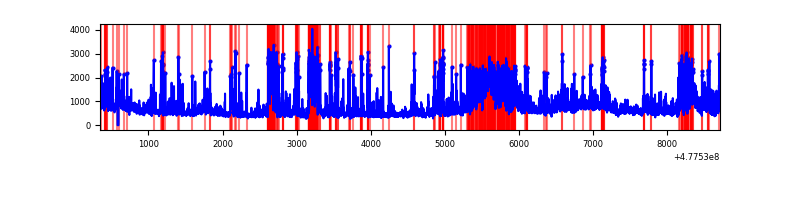 |
| D | 8369 | 8355 | 417 | 417 | 4.98% | 4.99% | 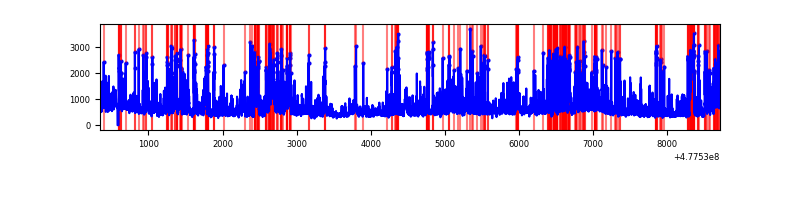 |
Top three noisy pixels from each quadrant. If the there are fewer than three noisy pixels in the level2.evt file, extra rows are filled as -1
| Pixel properties | Quadrant properties | ||||||
|---|---|---|---|---|---|---|---|
| Quadrant | DetID | PixID | Counts | Sigma | Mean | Median | Sigma |
| A | 4 | 249 | 879259 | 3966.75 | 892 | 869 | 221.4 |
| A | 8 | 247 | 196522 | 883.56 | 892 | 869 | 221.4 |
| A | 4 | 3 | 193775 | 871.15 | 892 | 869 | 221.4 |
| B | 8 | 128 | 180857 | 940.76 | 898 | 868 | 191.3 |
| B | 5 | 185 | 107419 | 556.92 | 898 | 868 | 191.3 |
| B | 10 | 43 | 92655 | 479.75 | 898 | 868 | 191.3 |
| C | 5 | 10 | 971978 | 4120.47 | 854 | 844 | 235.7 |
| C | 4 | 210 | 620368 | 2628.61 | 854 | 844 | 235.7 |
| C | 1 | 3 | 409508 | 1733.94 | 854 | 844 | 235.7 |
| D | 15 | 108 | 467616 | 1960.41 | 856 | 825 | 238.1 |
| D | 2 | 216 | 414015 | 1735.3 | 856 | 825 | 238.1 |
| D | 2 | 249 | 372427 | 1560.64 | 856 | 825 | 238.1 |
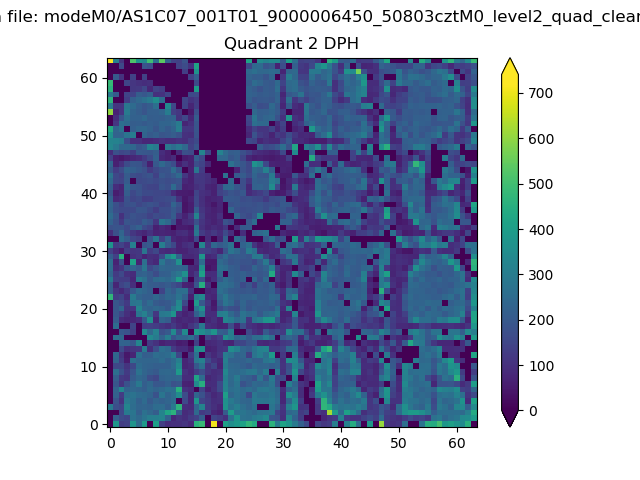
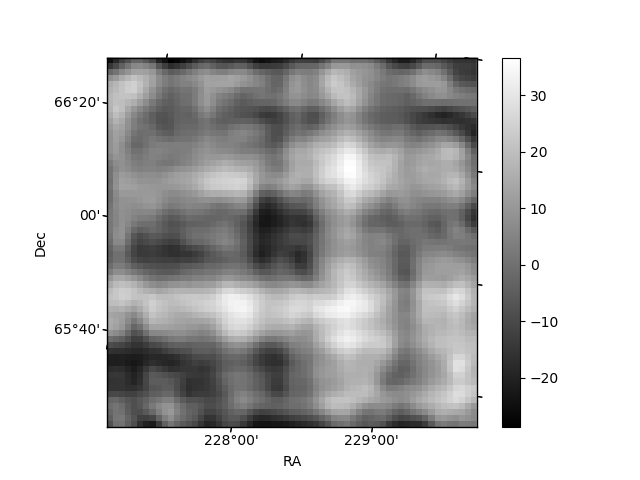
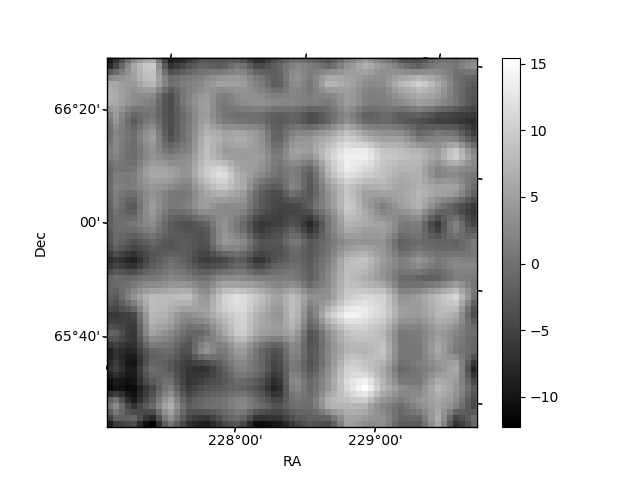
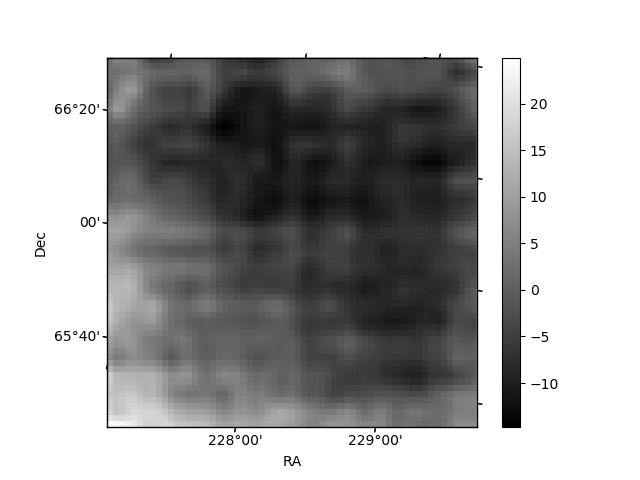
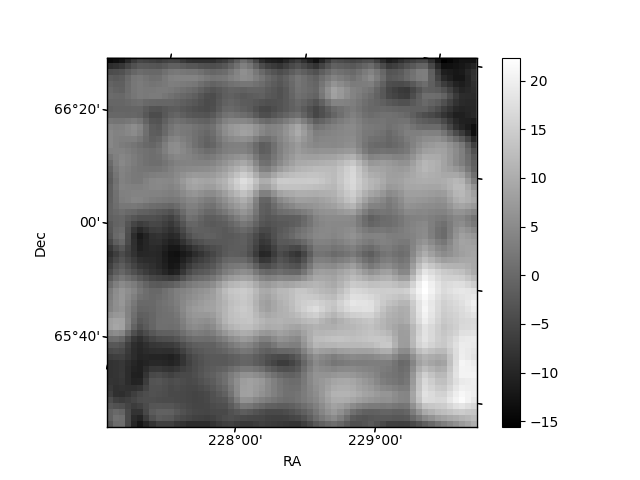
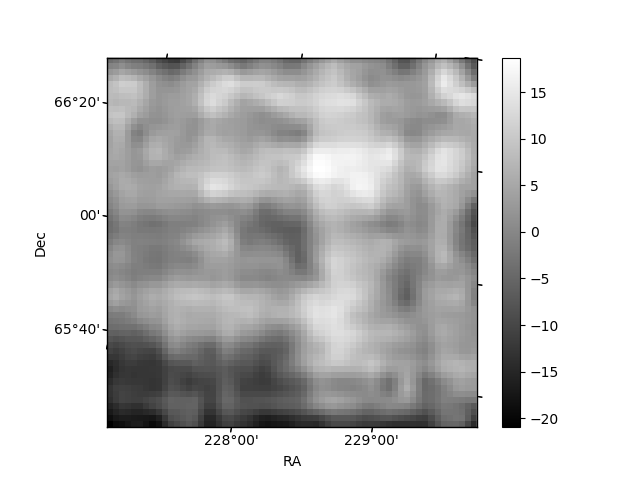
Histogram calculated using DETX and DETY for each event in the final _common_clean file
| Quadrant A | 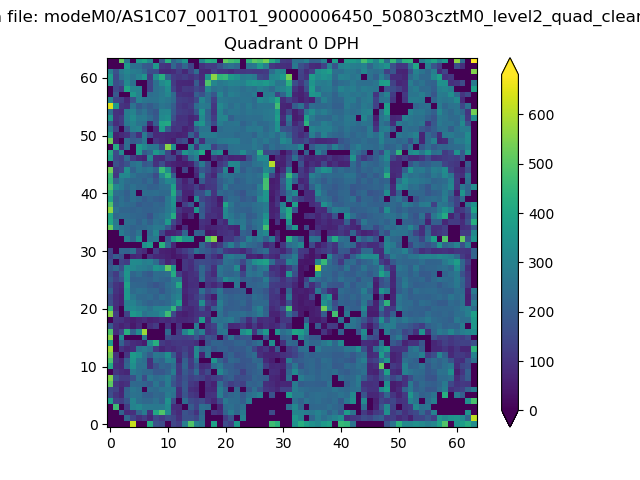 |
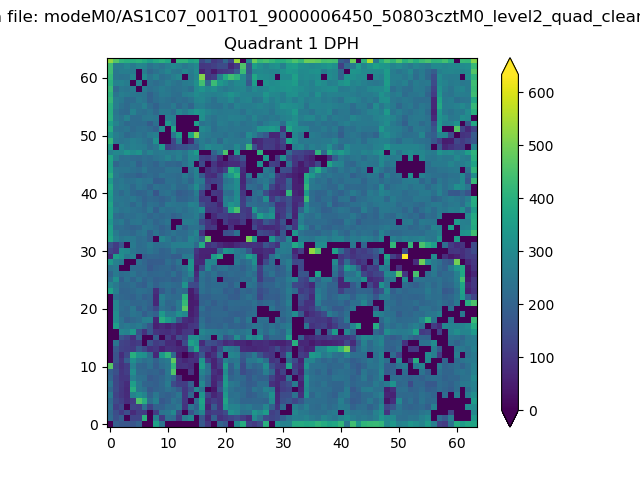 |
Quadrant B |
|---|---|---|---|
| Quadrant D | 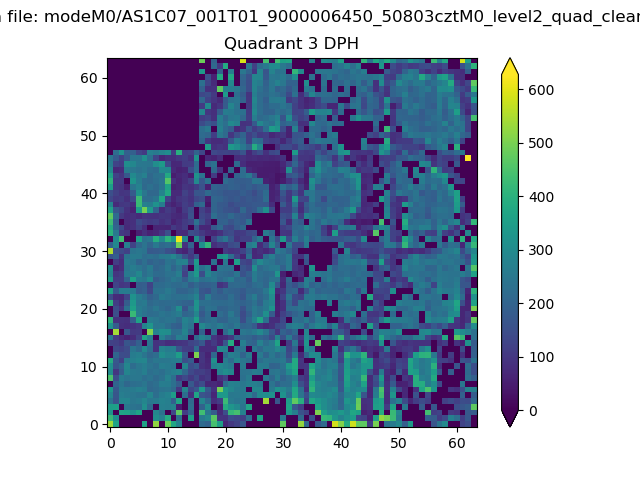 |
 |
Quadrant C |
| Plot type | Count rate plots | Images |
|---|---|---|
| Comparison with Poisson distribution Blue bars denote a histogram of data divided into 1 sec bins. Red curve is a Poisson curve with rate = median count rate of data. |
 |
 |
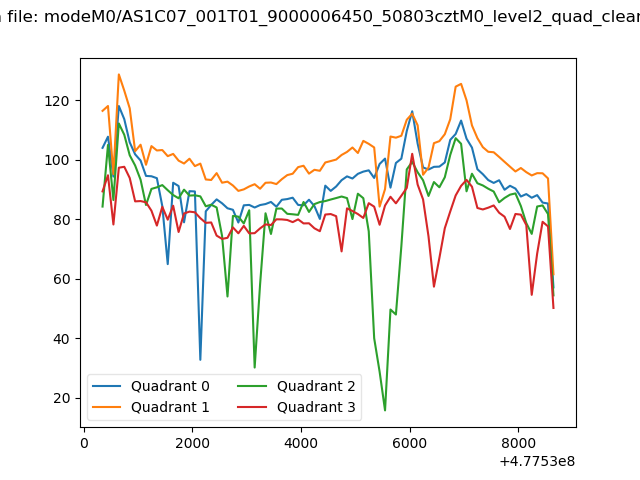
| Quadrant-wise count rates Data is divided into 100 sec bins |
 |
|
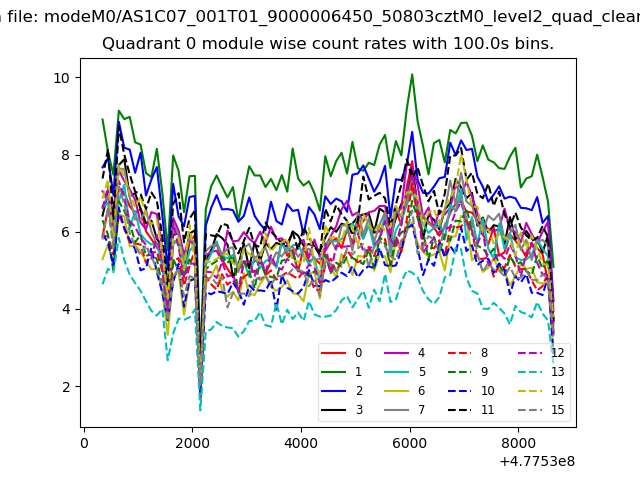
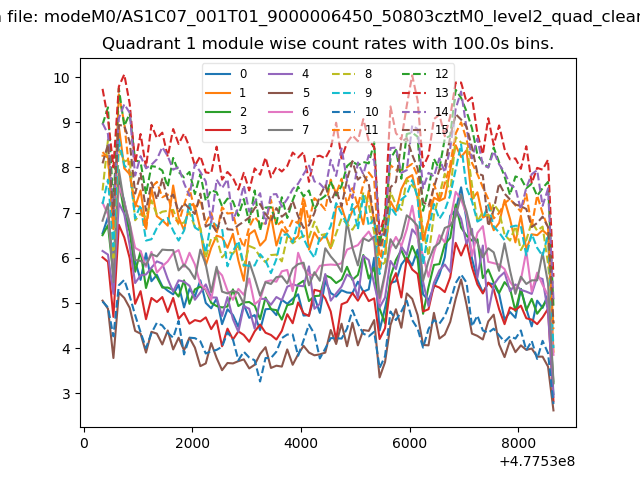
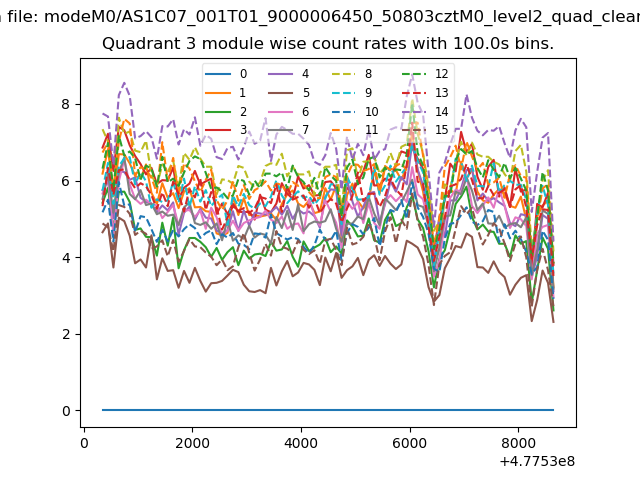
| Module-wise count rates for Quadrant A Data is divided into 100 sec bins |
 |
 |
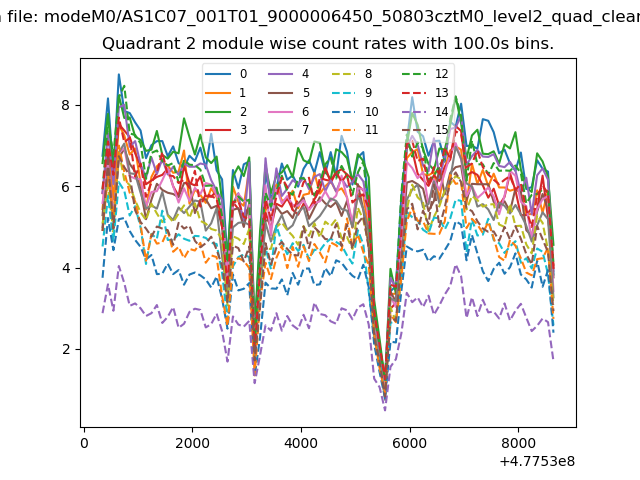
| Module-wise count rates for Quadrant B Data is divided into 100 sec bins |
 |
 |
| Module-wise count rates for Quadrant C Data is divided into 100 sec bins |
 |
 |
| Module-wise count rates for Quadrant D Data is divided into 100 sec bins |
 |
 |
| Parameter | Plot |
|---|---|
| CZT HV Monitor | 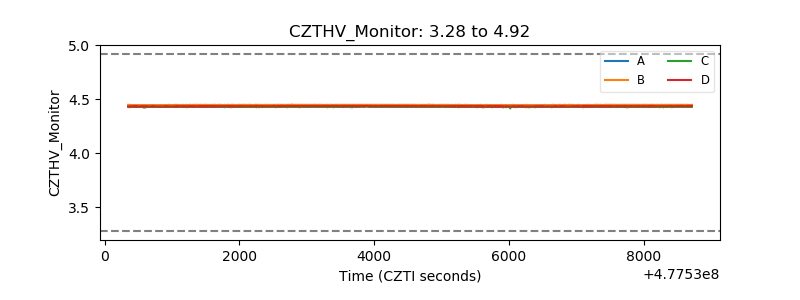 |
| D_VDD | 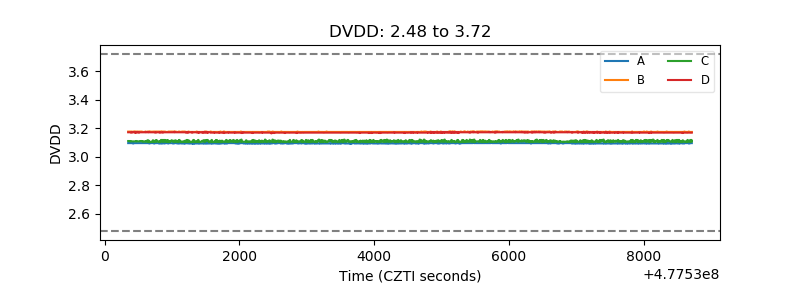 |
| Temperature 1 | 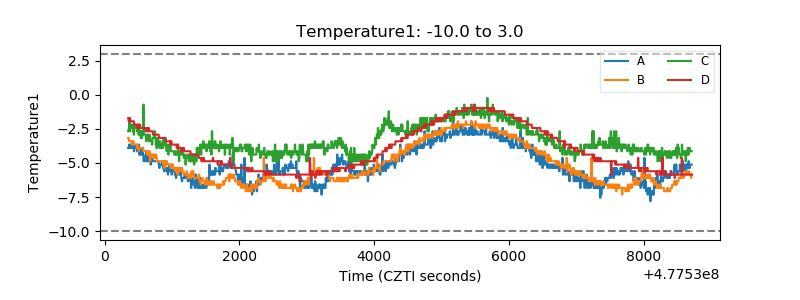 |
| Veto HV Monitor | 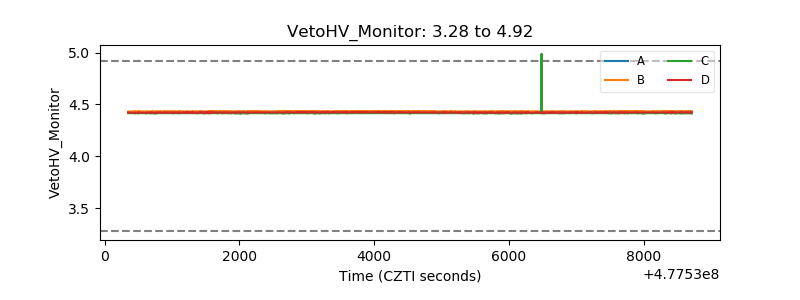 |
| Veto LLD | 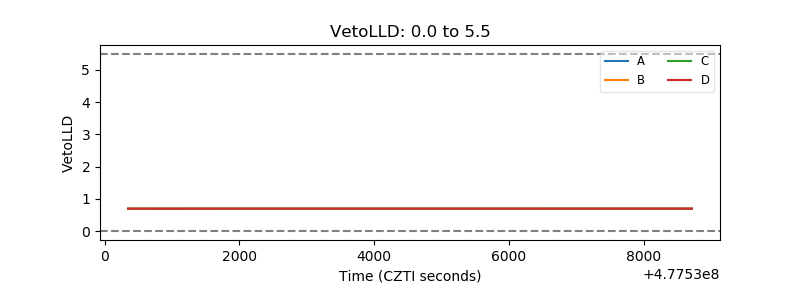 |
| Alpha Counter | 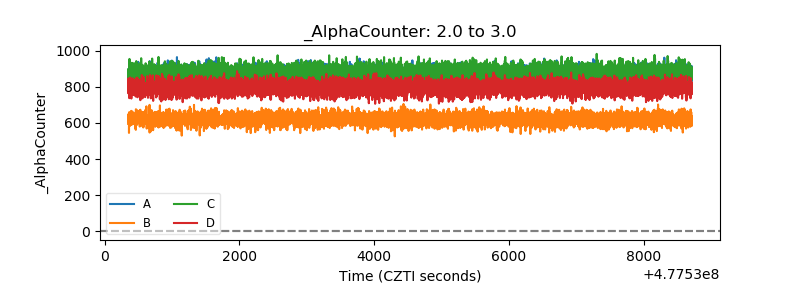 |
| _CPM_Rate | 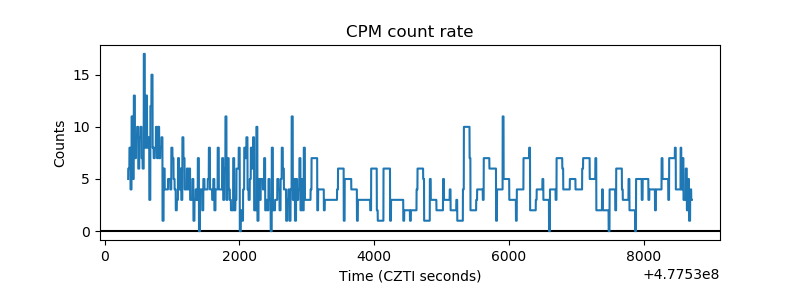 |
| CZT Counter | 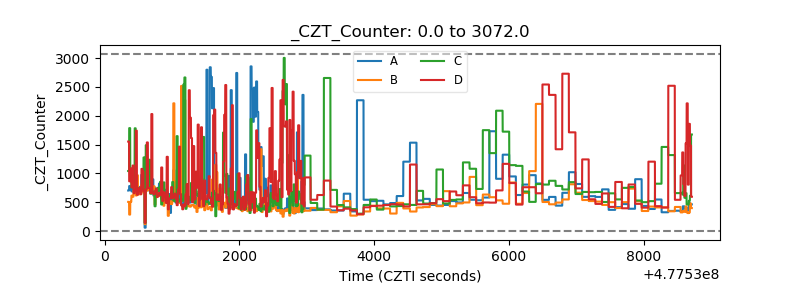 |
| +2.5 Volts monitor | 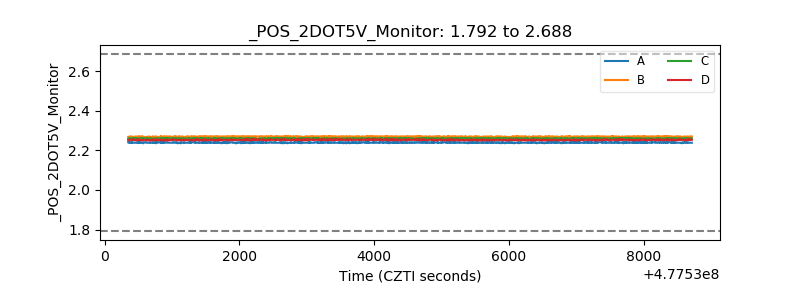 |
| +5 Volts monitor | 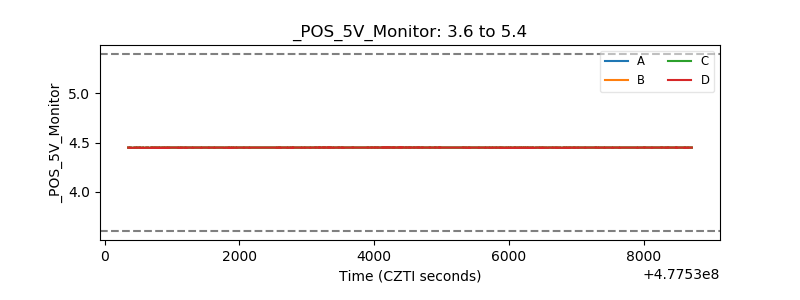 |
| _ROLL_ROT | 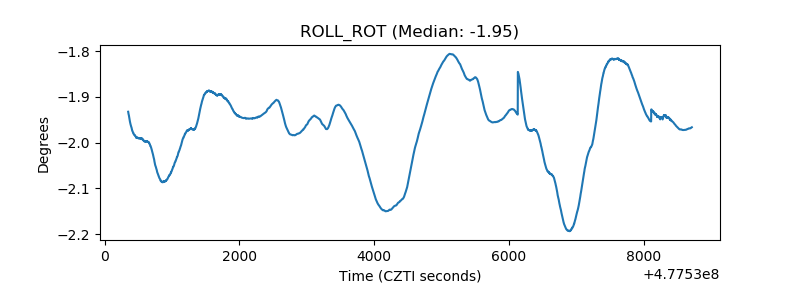 |
| _Roll_DEC | 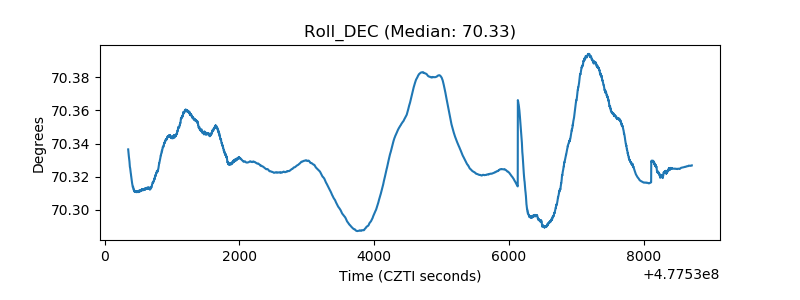 |
| _Roll_RA | 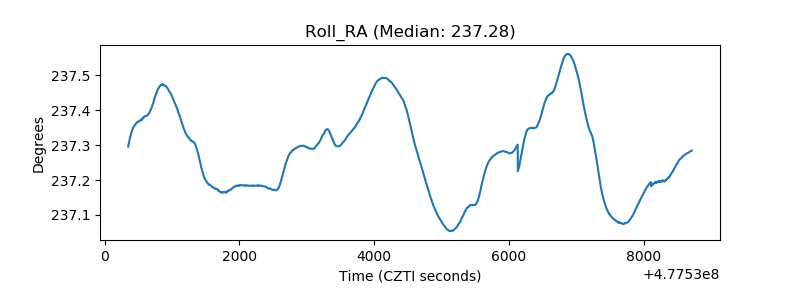 |
| Veto Counter | 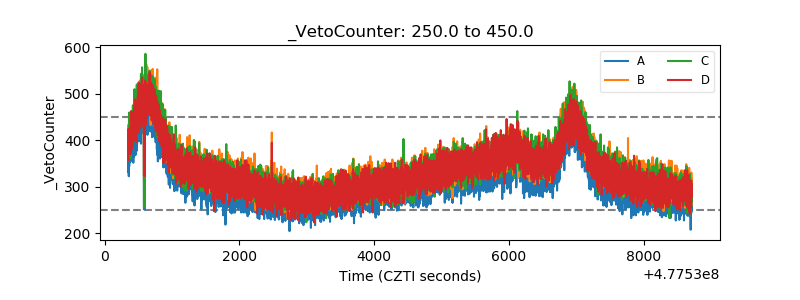 |