| Param | Original file | Final file |
|---|---|---|
| Filename | modeM0/AS1C07_001T01_9000006450_50804cztM0_level2.fits | modeM0/AS1C07_001T01_9000006450_50804cztM0_level2_quad_clean.evt |
| Size (bytes) | 832,527,360 | 117,002,880 |
| Size | 794.0 MB | 111.6 MB |
| Events in quadrant A | 4,627,432 | 814,921 |
| Events in quadrant B | 4,473,040 | 889,669 |
| Events in quadrant C | 10,649,648 | 600,477 |
| Events in quadrant D | 10,391,614 | 630,879 |
| Mode SS | |||
|---|---|---|---|
| Quadrant | BADHDUFLAG | Total packets | Discarded packets |
| A | 0 | 176 | 0 |
| B | 0 | 176 | 0 |
| C | 0 | 176 | 0 |
| D | 0 | 176 | 0 |
| Mode M0 | |||
|---|---|---|---|
| Quadrant | BADHDUFLAG | Total packets | Discarded packets |
| A | 0 | 19851 | 0 |
| B | 0 | 19719 | 0 |
| C | 0 | 37778 | 1 |
| D | 0 | 37008 | 0 |
| Quadrant | Total seconds | Saturated seconds | Saturation percentage |
|---|---|---|---|
| A | 8731 | 59 | 0.675753% |
| B | 8732 | 110 | 1.259734% |
| C | 8731 | 2261 | 25.896232% |
| D | 8731 | 1541 | 17.649754% |
Noise dominated data is calculated using 1-second bins in cleaned event files. If a bin has >2000 counts, and if more than 50% of those come from <1% of pixels, then it is considered to be noise-dominated and hence unusable.
| Quadrant | # 1 sec bins | Bins with >0 counts | Bins with >2000 counts | High rate bins dominated by noise | Noise dominated (total time) | Noise dominated (detector-on time) | Marked lightcurve |
|---|---|---|---|---|---|---|---|
| A | 8731 | 8731 | 35 | 35 | 0.40% | 0.40% | 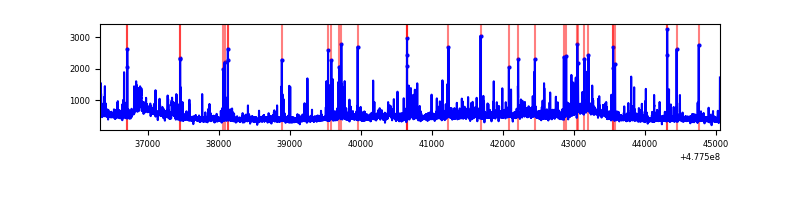 |
| B | 8732 | 8732 | 42 | 42 | 0.48% | 0.48% | 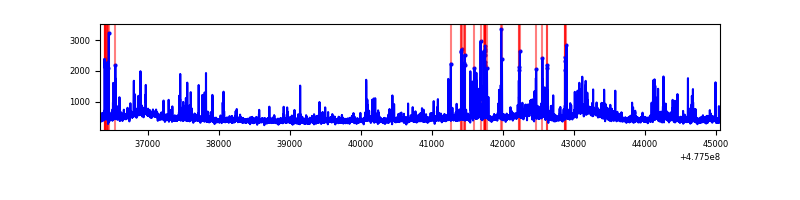 |
| C | 8731 | 8731 | 1477 | 1477 | 16.92% | 16.92% | 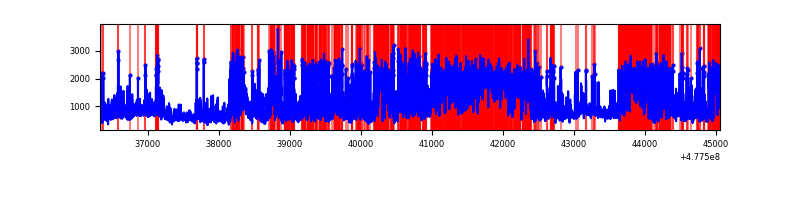 |
| D | 8731 | 8731 | 1515 | 1515 | 17.35% | 17.35% | 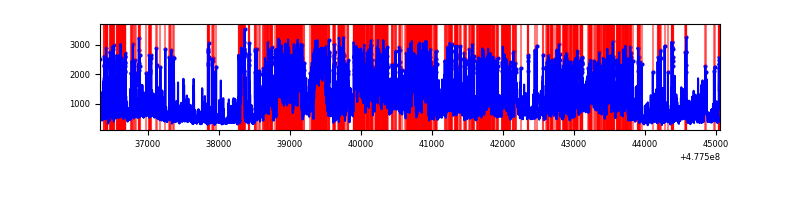 |
Top three noisy pixels from each quadrant. If the there are fewer than three noisy pixels in the level2.evt file, extra rows are filled as -1
| Pixel properties | Quadrant properties | ||||||
|---|---|---|---|---|---|---|---|
| Quadrant | DetID | PixID | Counts | Sigma | Mean | Median | Sigma |
| A | 4 | 3 | 237383 | 1027.03 | 935 | 912 | 230.2 |
| A | 4 | 13 | 91355 | 392.81 | 935 | 912 | 230.2 |
| A | 5 | 240 | 87559 | 376.32 | 935 | 912 | 230.2 |
| B | 8 | 128 | 284761 | 1403.48 | 939 | 906 | 202.3 |
| B | 4 | 206 | 173187 | 851.82 | 939 | 906 | 202.3 |
| B | 10 | 247 | 87659 | 428.94 | 939 | 906 | 202.3 |
| C | 4 | 210 | 3329445 | 14664.67 | 819 | 813 | 227.0 |
| C | 5 | 10 | 1883254 | 8293.31 | 819 | 813 | 227.0 |
| C | 12 | 247 | 518100 | 2278.97 | 819 | 813 | 227.0 |
| D | 8 | 48 | 2731712 | 11480.44 | 853 | 822 | 237.9 |
| D | 2 | 216 | 833955 | 3502.42 | 853 | 822 | 237.9 |
| D | 7 | 126 | 390150 | 1636.7 | 853 | 822 | 237.9 |
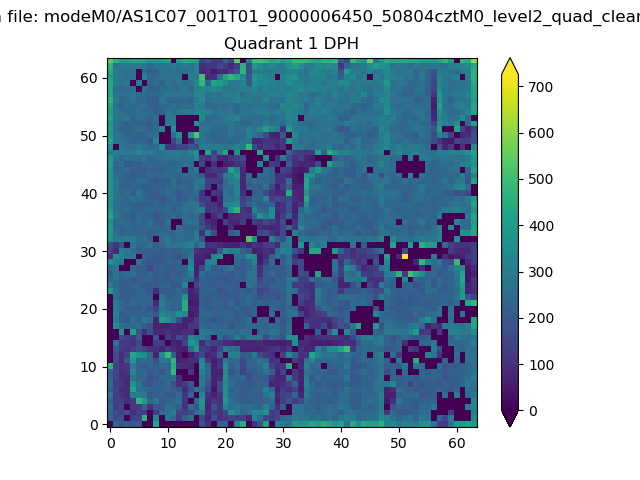
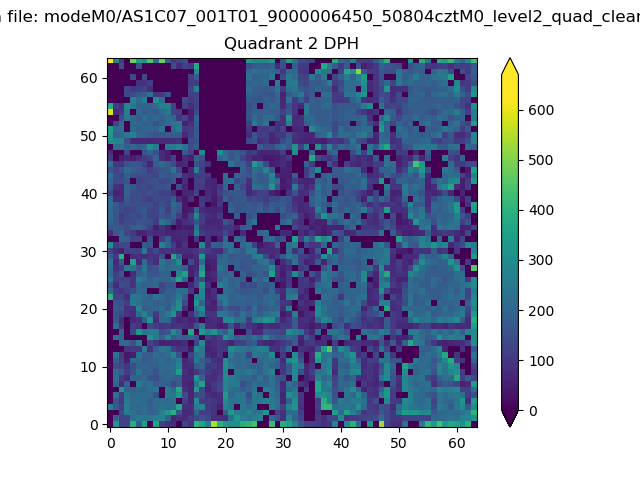
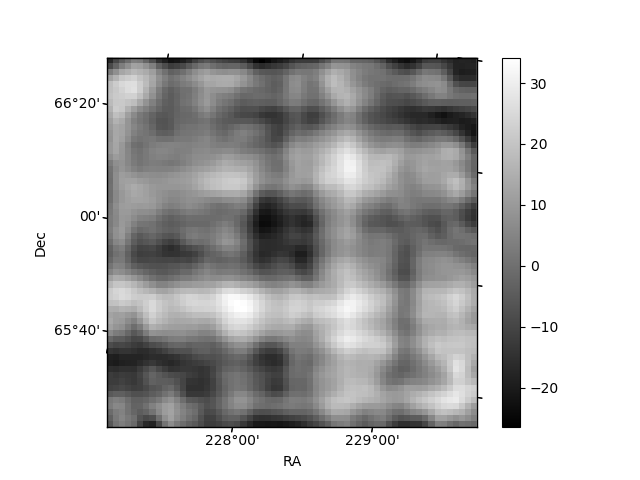
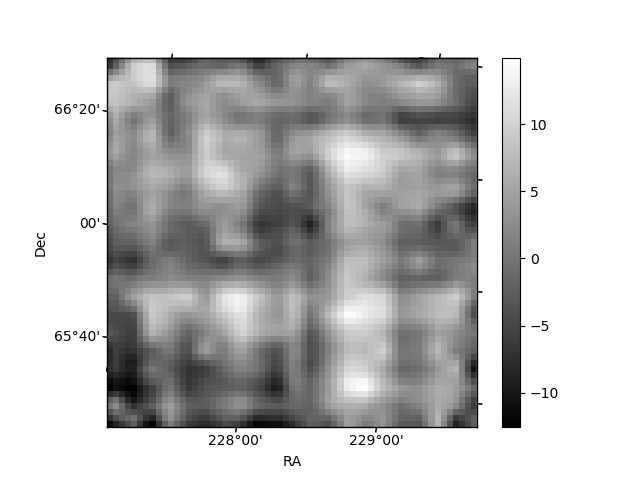
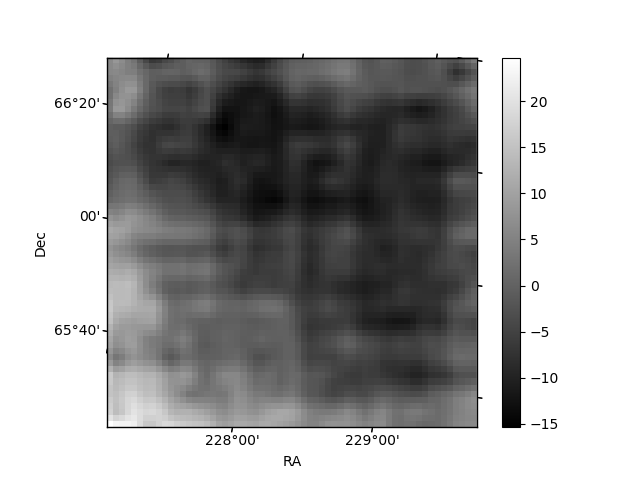
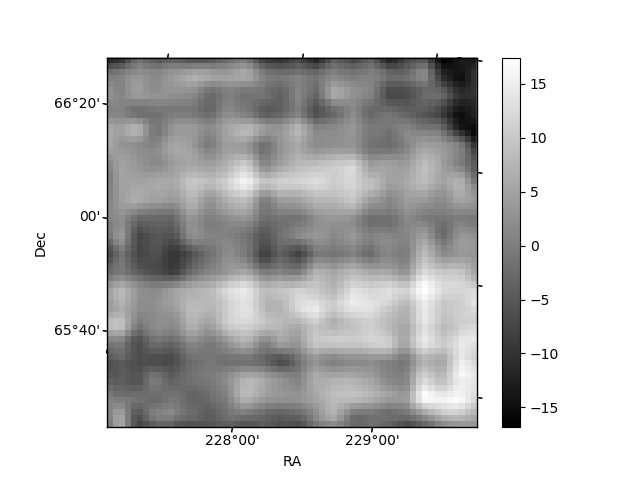
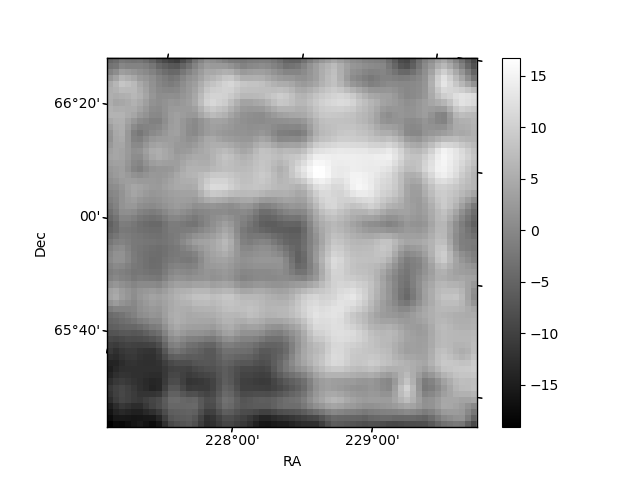
Histogram calculated using DETX and DETY for each event in the final _common_clean file
| Quadrant A |  |
 |
Quadrant B |
|---|---|---|---|
| Quadrant D | 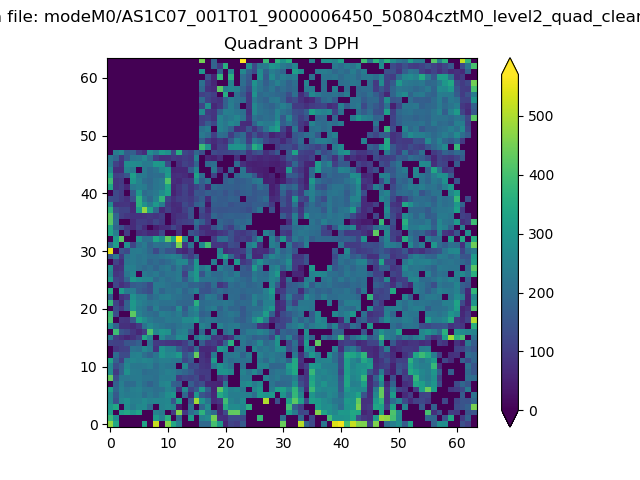 |
 |
Quadrant C |
| Plot type | Count rate plots | Images |
|---|---|---|
| Comparison with Poisson distribution Blue bars denote a histogram of data divided into 1 sec bins. Red curve is a Poisson curve with rate = median count rate of data. |
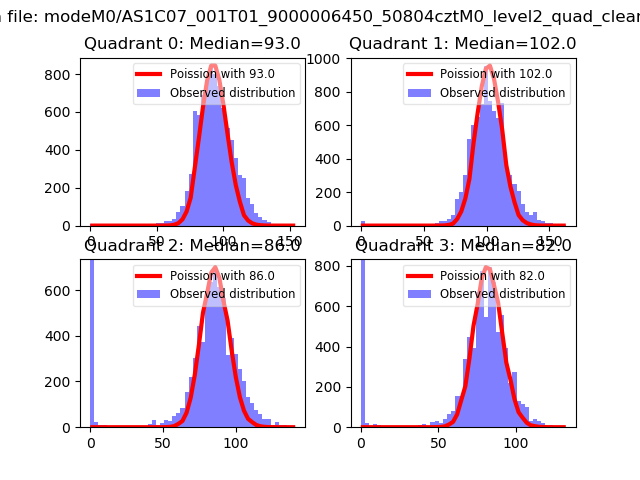 |
 |
| Quadrant-wise count rates Data is divided into 100 sec bins |
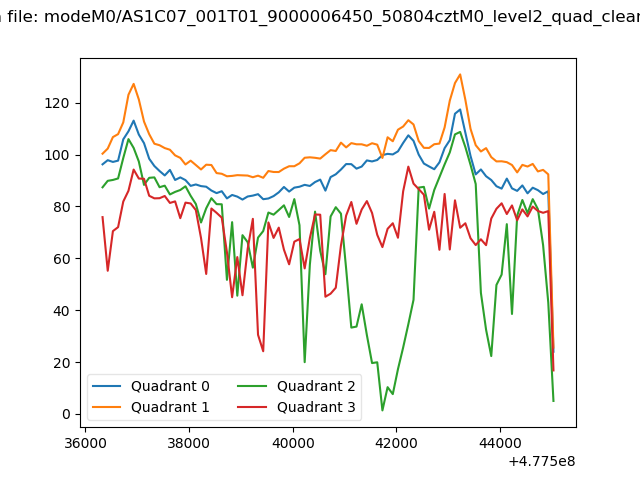 |
|
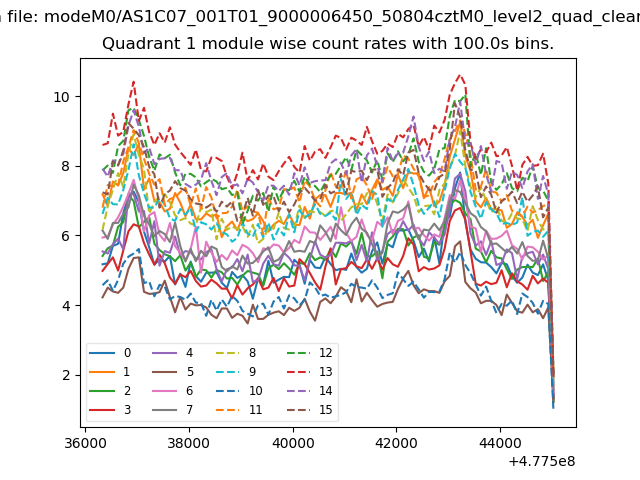
| Module-wise count rates for Quadrant A Data is divided into 100 sec bins |
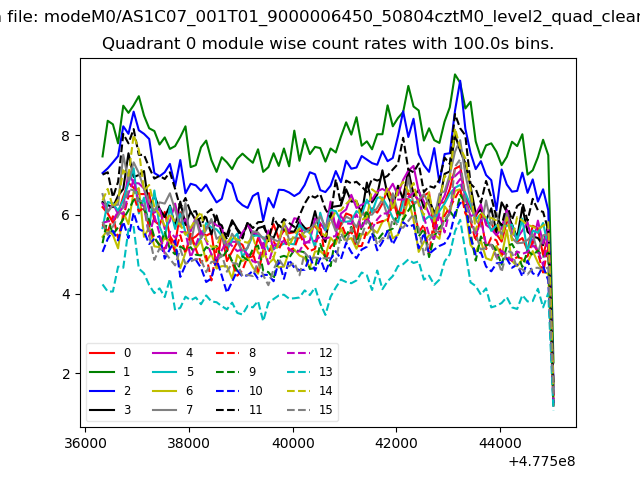 |
 |
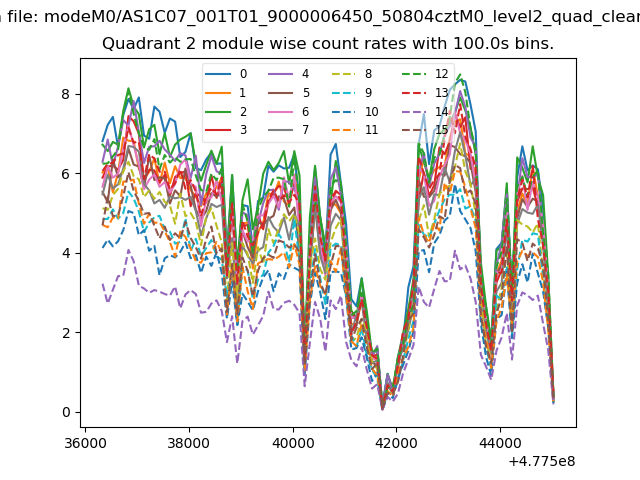
| Module-wise count rates for Quadrant B Data is divided into 100 sec bins |
 |
 |
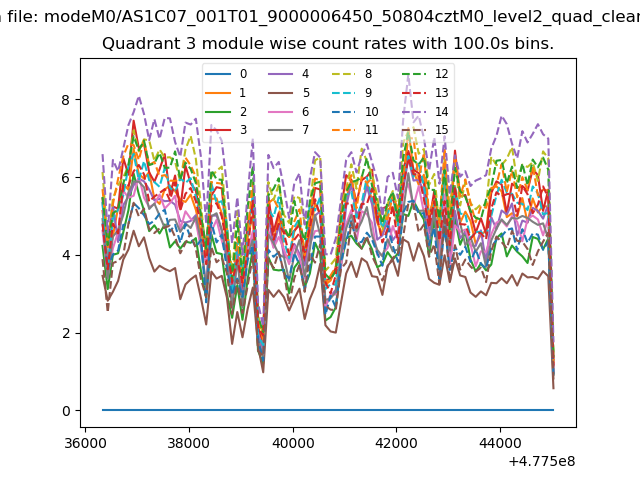
| Module-wise count rates for Quadrant C Data is divided into 100 sec bins |
 |
 |
| Module-wise count rates for Quadrant D Data is divided into 100 sec bins |
 |
 |
| Parameter | Plot |
|---|---|
| CZT HV Monitor | 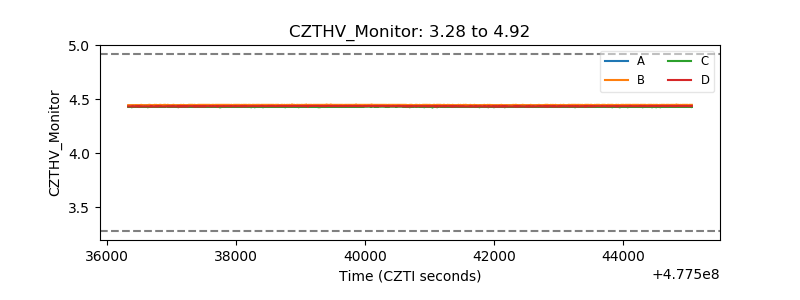 |
| D_VDD | 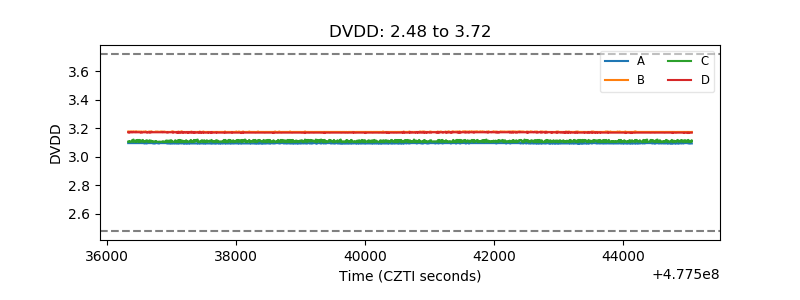 |
| Temperature 1 | 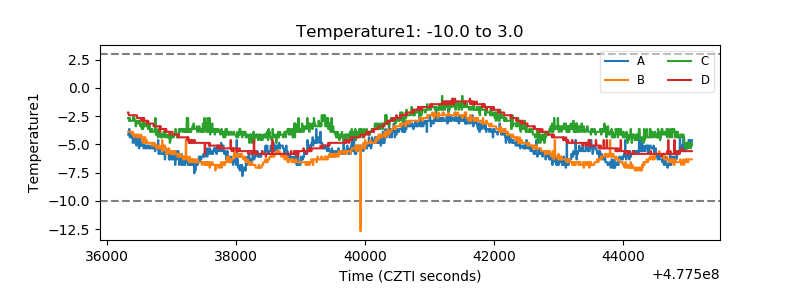 |
| Veto HV Monitor | 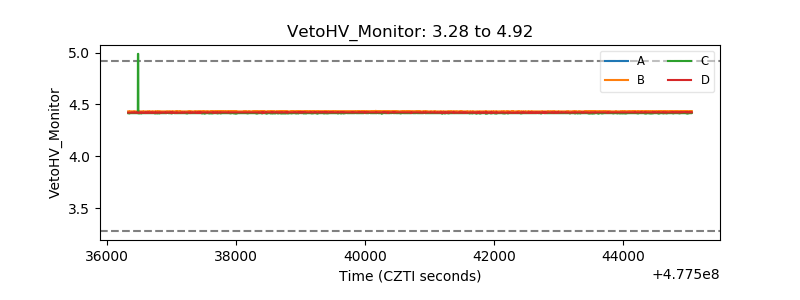 |
| Veto LLD | 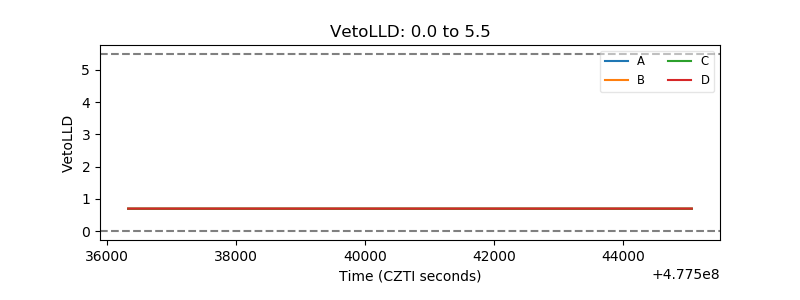 |
| Alpha Counter | 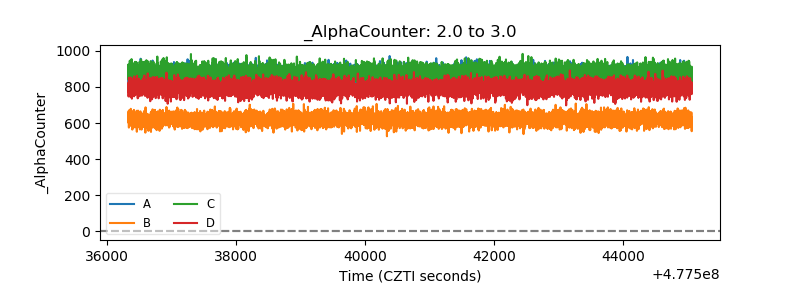 |
| _CPM_Rate | 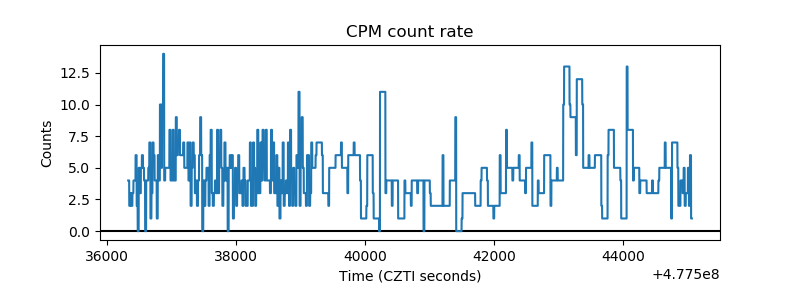 |
| CZT Counter | 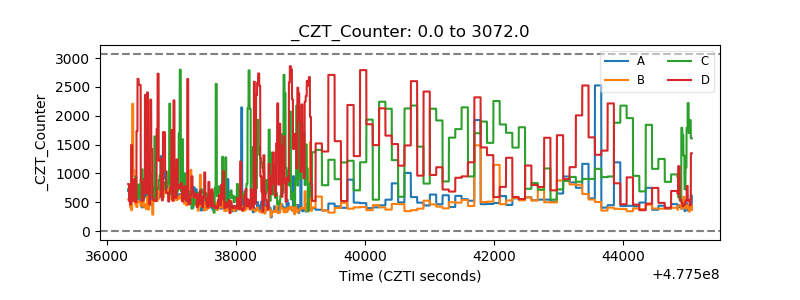 |
| +2.5 Volts monitor | 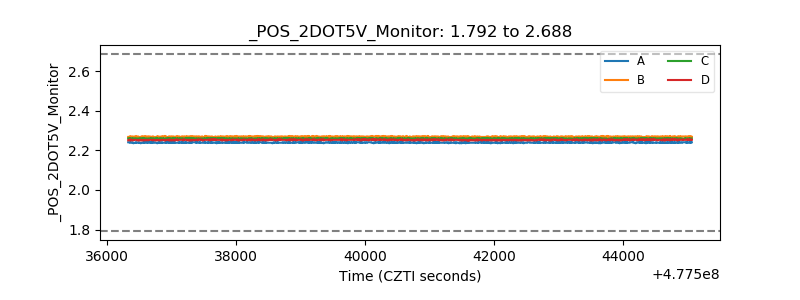 |
| +5 Volts monitor | 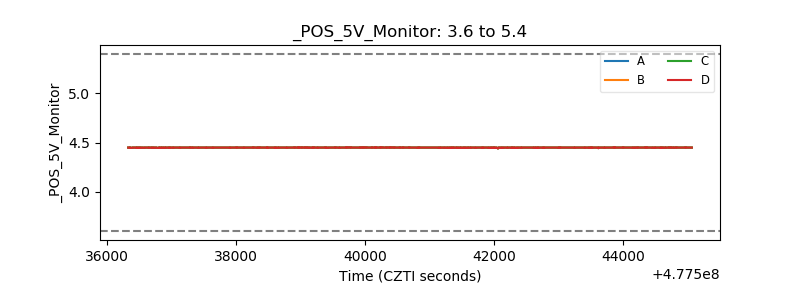 |
| _ROLL_ROT | 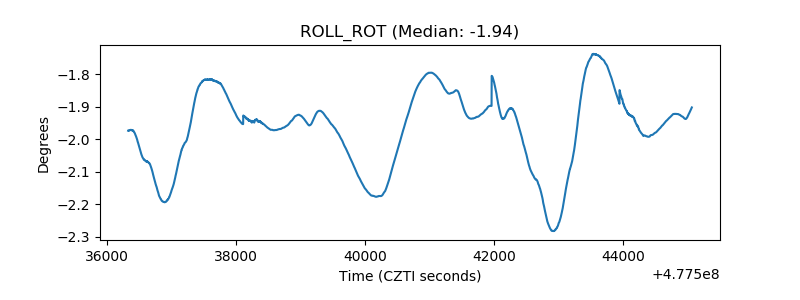 |
| _Roll_DEC | 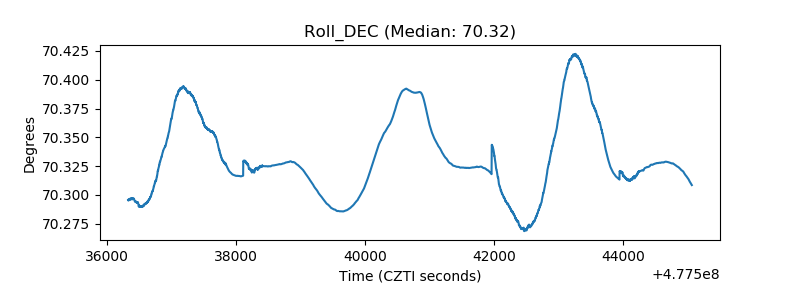 |
| _Roll_RA | 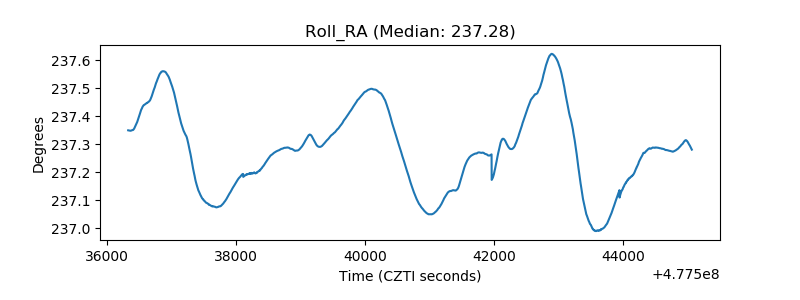 |
| Veto Counter | 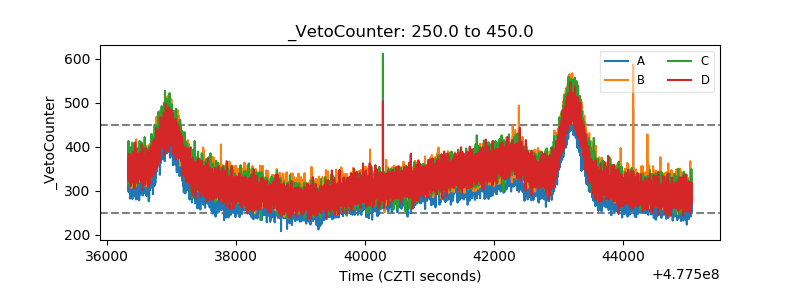 |