| Param | Original file | Final file |
|---|---|---|
| Filename | modeM0/AS1C07_001T01_9000006450_50807cztM0_level2.fits | modeM0/AS1C07_001T01_9000006450_50807cztM0_level2_quad_clean.evt |
| Size (bytes) | 1,597,055,040 | 255,888,000 |
| Size | 1.5 GB | 244.0 MB |
| Events in quadrant A | 10,983,916 | 1,722,545 |
| Events in quadrant B | 11,804,357 | 1,864,811 |
| Events in quadrant C | 17,604,115 | 1,428,507 |
| Events in quadrant D | 17,242,000 | 1,407,759 |
| Mode SS | |||
|---|---|---|---|
| Quadrant | BADHDUFLAG | Total packets | Discarded packets |
| A | 0 | 394 | 0 |
| B | 0 | 394 | 0 |
| C | 0 | 394 | 0 |
| D | 0 | 394 | 0 |
| Mode M0 | |||
|---|---|---|---|
| Quadrant | BADHDUFLAG | Total packets | Discarded packets |
| A | 0 | 45944 | 4 |
| B | 0 | 48626 | 4 |
| C | 0 | 65448 | 4 |
| D | 0 | 64742 | 4 |
| Mode M9 | |||
|---|---|---|---|
| Quadrant | BADHDUFLAG | Total packets | Discarded packets |
| A | 0 | 12 | 0 |
| B | 0 | 12 | 0 |
| C | 0 | 12 | 0 |
| D | 0 | 12 | 0 |
| Quadrant | Total seconds | Saturated seconds | Saturation percentage |
|---|---|---|---|
| A | 19200 | 635 | 3.307292% |
| B | 19201 | 870 | 4.531014% |
| C | 19201 | 2863 | 14.910682% |
| D | 19201 | 2193 | 11.421280% |
Noise dominated data is calculated using 1-second bins in cleaned event files. If a bin has >2000 counts, and if more than 50% of those come from <1% of pixels, then it is considered to be noise-dominated and hence unusable.
| Quadrant | # 1 sec bins | Bins with >0 counts | Bins with >2000 counts | High rate bins dominated by noise | Noise dominated (total time) | Noise dominated (detector-on time) | Marked lightcurve |
|---|---|---|---|---|---|---|---|
| A | 20535 | 19200 | 333 | 333 | 1.62% | 1.73% | 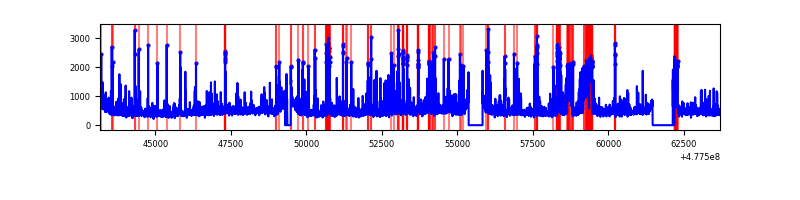 |
| B | 20536 | 19202 | 374 | 374 | 1.82% | 1.95% | 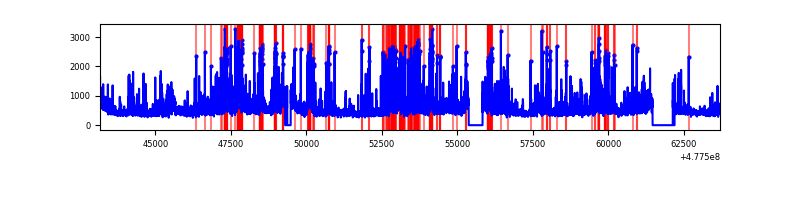 |
| C | 20536 | 19202 | 1887 | 1887 | 9.19% | 9.83% | 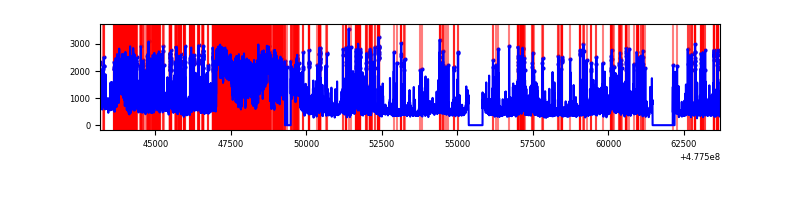 |
| D | 20536 | 19202 | 1657 | 1657 | 8.07% | 8.63% | 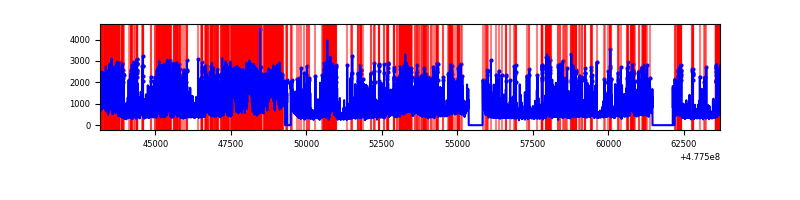 |
Top three noisy pixels from each quadrant. If the there are fewer than three noisy pixels in the level2.evt file, extra rows are filled as -1
| Pixel properties | Quadrant properties | ||||||
|---|---|---|---|---|---|---|---|
| Quadrant | DetID | PixID | Counts | Sigma | Mean | Median | Sigma |
| A | 12 | 80 | 940608 | 1860.4 | 2054 | 2001 | 504.5 |
| A | 4 | 3 | 356488 | 702.63 | 2054 | 2001 | 504.5 |
| A | 4 | 249 | 269667 | 530.54 | 2054 | 2001 | 504.5 |
| B | 4 | 206 | 1901867 | 4404.38 | 2025 | 1953 | 431.4 |
| B | 8 | 128 | 727846 | 1682.77 | 2025 | 1953 | 431.4 |
| B | 7 | 0 | 248993 | 572.69 | 2025 | 1953 | 431.4 |
| C | 5 | 10 | 2838864 | 5575.34 | 1872 | 1860 | 508.8 |
| C | 4 | 210 | 2411881 | 4736.22 | 1872 | 1860 | 508.8 |
| C | 15 | 147 | 873777 | 1713.51 | 1872 | 1860 | 508.8 |
| D | 7 | 126 | 1762833 | 3304.0 | 1911 | 1846 | 533.0 |
| D | 2 | 216 | 1092553 | 2046.41 | 1911 | 1846 | 533.0 |
| D | 2 | 249 | 1053492 | 1973.12 | 1911 | 1846 | 533.0 |
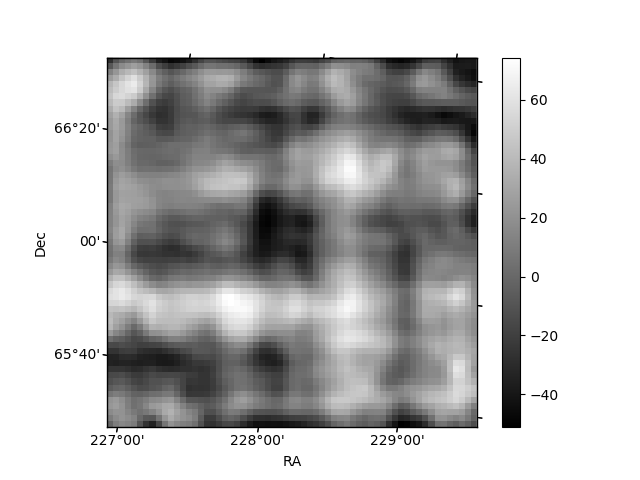
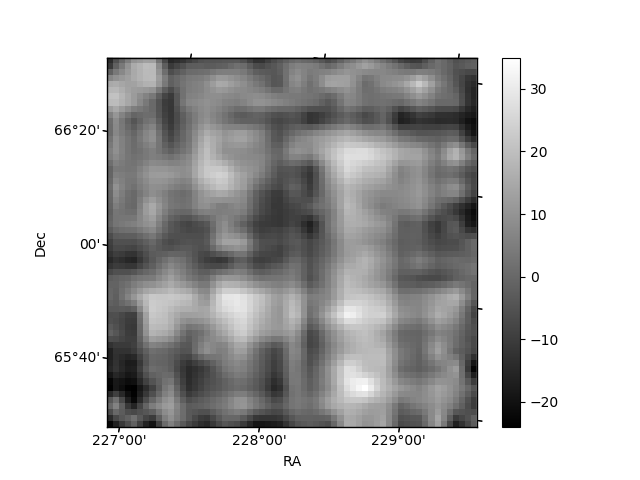
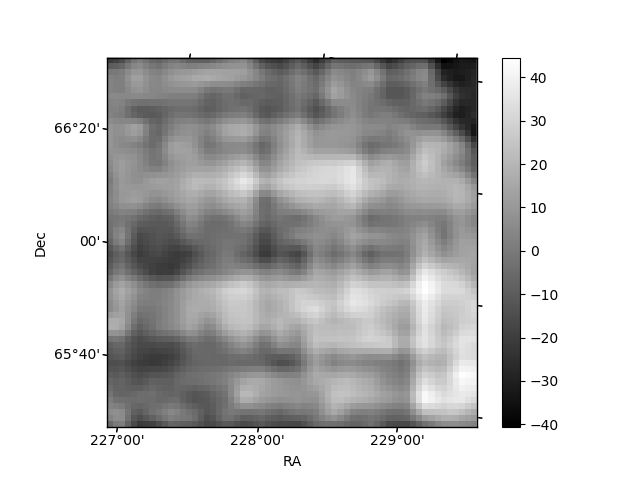
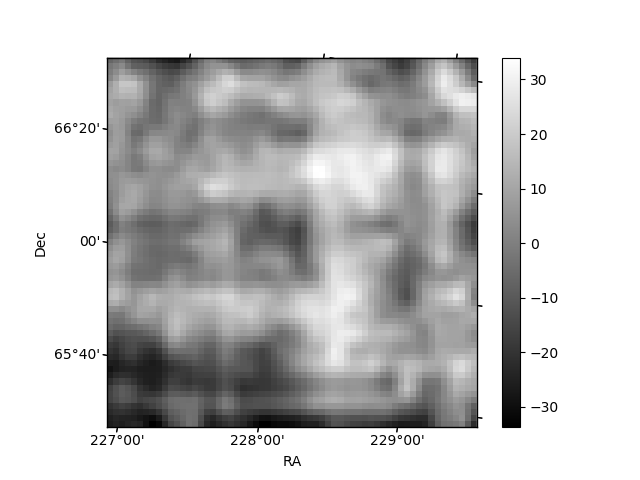
Histogram calculated using DETX and DETY for each event in the final _common_clean file
| Quadrant A | 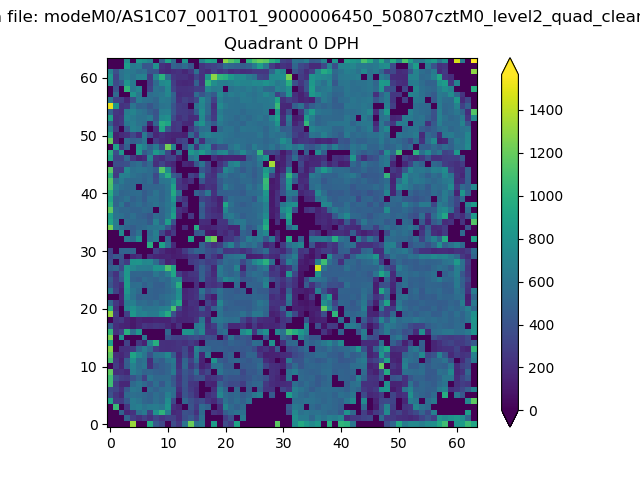 |
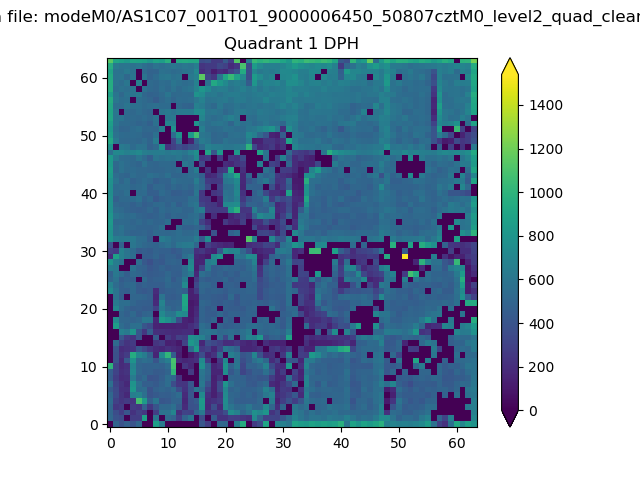 |
Quadrant B |
|---|---|---|---|
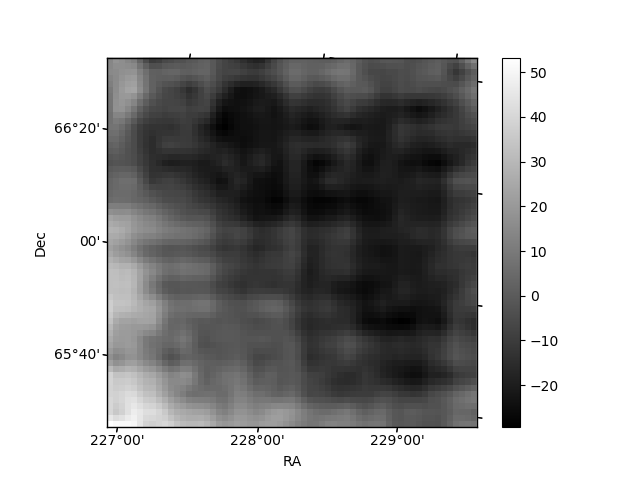
| Quadrant D | 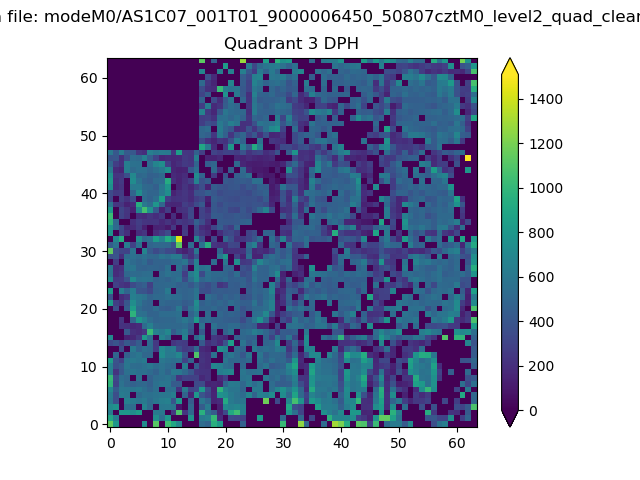 |
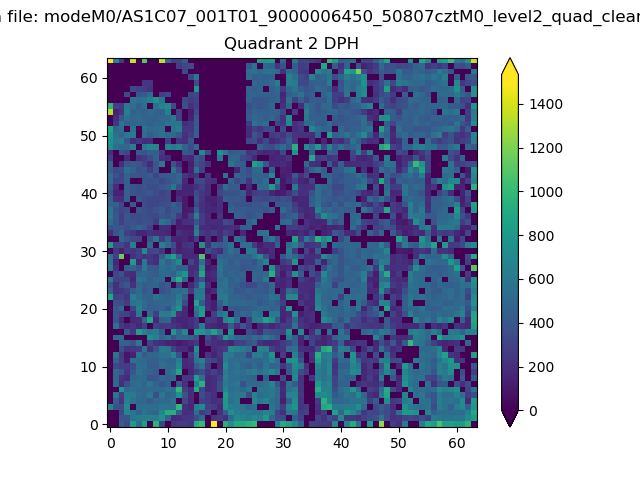 |
Quadrant C |
| Plot type | Count rate plots | Images |
|---|---|---|
| Comparison with Poisson distribution Blue bars denote a histogram of data divided into 1 sec bins. Red curve is a Poisson curve with rate = median count rate of data. |
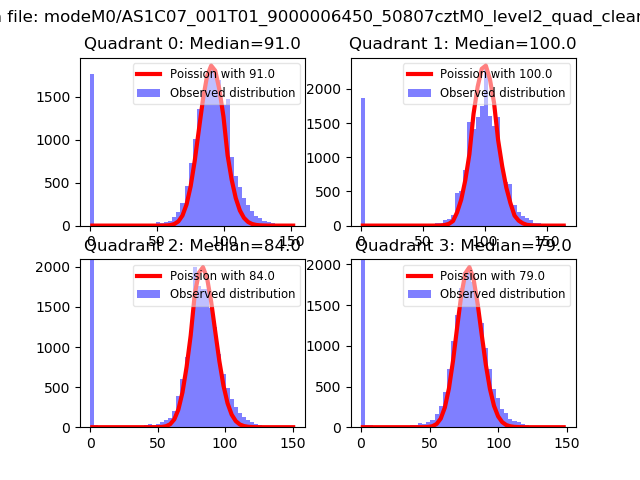 |
 |
| Quadrant-wise count rates Data is divided into 100 sec bins |
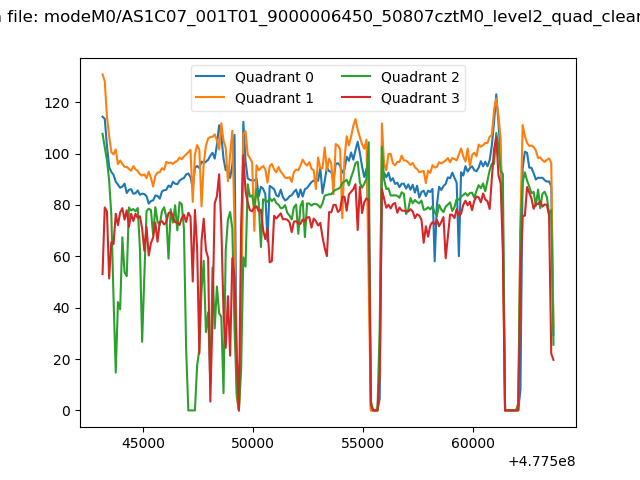 |
|
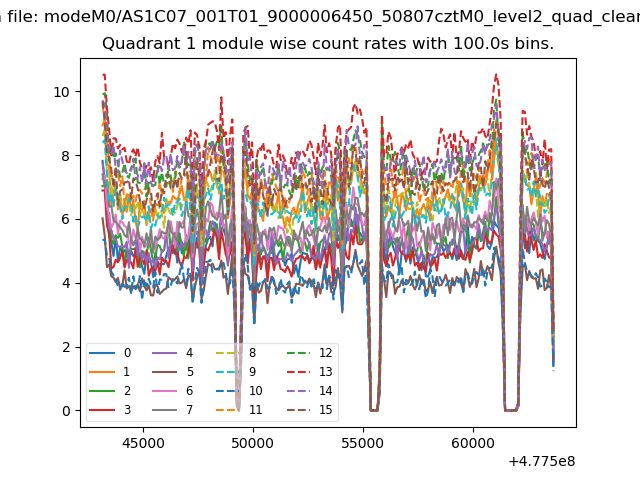
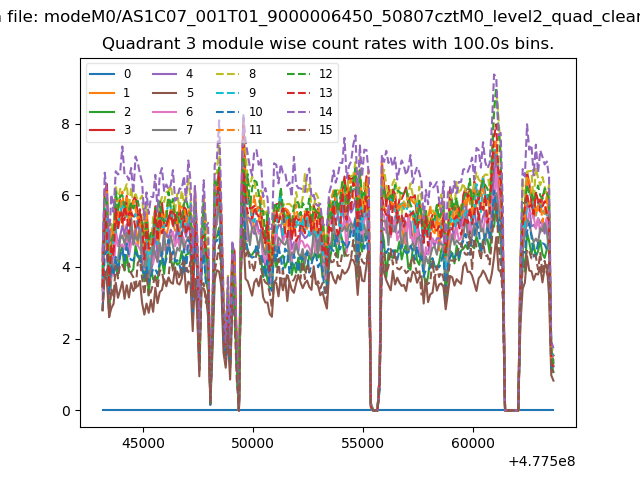
| Module-wise count rates for Quadrant A Data is divided into 100 sec bins |
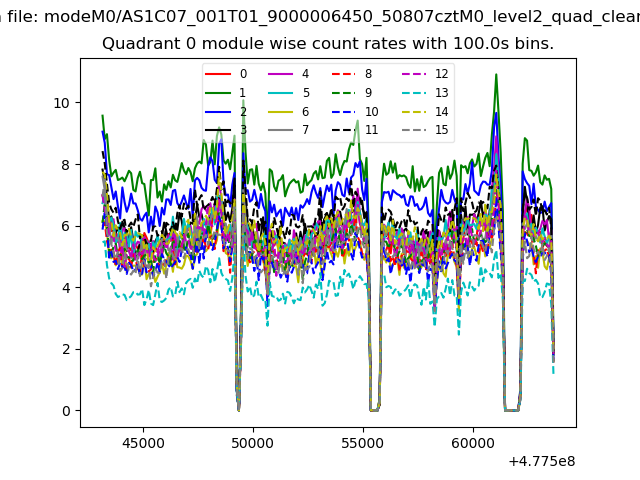 |
 |
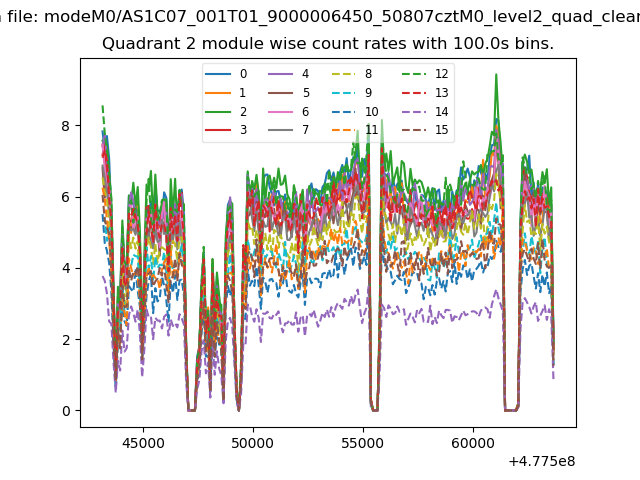
| Module-wise count rates for Quadrant B Data is divided into 100 sec bins |
 |
 |
| Module-wise count rates for Quadrant C Data is divided into 100 sec bins |
 |
 |
| Module-wise count rates for Quadrant D Data is divided into 100 sec bins |
 |
 |
| Parameter | Plot |
|---|---|
| CZT HV Monitor |  |
| D_VDD | 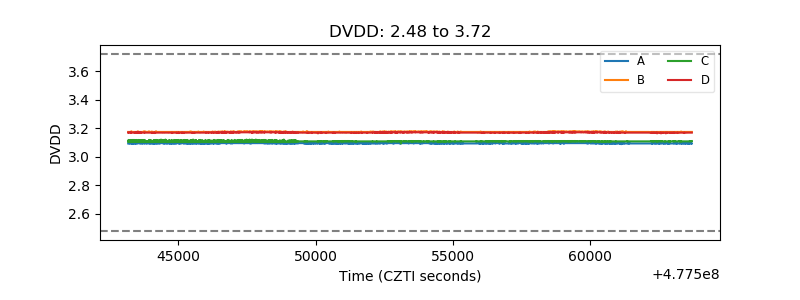 |
| Temperature 1 | 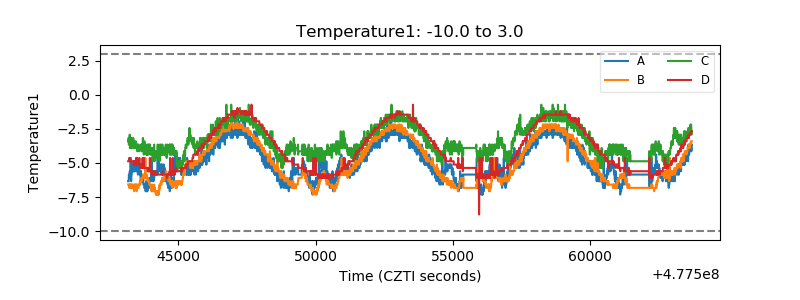 |
| Veto HV Monitor | 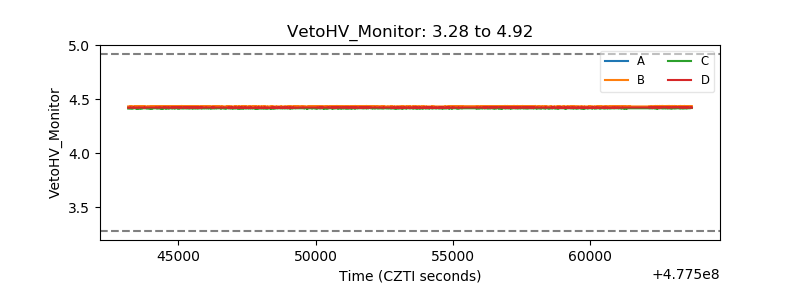 |
| Veto LLD | 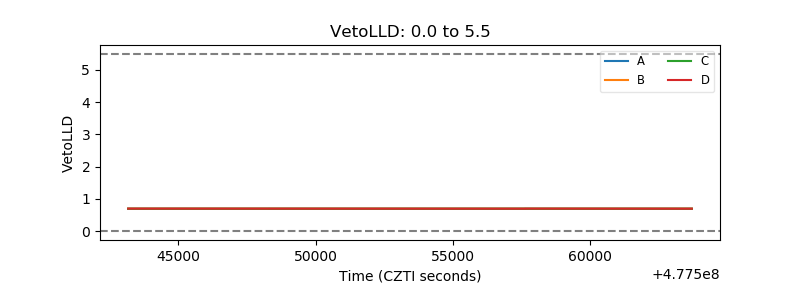 |
| Alpha Counter | 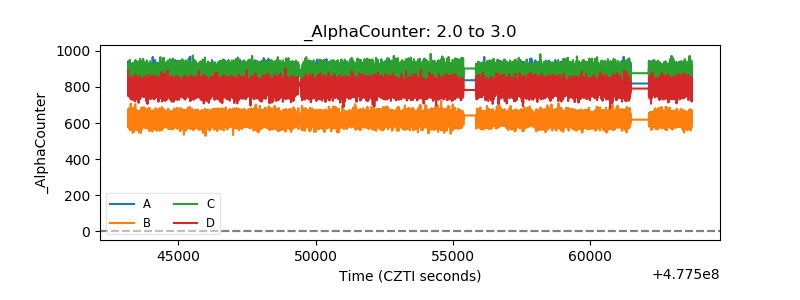 |
| _CPM_Rate | 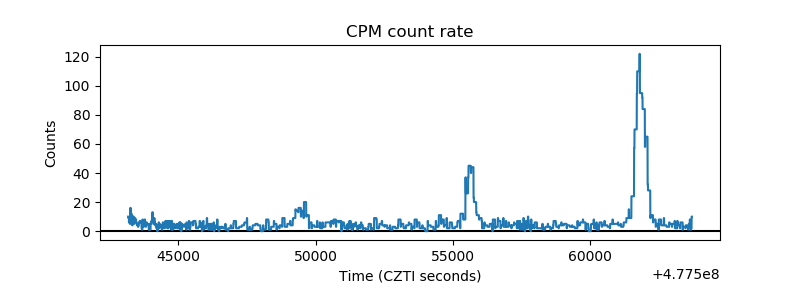 |
| CZT Counter | 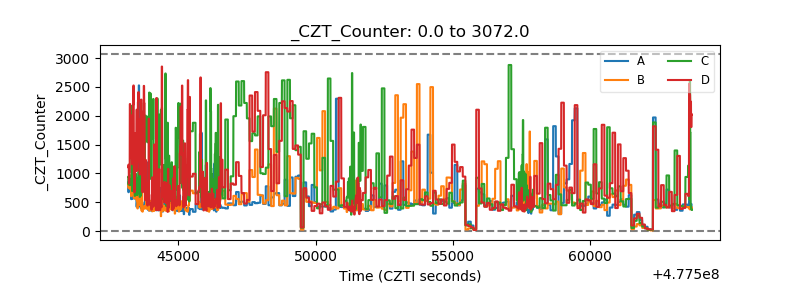 |
| +2.5 Volts monitor | 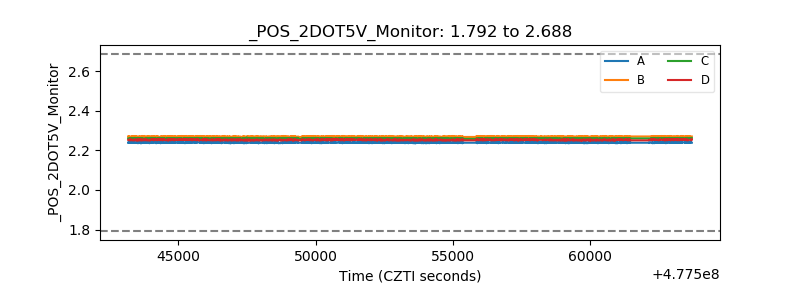 |
| +5 Volts monitor | 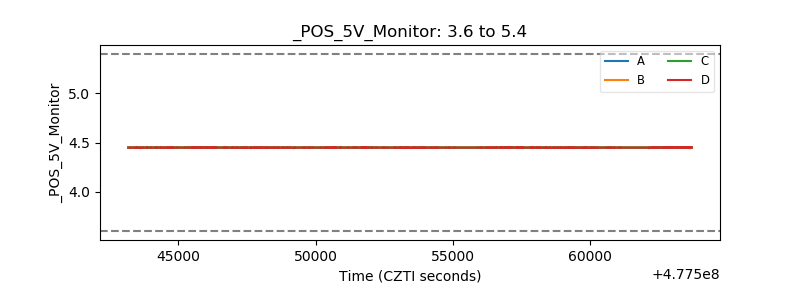 |
| _ROLL_ROT | 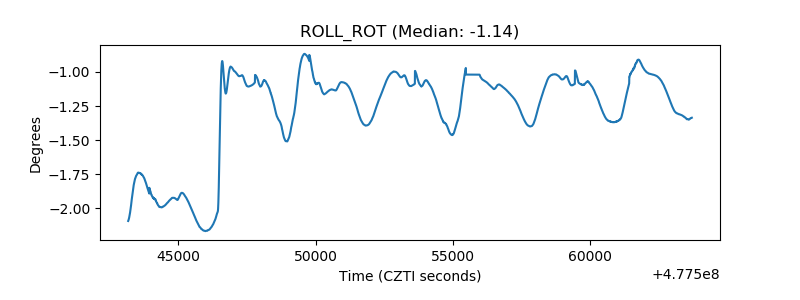 |
| _Roll_DEC | 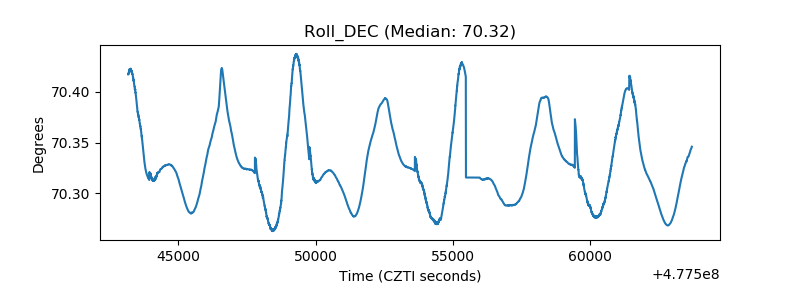 |
| _Roll_RA | 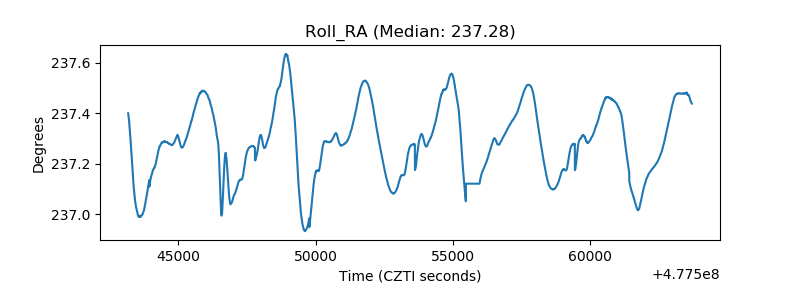 |
| Veto Counter | 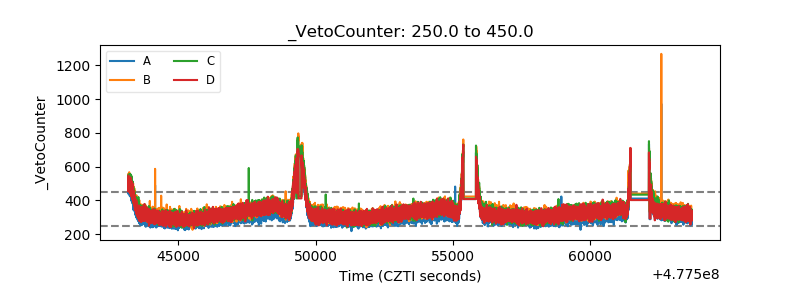 |