| Param | Original file | Final file |
|---|---|---|
| Filename | modeM0/AS1C07_001T01_9000006450_50808cztM0_level2.fits | modeM0/AS1C07_001T01_9000006450_50808cztM0_level2_quad_clean.evt |
| Size (bytes) | 519,079,680 | 95,261,760 |
| Size | 495.0 MB | 90.8 MB |
| Events in quadrant A | 4,167,871 | 617,390 |
| Events in quadrant B | 4,076,166 | 676,434 |
| Events in quadrant C | 4,652,370 | 588,693 |
| Events in quadrant D | 5,793,130 | 530,711 |
| Mode SS | |||
|---|---|---|---|
| Quadrant | BADHDUFLAG | Total packets | Discarded packets |
| A | 0 | 139917161441320 | 139917149601838 |
| B | 0 | -1 | -1 |
| C | 0 | -1 | -1 |
| D | 0 | -1 | -1 |
| Mode M0 | |||
|---|---|---|---|
| Quadrant | BADHDUFLAG | Total packets | Discarded packets |
| A | 0 | 17017 | 1 |
| B | 0 | 16789 | 1 |
| C | 0 | 18490 | 1 |
| D | 0 | 21907 | 1 |
| Mode M9 | |||
|---|---|---|---|
| Quadrant | BADHDUFLAG | Total packets | Discarded packets |
| A | 0 | 9 | 0 |
| B | 0 | 9 | 0 |
| C | 0 | 9 | 0 |
| D | 0 | 9 | 0 |
| Quadrant | Total seconds | Saturated seconds | Saturation percentage |
|---|---|---|---|
| A | 6762 | 335 | 4.954156% |
| B | 6762 | 276 | 4.081633% |
| C | 6762 | 364 | 5.383023% |
| D | 6762 | 663 | 9.804791% |
Noise dominated data is calculated using 1-second bins in cleaned event files. If a bin has >2000 counts, and if more than 50% of those come from <1% of pixels, then it is considered to be noise-dominated and hence unusable.
| Quadrant | # 1 sec bins | Bins with >0 counts | Bins with >2000 counts | High rate bins dominated by noise | Noise dominated (total time) | Noise dominated (detector-on time) | Marked lightcurve |
|---|---|---|---|---|---|---|---|
| A | 7657 | 6762 | 248 | 248 | 3.24% | 3.67% | 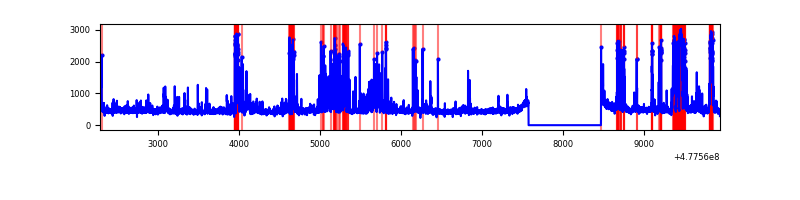 |
| B | 7657 | 6762 | 176 | 176 | 2.30% | 2.60% | 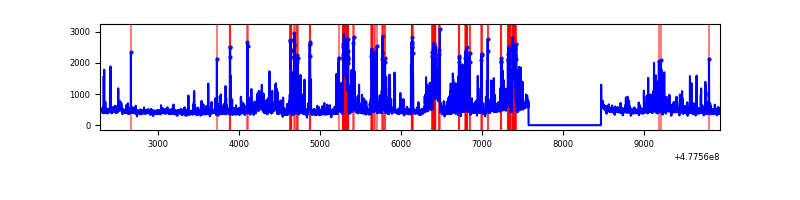 |
| C | 7657 | 6762 | 326 | 326 | 4.26% | 4.82% | 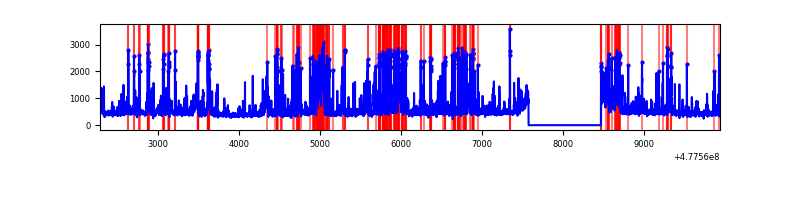 |
| D | 7657 | 6762 | 563 | 563 | 7.35% | 8.33% | 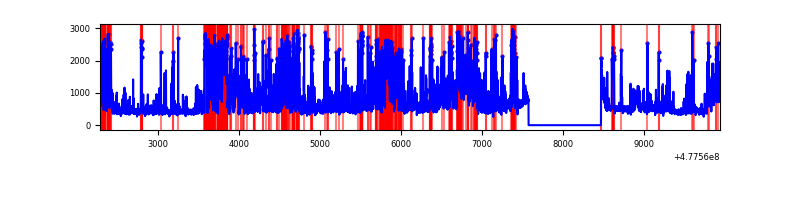 |
Top three noisy pixels from each quadrant. If the there are fewer than three noisy pixels in the level2.evt file, extra rows are filled as -1
| Pixel properties | Quadrant properties | ||||||
|---|---|---|---|---|---|---|---|
| Quadrant | DetID | PixID | Counts | Sigma | Mean | Median | Sigma |
| A | 9 | 13 | 346526 | 1961.18 | 709 | 691 | 176.3 |
| A | 8 | 38 | 238302 | 1347.46 | 709 | 691 | 176.3 |
| A | 6 | 161 | 123679 | 697.45 | 709 | 691 | 176.3 |
| B | 4 | 206 | 642676 | 4240.72 | 706 | 682 | 151.4 |
| B | 8 | 128 | 300767 | 1982.22 | 706 | 682 | 151.4 |
| B | 7 | 0 | 83865 | 549.47 | 706 | 682 | 151.4 |
| C | 9 | 38 | 581101 | 2991.29 | 685 | 680 | 194.0 |
| C | 13 | 3 | 313103 | 1610.12 | 685 | 680 | 194.0 |
| C | 5 | 10 | 176631 | 906.79 | 685 | 680 | 194.0 |
| D | 10 | 181 | 663986 | 3514.58 | 666 | 643 | 188.7 |
| D | 2 | 216 | 641064 | 3393.13 | 666 | 643 | 188.7 |
| D | 10 | 172 | 467423 | 2473.13 | 666 | 643 | 188.7 |
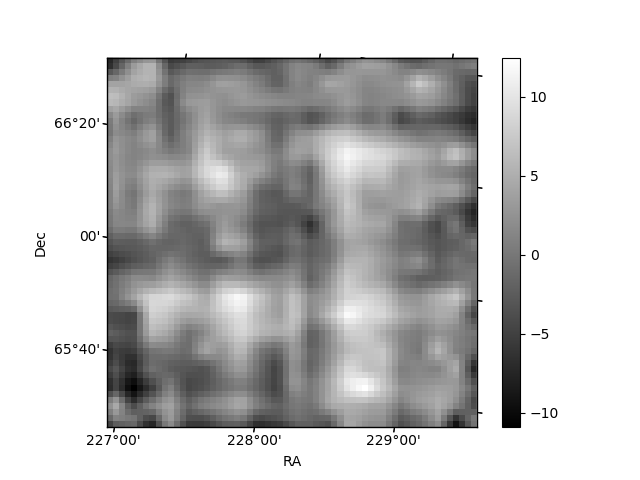
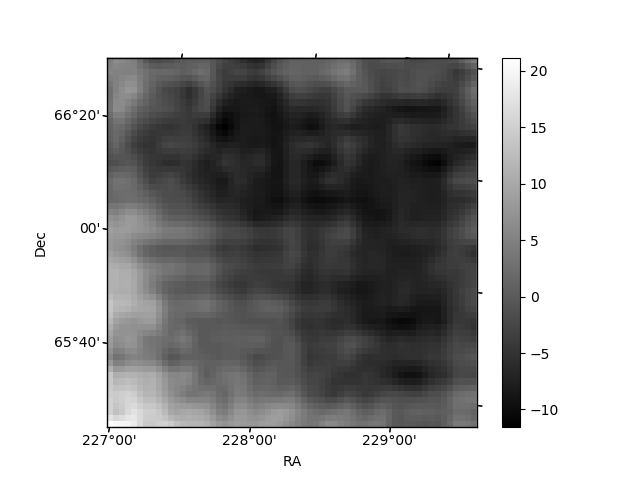
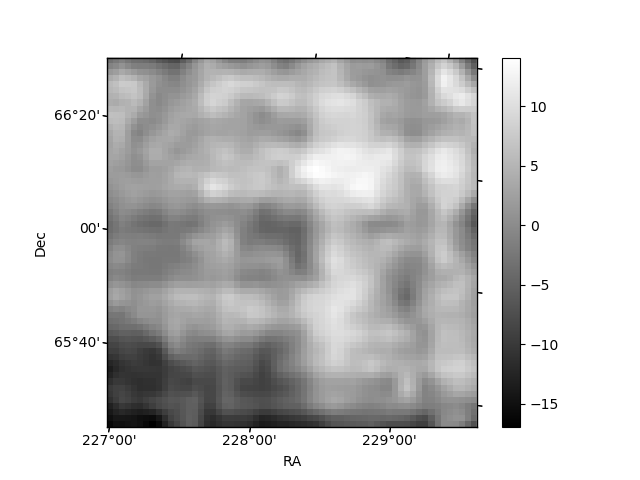
Histogram calculated using DETX and DETY for each event in the final _common_clean file
| Quadrant A | 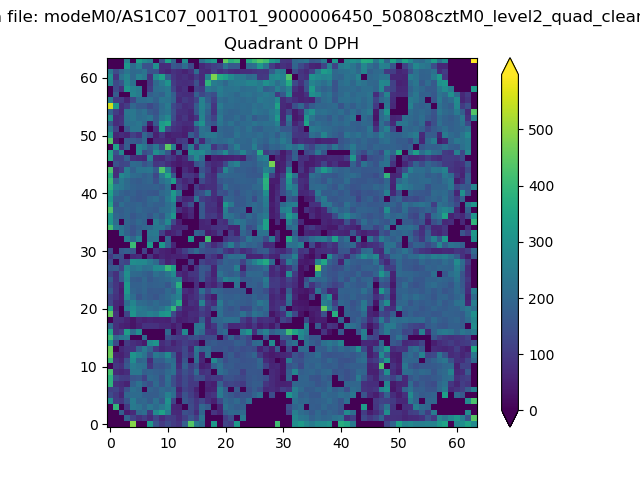 |
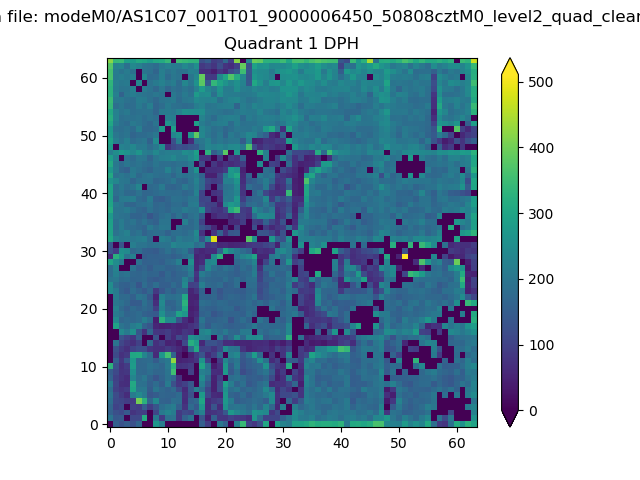 |
Quadrant B |
|---|---|---|---|
| Quadrant D | 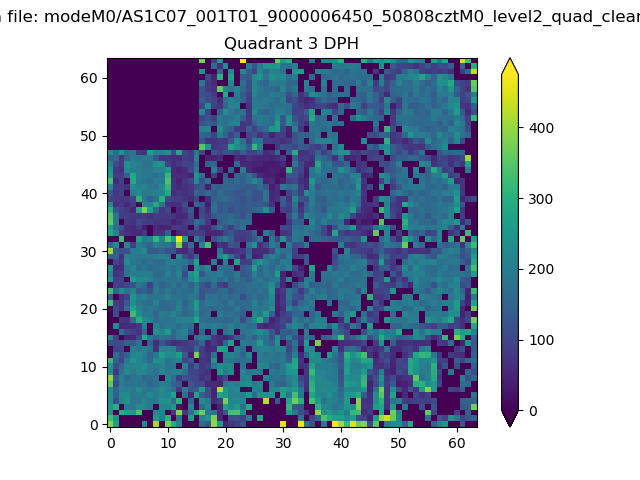 |
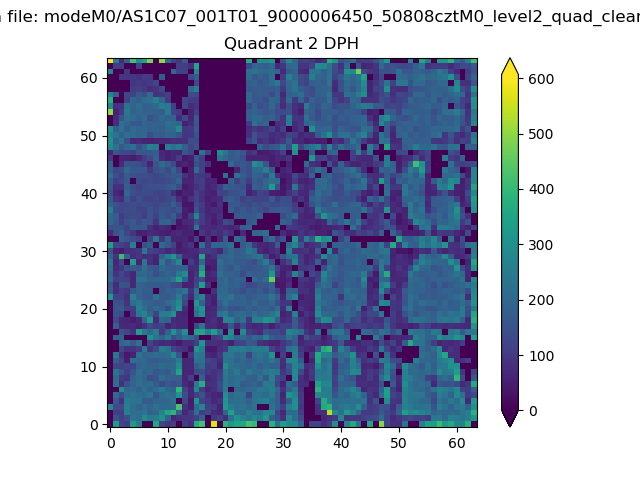 |
Quadrant C |
| Plot type | Count rate plots | Images |
|---|---|---|
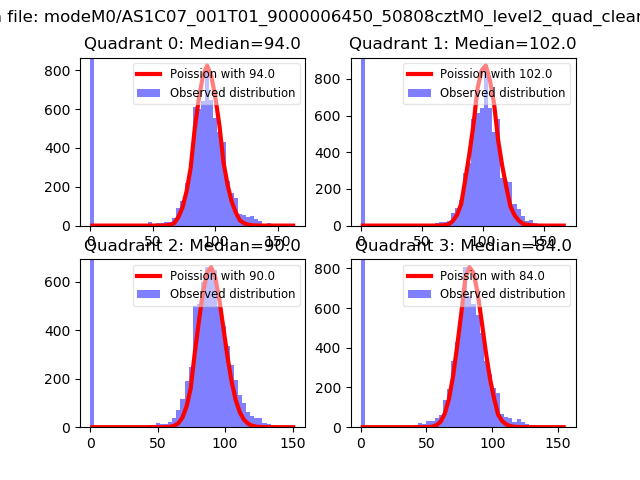
| Comparison with Poisson distribution Blue bars denote a histogram of data divided into 1 sec bins. Red curve is a Poisson curve with rate = median count rate of data. |
 |
 |
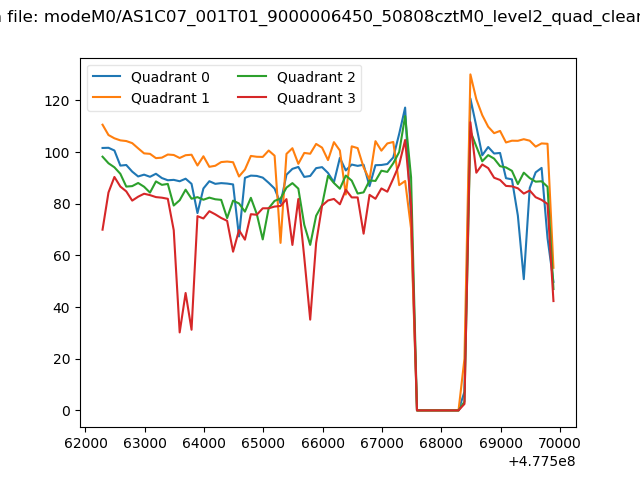
| Quadrant-wise count rates Data is divided into 100 sec bins |
 |
|
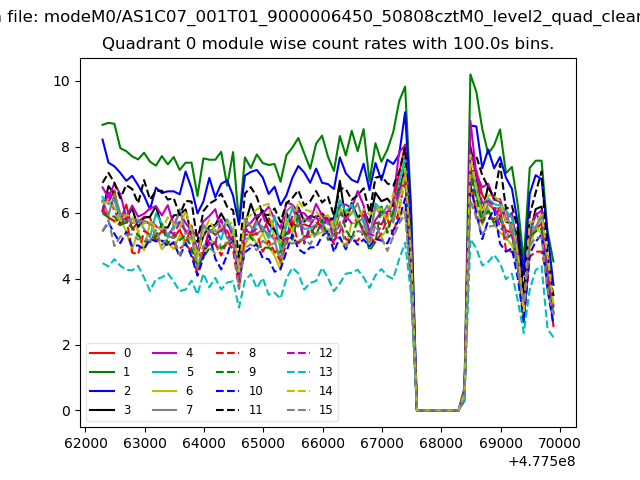
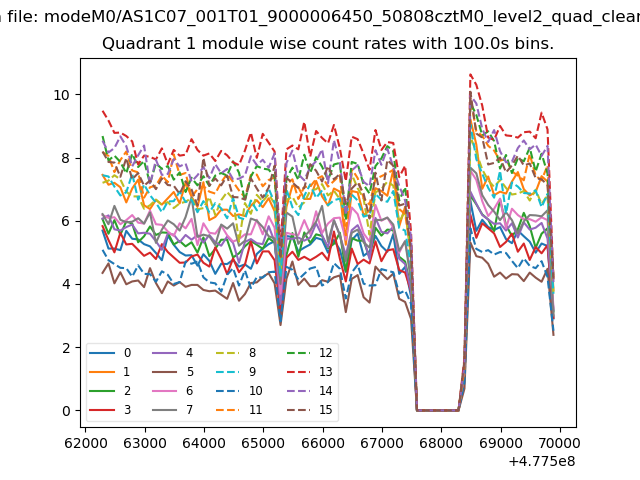
| Module-wise count rates for Quadrant A Data is divided into 100 sec bins |
 |
 |
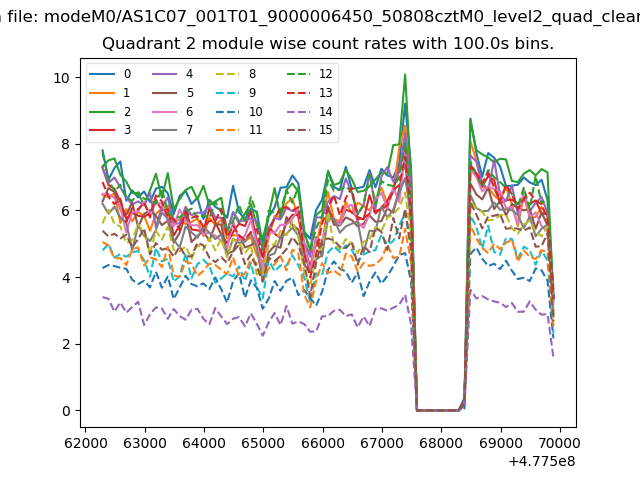
| Module-wise count rates for Quadrant B Data is divided into 100 sec bins |
 |
 |
| Module-wise count rates for Quadrant C Data is divided into 100 sec bins |
 |
 |
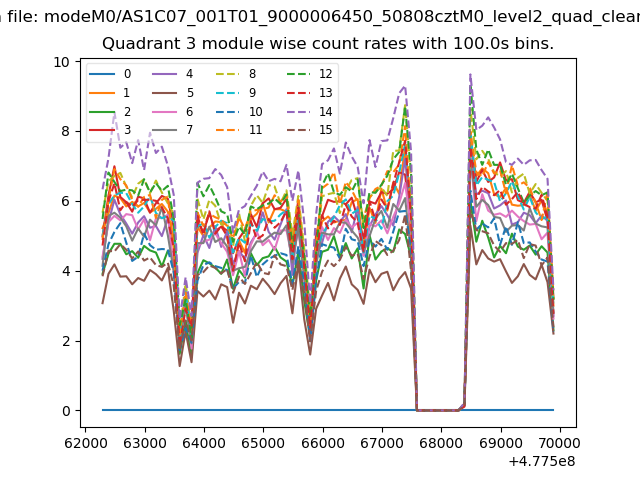
| Module-wise count rates for Quadrant D Data is divided into 100 sec bins |
 |
 |
| Parameter | Plot |
|---|---|
| CZT HV Monitor | 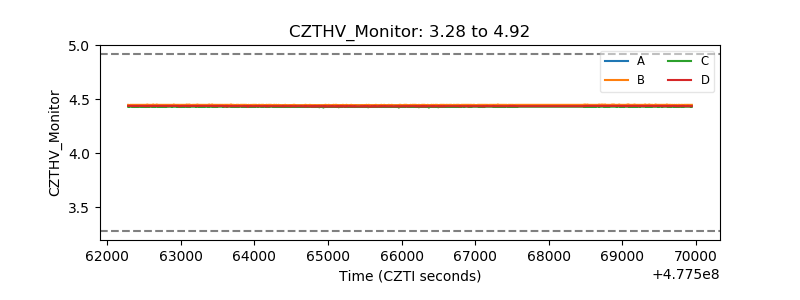 |
| D_VDD | 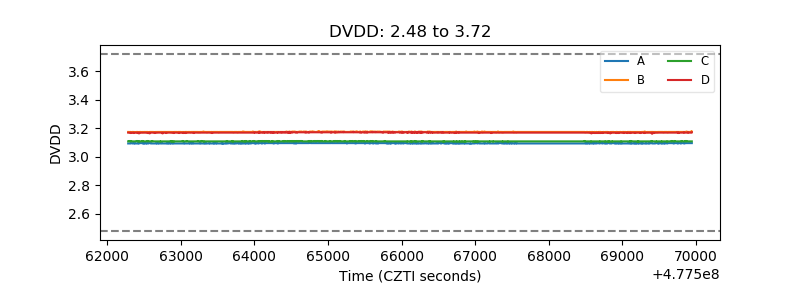 |
| Temperature 1 | 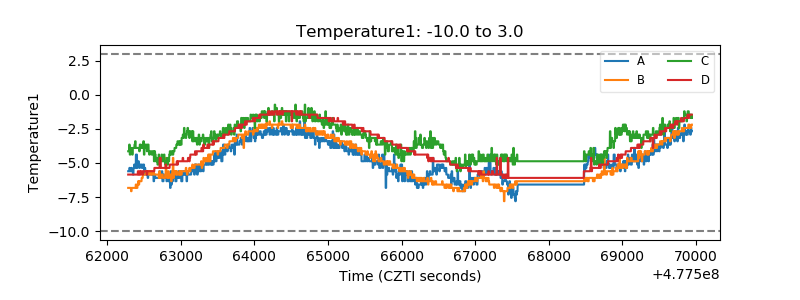 |
| Veto HV Monitor | 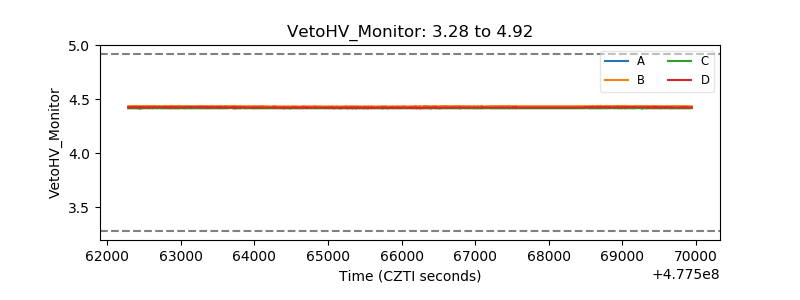 |
| Veto LLD | 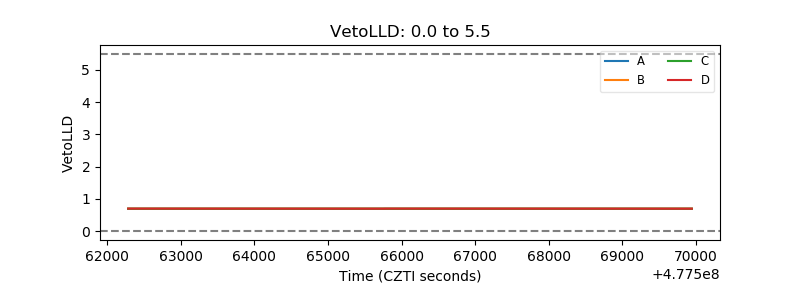 |
| Alpha Counter | 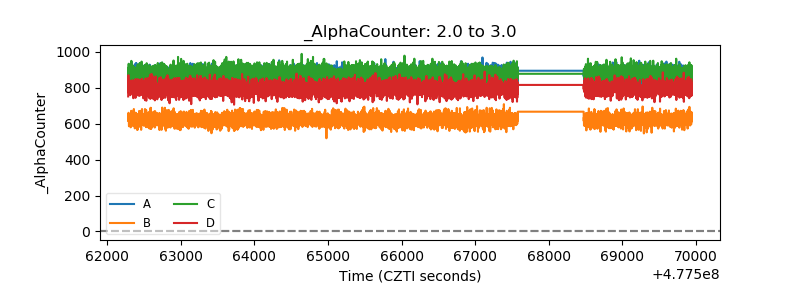 |
| _CPM_Rate | 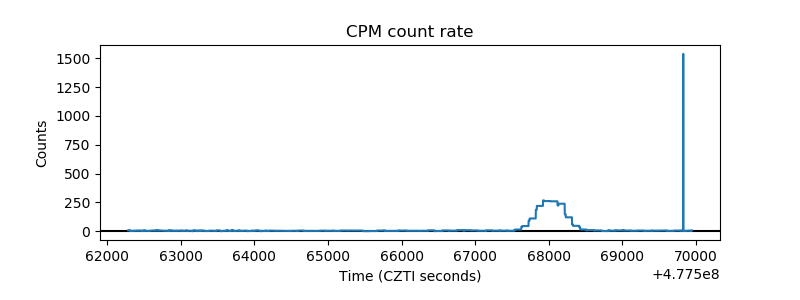 |
| CZT Counter | 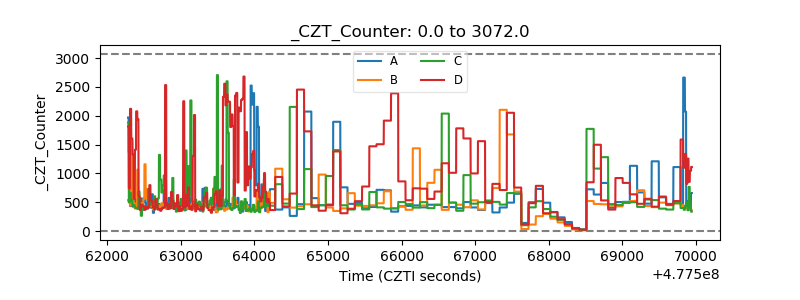 |
| +2.5 Volts monitor | 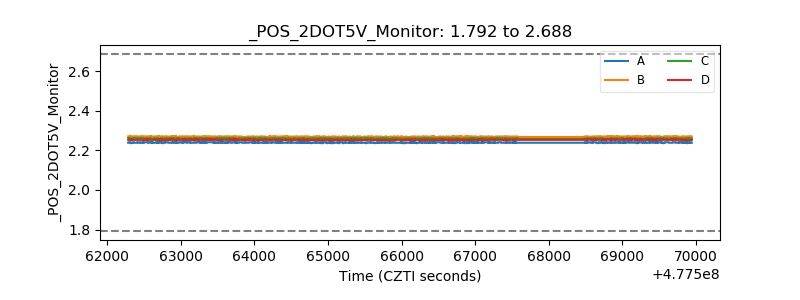 |
| +5 Volts monitor | 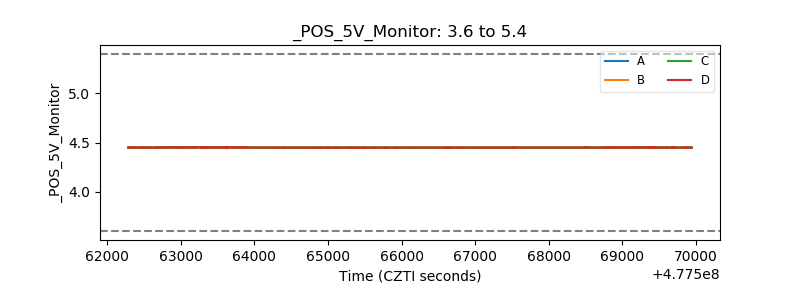 |
| _ROLL_ROT | 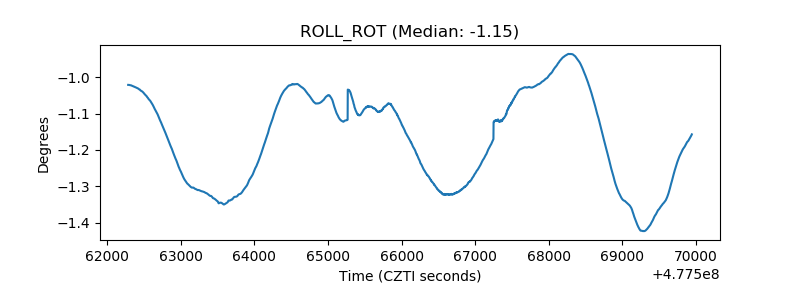 |
| _Roll_DEC | 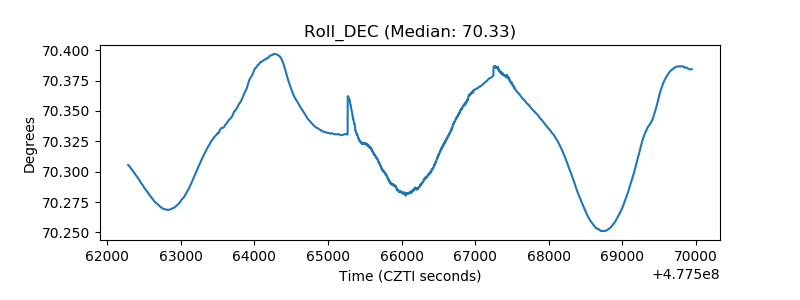 |
| _Roll_RA | 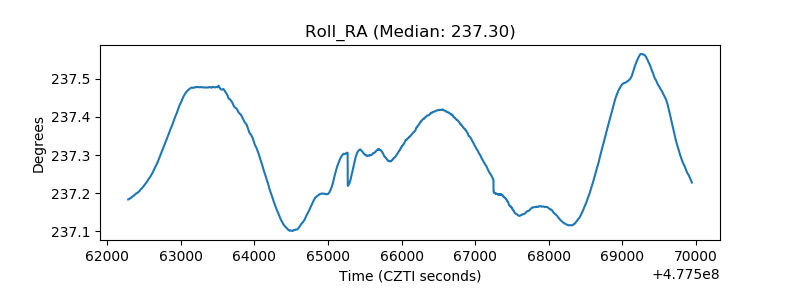 |
| Veto Counter | 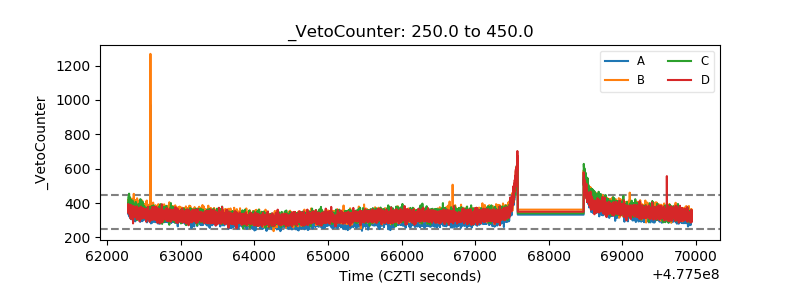 |