| Param | Original file | Final file |
|---|---|---|
| Filename | modeM0/AS1C07_001T01_9000006450_50810cztM0_level2.fits | modeM0/AS1C07_001T01_9000006450_50810cztM0_level2_quad_clean.evt |
| Size (bytes) | 520,398,720 | 99,501,120 |
| Size | 496.3 MB | 94.9 MB |
| Events in quadrant A | 4,391,109 | 646,885 |
| Events in quadrant B | 3,763,136 | 723,332 |
| Events in quadrant C | 4,230,330 | 627,075 |
| Events in quadrant D | 6,341,737 | 533,651 |
| Mode SS | |||
|---|---|---|---|
| Quadrant | BADHDUFLAG | Total packets | Discarded packets |
| A | 0 | 140 | 0 |
| B | 0 | 140 | 0 |
| C | 0 | 140 | 0 |
| D | 0 | 140 | 0 |
| Mode M0 | |||
|---|---|---|---|
| Quadrant | BADHDUFLAG | Total packets | Discarded packets |
| A | 0 | 17637 | 2 |
| B | 0 | 15936 | 2 |
| C | 0 | 17315 | 2 |
| D | 0 | 23556 | 2 |
| Mode M9 | |||
|---|---|---|---|
| Quadrant | BADHDUFLAG | Total packets | Discarded packets |
| A | 0 | 10 | 0 |
| B | 0 | 10 | 0 |
| C | 0 | 10 | 0 |
| D | 0 | 10 | 0 |
| Quadrant | Total seconds | Saturated seconds | Saturation percentage |
|---|---|---|---|
| A | 6915 | 360 | 5.206074% |
| B | 6916 | 156 | 2.255639% |
| C | 6916 | 219 | 3.166570% |
| D | 6916 | 883 | 12.767496% |
Noise dominated data is calculated using 1-second bins in cleaned event files. If a bin has >2000 counts, and if more than 50% of those come from <1% of pixels, then it is considered to be noise-dominated and hence unusable.
| Quadrant | # 1 sec bins | Bins with >0 counts | Bins with >2000 counts | High rate bins dominated by noise | Noise dominated (total time) | Noise dominated (detector-on time) | Marked lightcurve |
|---|---|---|---|---|---|---|---|
| A | 7915 | 6915 | 262 | 262 | 3.31% | 3.79% | 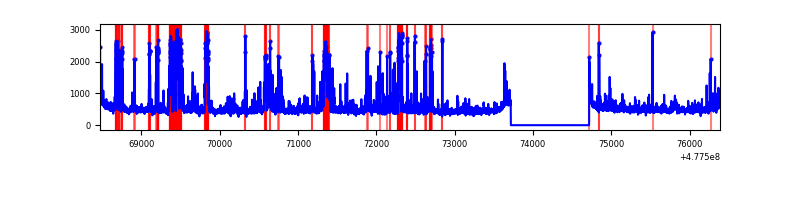 |
| B | 7916 | 6916 | 79 | 79 | 1.00% | 1.14% | 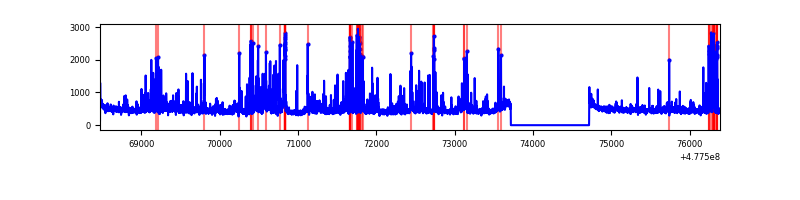 |
| C | 7915 | 6915 | 175 | 175 | 2.21% | 2.53% | 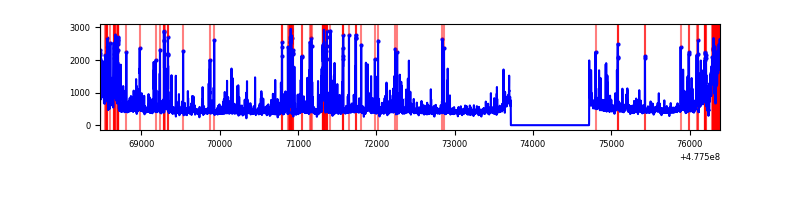 |
| D | 7916 | 6916 | 763 | 763 | 9.64% | 11.03% | 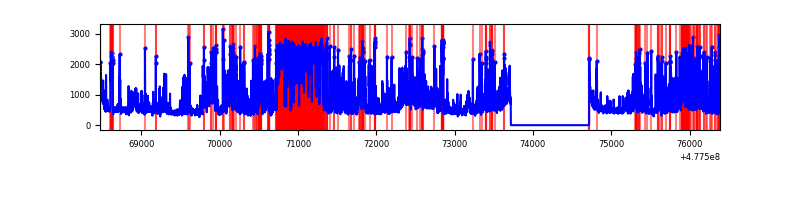 |
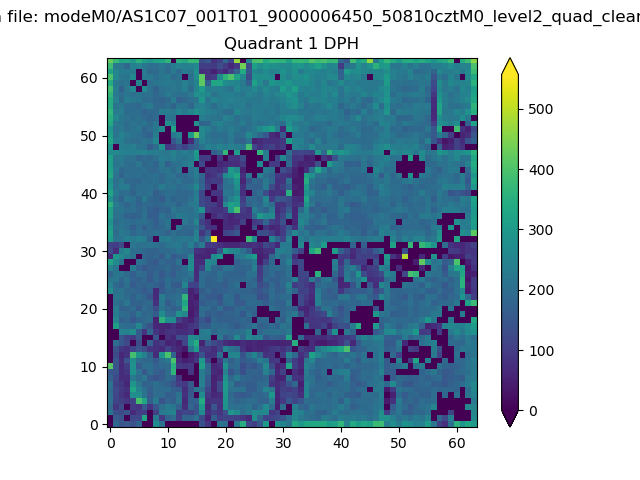
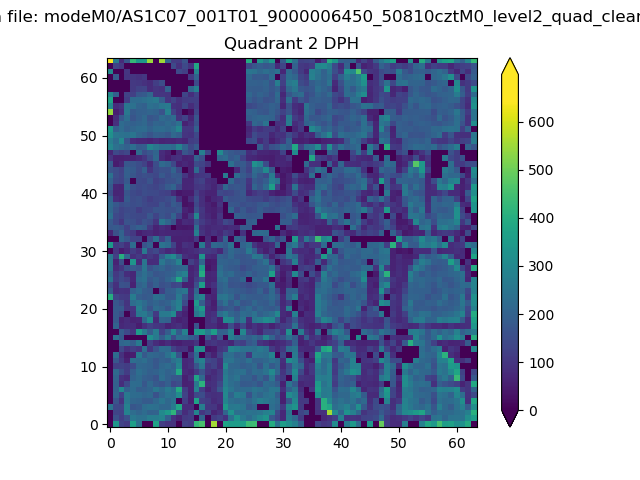
Top three noisy pixels from each quadrant. If the there are fewer than three noisy pixels in the level2.evt file, extra rows are filled as -1
| Pixel properties | Quadrant properties | ||||||
|---|---|---|---|---|---|---|---|
| Quadrant | DetID | PixID | Counts | Sigma | Mean | Median | Sigma |
| A | 9 | 13 | 291352 | 1595.62 | 739 | 721 | 182.1 |
| A | 6 | 161 | 159018 | 869.08 | 739 | 721 | 182.1 |
| A | 3 | 114 | 152934 | 835.68 | 739 | 721 | 182.1 |
| B | 8 | 128 | 277240 | 1752.69 | 740 | 715 | 157.8 |
| B | 4 | 206 | 225263 | 1423.24 | 740 | 715 | 157.8 |
| B | 7 | 252 | 84395 | 530.39 | 740 | 715 | 157.8 |
| C | 5 | 10 | 448395 | 2251.83 | 719 | 710 | 198.8 |
| C | 13 | 3 | 210539 | 1055.43 | 719 | 710 | 198.8 |
| C | 1 | 60 | 180055 | 902.1 | 719 | 710 | 198.8 |
| D | 2 | 216 | 1342498 | 6800.35 | 687 | 662 | 197.3 |
| D | 15 | 108 | 300657 | 1520.36 | 687 | 662 | 197.3 |
| D | 2 | 249 | 286463 | 1448.42 | 687 | 662 | 197.3 |
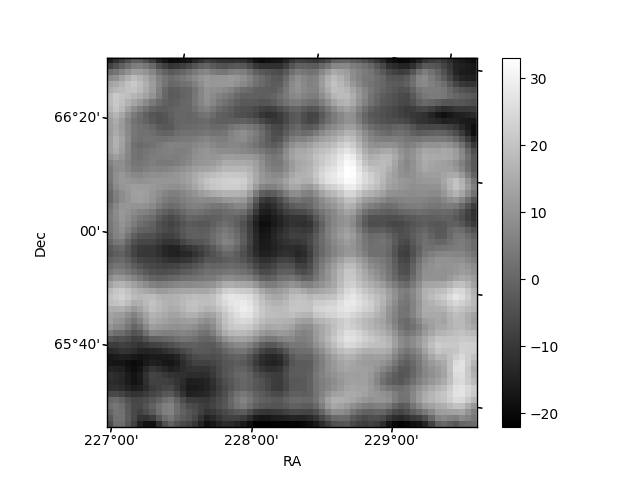
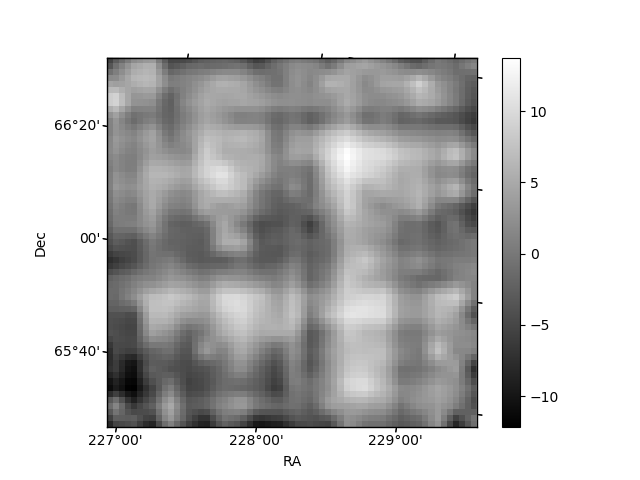
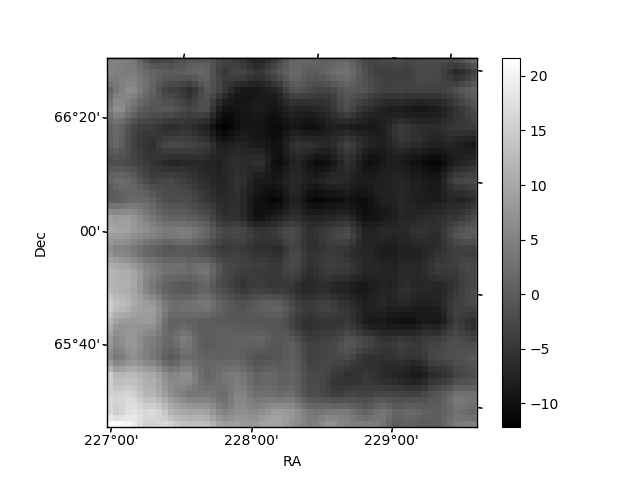
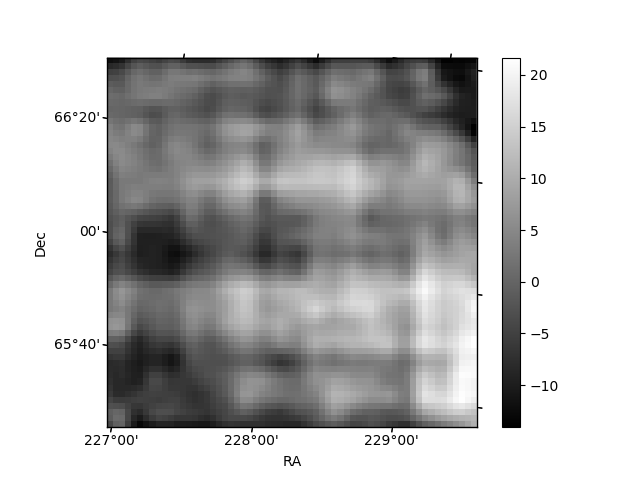
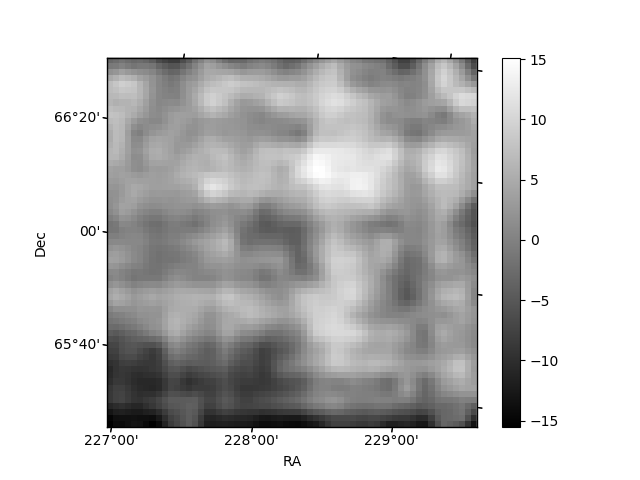
Histogram calculated using DETX and DETY for each event in the final _common_clean file
| Quadrant A | 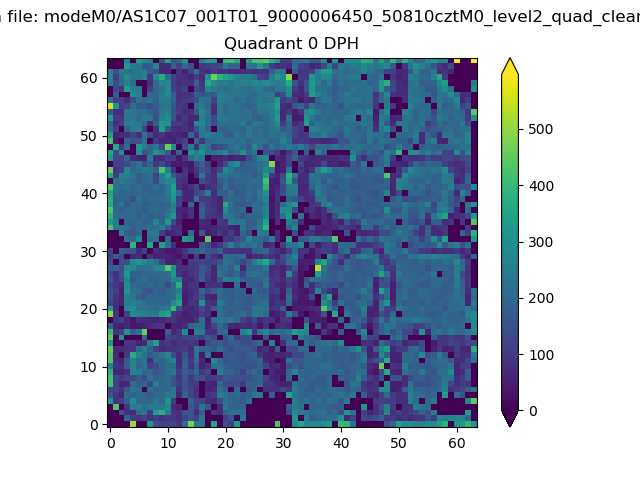 |
 |
Quadrant B |
|---|---|---|---|
| Quadrant D | 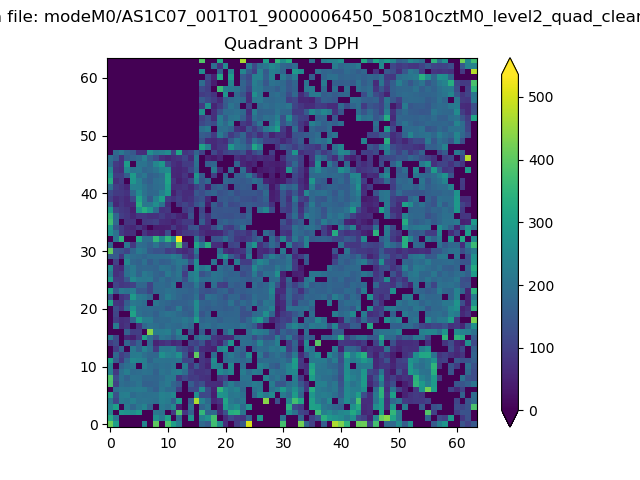 |
 |
Quadrant C |
| Plot type | Count rate plots | Images |
|---|---|---|
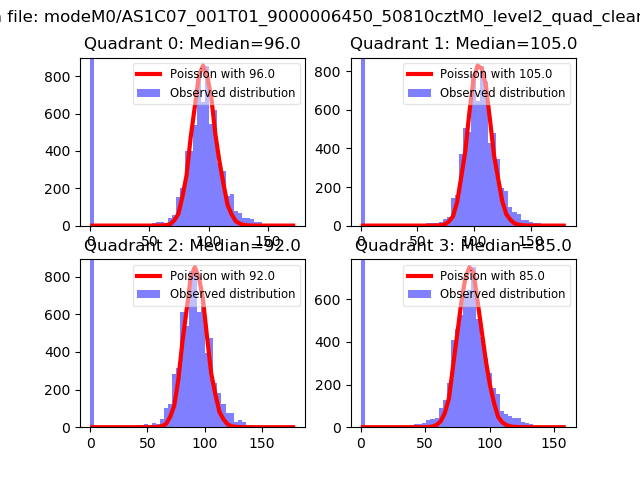
| Comparison with Poisson distribution Blue bars denote a histogram of data divided into 1 sec bins. Red curve is a Poisson curve with rate = median count rate of data. |
 |
 |
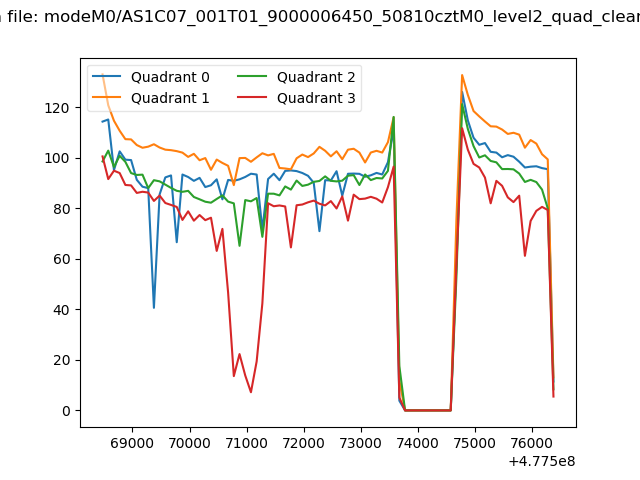
| Quadrant-wise count rates Data is divided into 100 sec bins |
 |
|
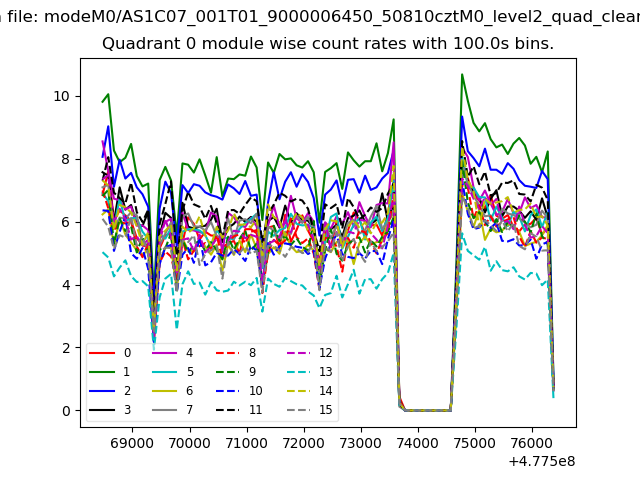
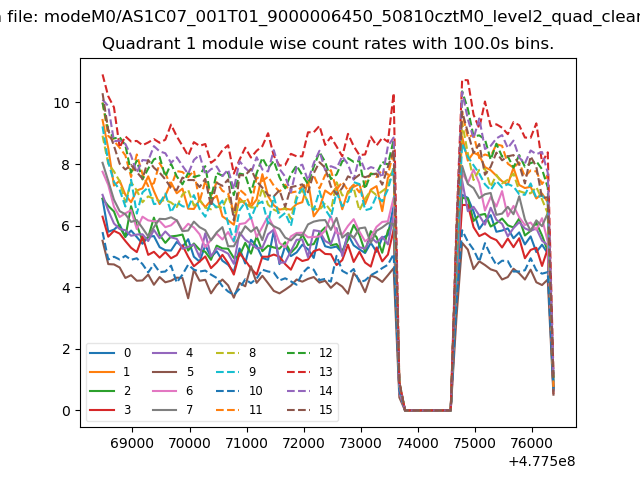
| Module-wise count rates for Quadrant A Data is divided into 100 sec bins |
 |
 |
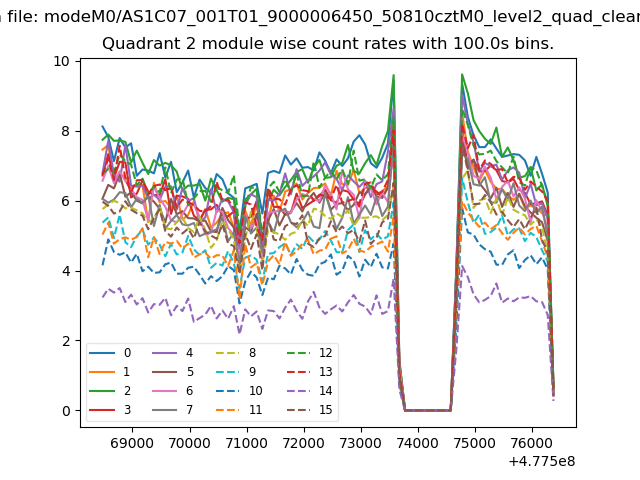
| Module-wise count rates for Quadrant B Data is divided into 100 sec bins |
 |
 |
| Module-wise count rates for Quadrant C Data is divided into 100 sec bins |
 |
 |
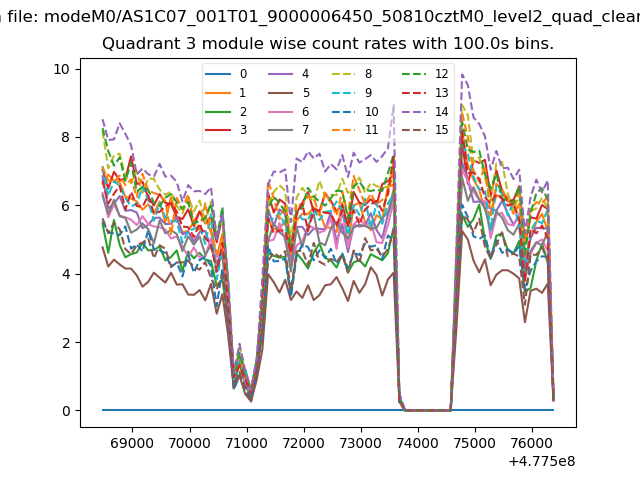
| Module-wise count rates for Quadrant D Data is divided into 100 sec bins |
 |
 |
| Parameter | Plot |
|---|---|
| CZT HV Monitor | 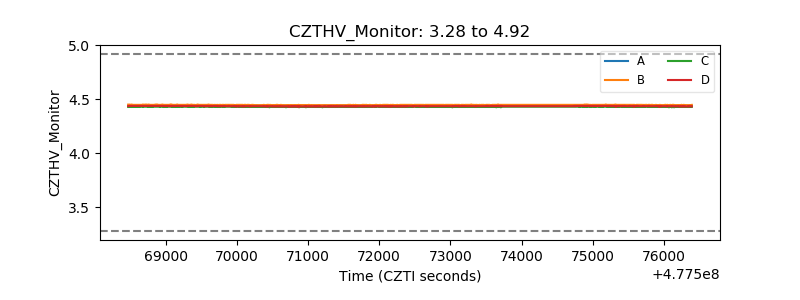 |
| D_VDD | 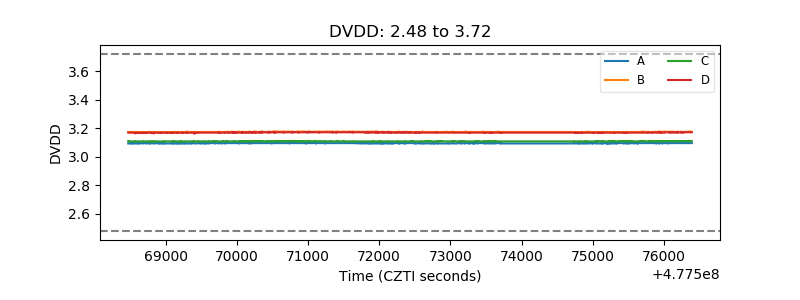 |
| Temperature 1 | 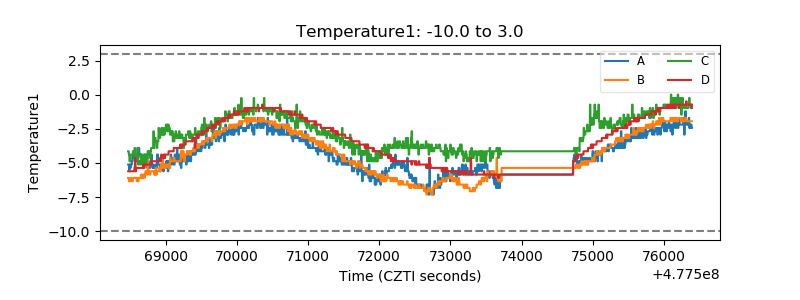 |
| Veto HV Monitor |  |
| Veto LLD | 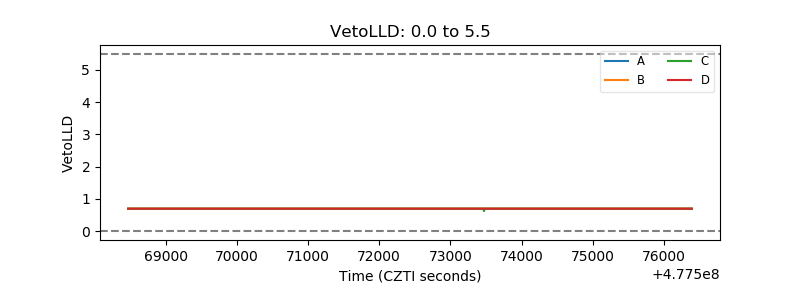 |
| Alpha Counter | 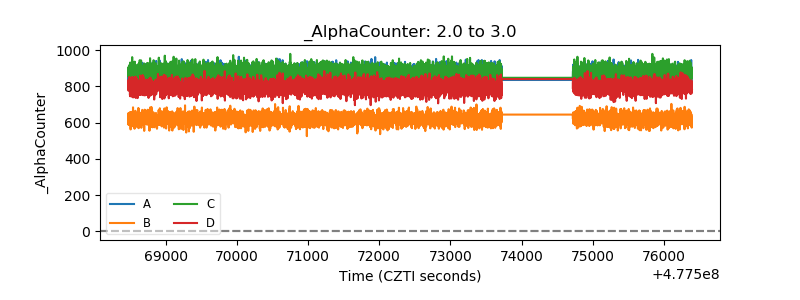 |
| _CPM_Rate | 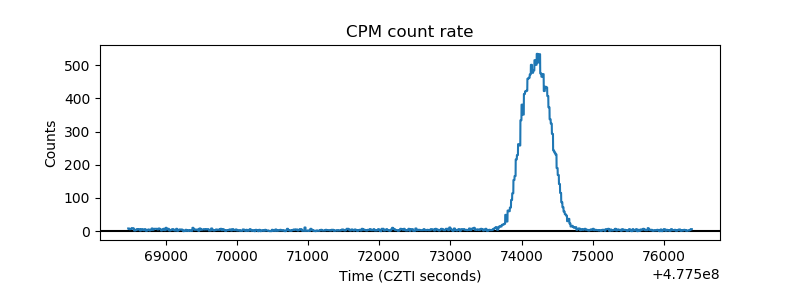 |
| CZT Counter | 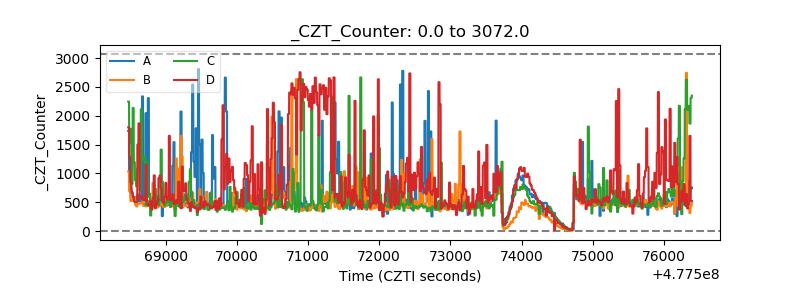 |
| +2.5 Volts monitor | 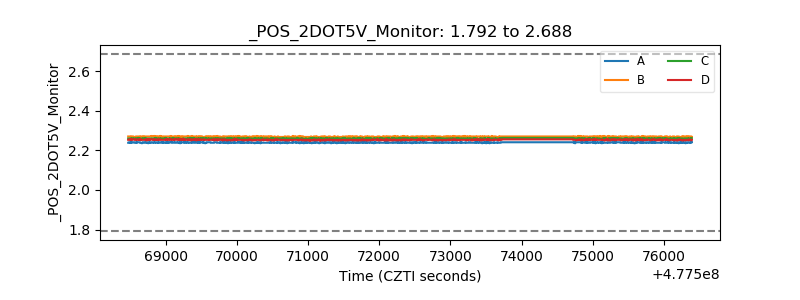 |
| +5 Volts monitor |  |
| _ROLL_ROT | 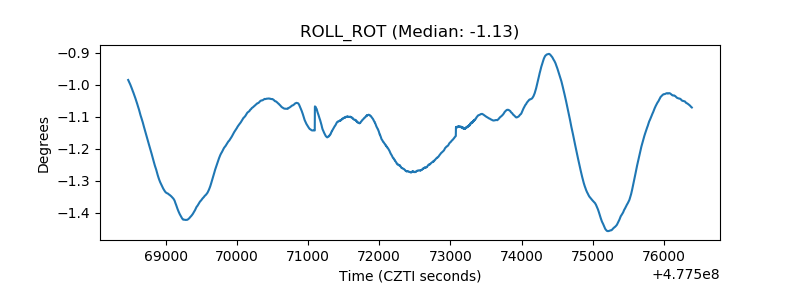 |
| _Roll_DEC | 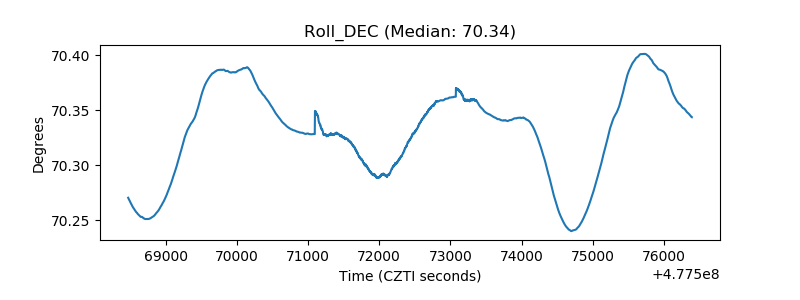 |
| _Roll_RA | 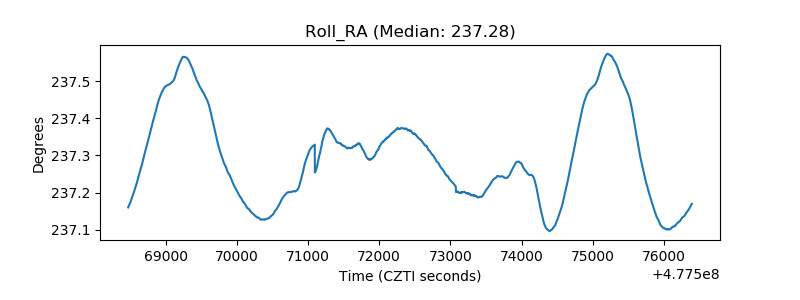 |
| Veto Counter | 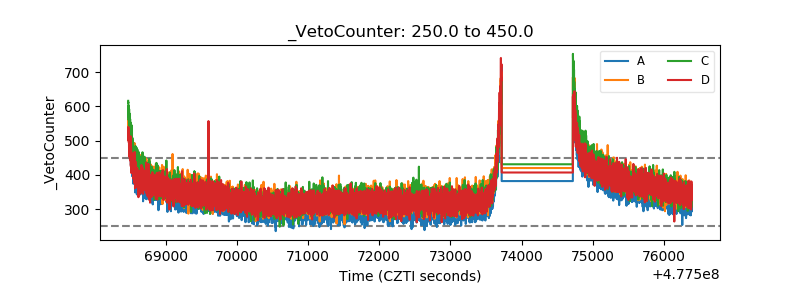 |