| Param | Original file | Final file |
|---|---|---|
| Filename | modeM0/AS1C07_001T01_9000006450_50811cztM0_level2.fits | modeM0/AS1C07_001T01_9000006450_50811cztM0_level2_quad_clean.evt |
| Size (bytes) | 479,321,280 | 86,509,440 |
| Size | 457.1 MB | 82.5 MB |
| Events in quadrant A | 4,254,664 | 571,915 |
| Events in quadrant B | 3,727,662 | 612,184 |
| Events in quadrant C | 4,811,667 | 514,528 |
| Events in quadrant D | 4,483,458 | 502,224 |
| Mode SS | |||
|---|---|---|---|
| Quadrant | BADHDUFLAG | Total packets | Discarded packets |
| A | 0 | 122 | 0 |
| B | 0 | 122 | 0 |
| C | 0 | 122 | 0 |
| D | 0 | 122 | 0 |
| Mode M0 | |||
|---|---|---|---|
| Quadrant | BADHDUFLAG | Total packets | Discarded packets |
| A | 0 | 16607 | 0 |
| B | 0 | 15265 | 0 |
| C | 0 | 18306 | 0 |
| D | 0 | 17400 | 0 |
| Mode M9 | |||
|---|---|---|---|
| Quadrant | BADHDUFLAG | Total packets | Discarded packets |
| A | 0 | 11 | 0 |
| B | 0 | 11 | 0 |
| C | 0 | 11 | 0 |
| D | 0 | 11 | 0 |
| Quadrant | Total seconds | Saturated seconds | Saturation percentage |
|---|---|---|---|
| A | 5991 | 302 | 5.040895% |
| B | 5992 | 346 | 5.774366% |
| C | 5992 | 594 | 9.913218% |
| D | 5992 | 349 | 5.824433% |
Noise dominated data is calculated using 1-second bins in cleaned event files. If a bin has >2000 counts, and if more than 50% of those come from <1% of pixels, then it is considered to be noise-dominated and hence unusable.
| Quadrant | # 1 sec bins | Bins with >0 counts | Bins with >2000 counts | High rate bins dominated by noise | Noise dominated (total time) | Noise dominated (detector-on time) | Marked lightcurve |
|---|---|---|---|---|---|---|---|
| A | 7081 | 5991 | 254 | 254 | 3.59% | 4.24% | 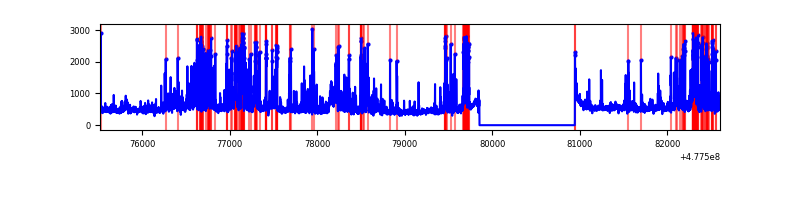 |
| B | 7081 | 5991 | 246 | 246 | 3.47% | 4.11% | 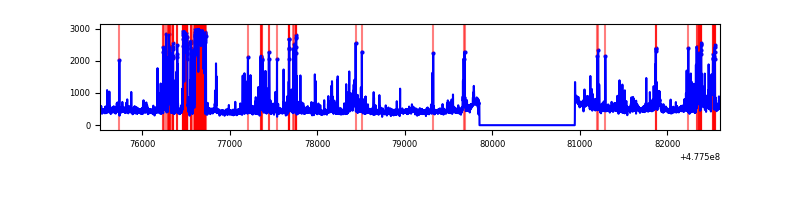 |
| C | 7082 | 5992 | 492 | 492 | 6.95% | 8.21% | 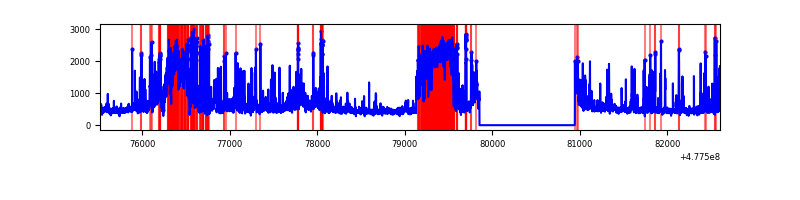 |
| D | 7082 | 5992 | 290 | 290 | 4.09% | 4.84% | 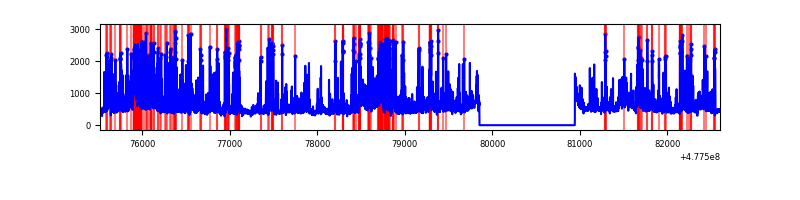 |
Top three noisy pixels from each quadrant. If the there are fewer than three noisy pixels in the level2.evt file, extra rows are filled as -1
| Pixel properties | Quadrant properties | ||||||
|---|---|---|---|---|---|---|---|
| Quadrant | DetID | PixID | Counts | Sigma | Mean | Median | Sigma |
| A | 6 | 161 | 793069 | 5037.95 | 639 | 625 | 157.3 |
| A | 4 | 3 | 132968 | 841.37 | 639 | 625 | 157.3 |
| A | 9 | 13 | 126487 | 800.16 | 639 | 625 | 157.3 |
| B | 8 | 128 | 807792 | 6016.77 | 630 | 608 | 134.2 |
| B | 0 | 216 | 77537 | 573.43 | 630 | 608 | 134.2 |
| B | 4 | 206 | 51576 | 379.92 | 630 | 608 | 134.2 |
| C | 15 | 158 | 780832 | 4661.32 | 610 | 602 | 167.4 |
| C | 5 | 10 | 670514 | 4002.25 | 610 | 602 | 167.4 |
| C | 13 | 3 | 198665 | 1183.29 | 610 | 602 | 167.4 |
| D | 15 | 108 | 377869 | 2159.64 | 617 | 594 | 174.7 |
| D | 2 | 216 | 333493 | 1905.62 | 617 | 594 | 174.7 |
| D | 2 | 249 | 295017 | 1685.37 | 617 | 594 | 174.7 |
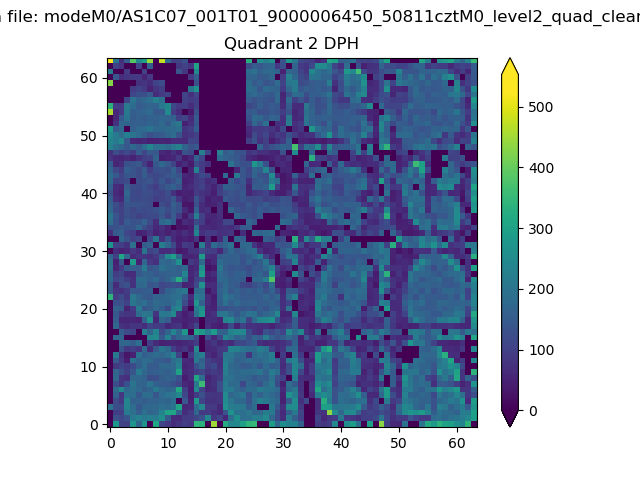
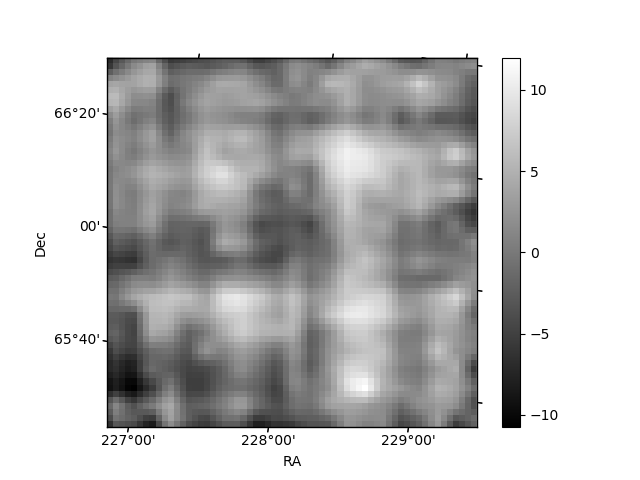
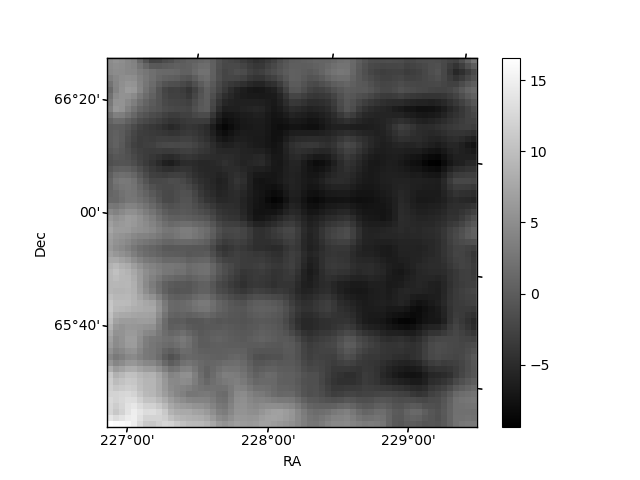
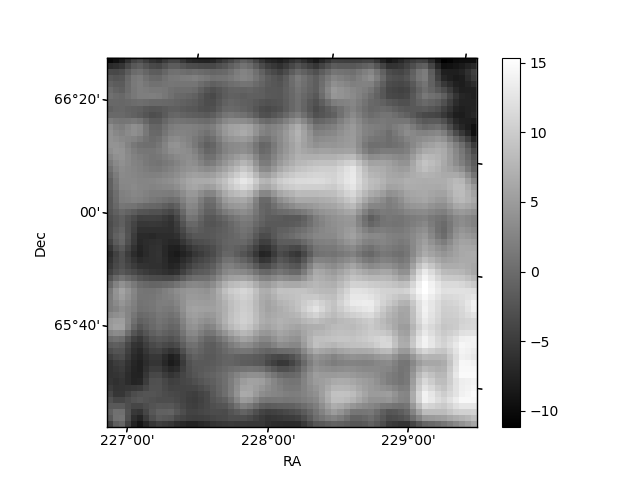
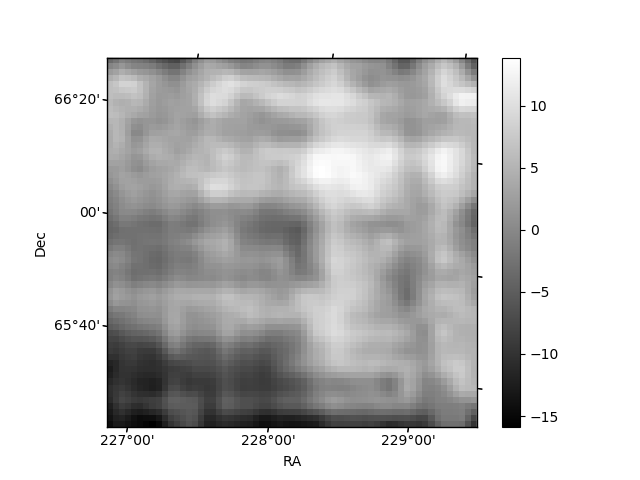
Histogram calculated using DETX and DETY for each event in the final _common_clean file
| Quadrant A | 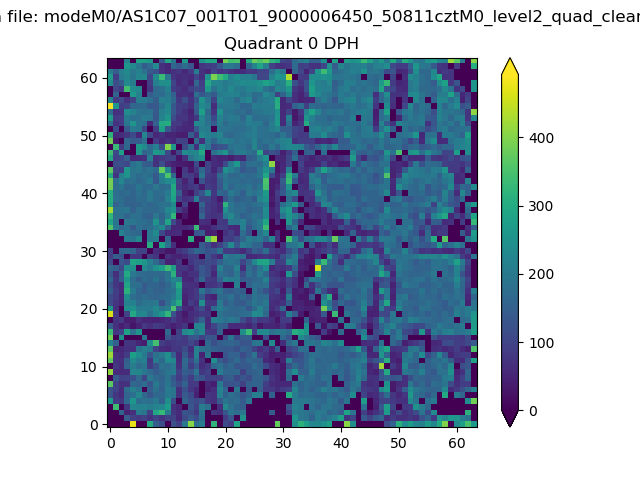 |
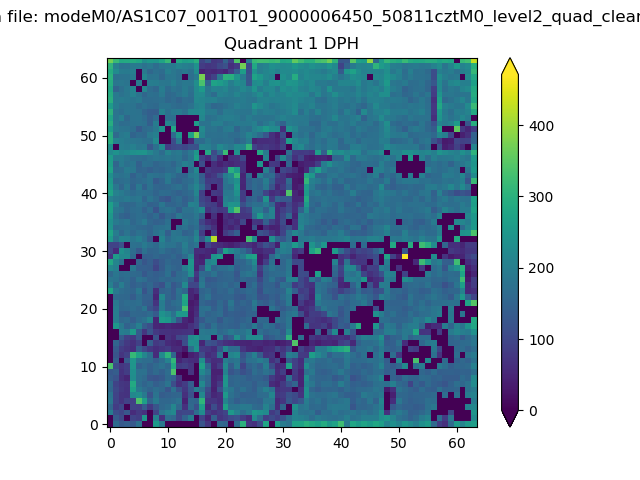 |
Quadrant B |
|---|---|---|---|
| Quadrant D | 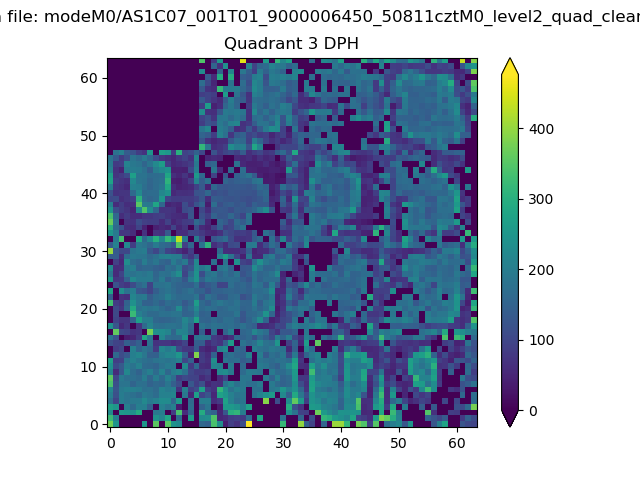 |
 |
Quadrant C |
| Plot type | Count rate plots | Images |
|---|---|---|
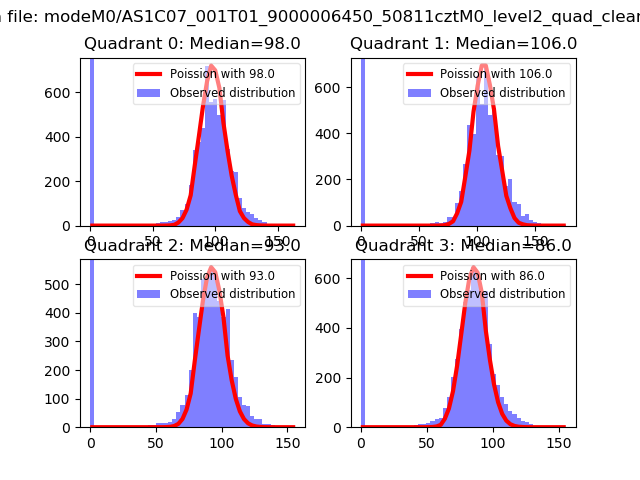
| Comparison with Poisson distribution Blue bars denote a histogram of data divided into 1 sec bins. Red curve is a Poisson curve with rate = median count rate of data. |
 |
 |
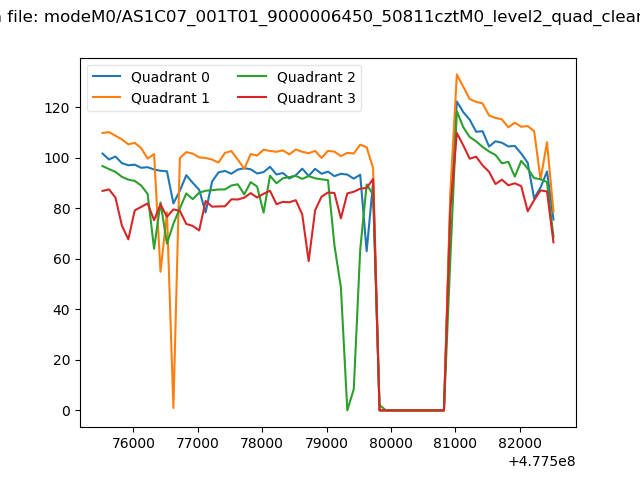
| Quadrant-wise count rates Data is divided into 100 sec bins |
 |
|
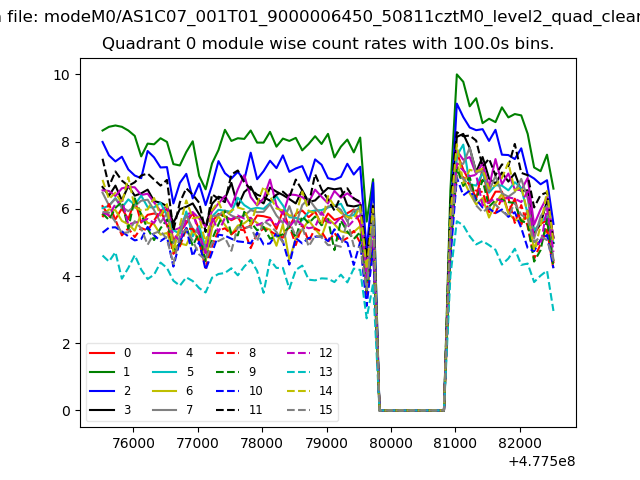
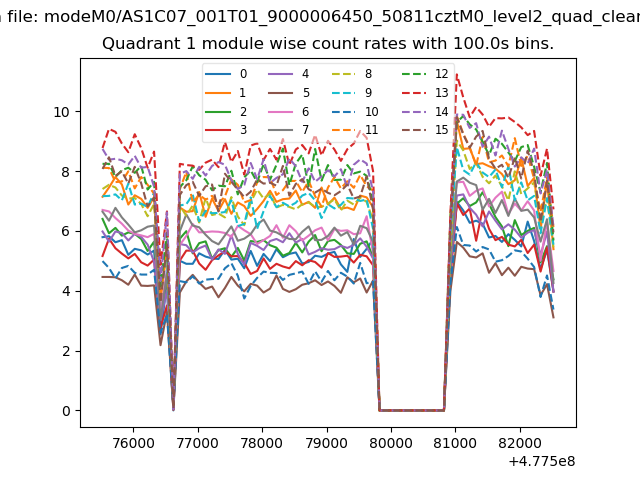
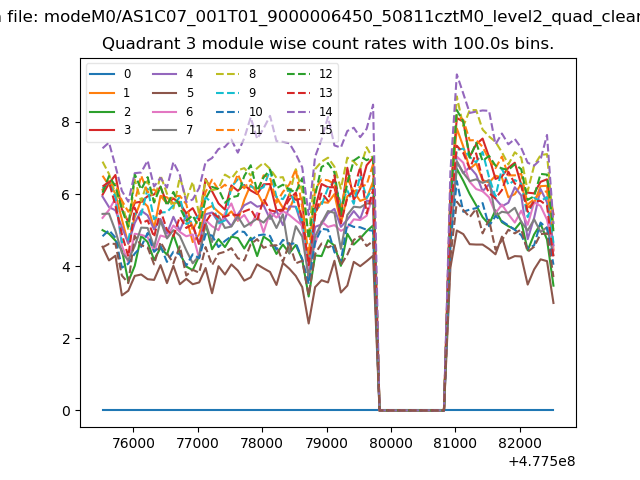
| Module-wise count rates for Quadrant A Data is divided into 100 sec bins |
 |
 |
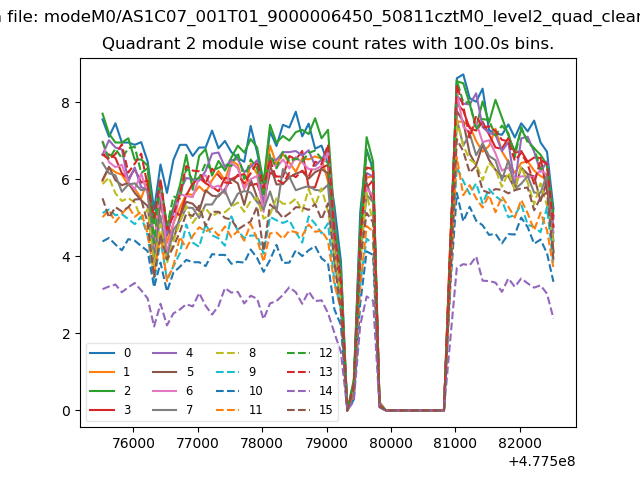
| Module-wise count rates for Quadrant B Data is divided into 100 sec bins |
 |
 |
| Module-wise count rates for Quadrant C Data is divided into 100 sec bins |
 |
 |
| Module-wise count rates for Quadrant D Data is divided into 100 sec bins |
 |
 |
| Parameter | Plot |
|---|---|
| CZT HV Monitor | 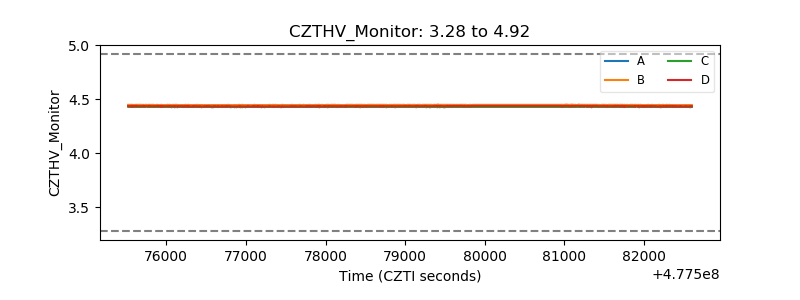 |
| D_VDD | 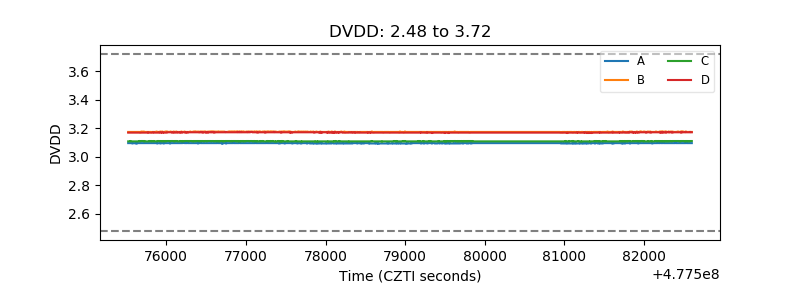 |
| Temperature 1 | 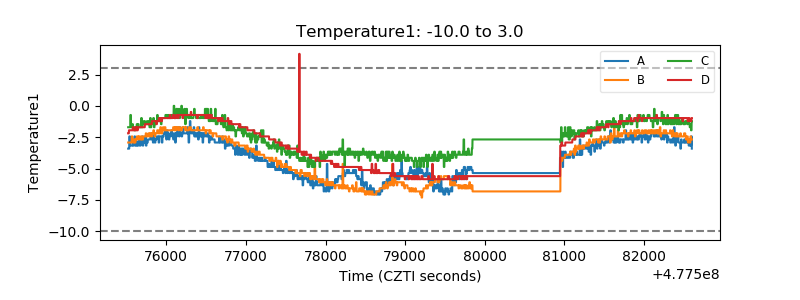 |
| Veto HV Monitor | 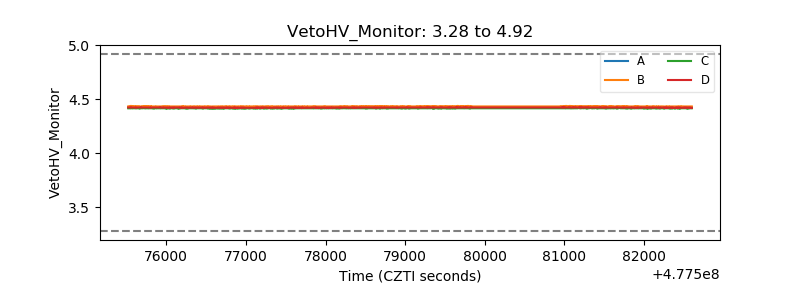 |
| Veto LLD | 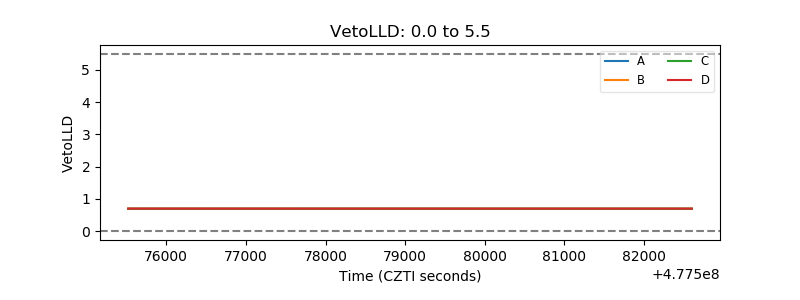 |
| Alpha Counter | 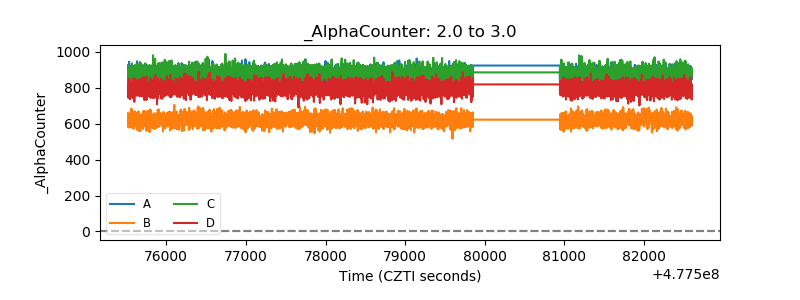 |
| _CPM_Rate | 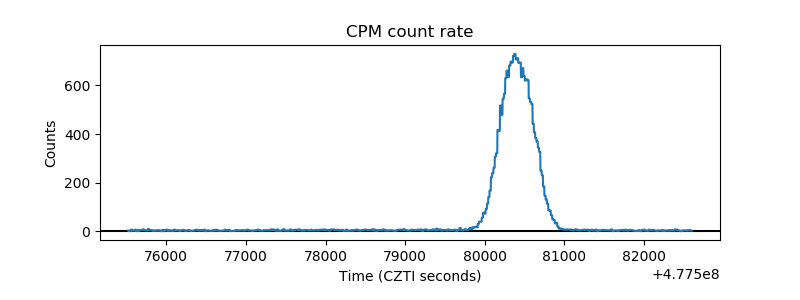 |
| CZT Counter | 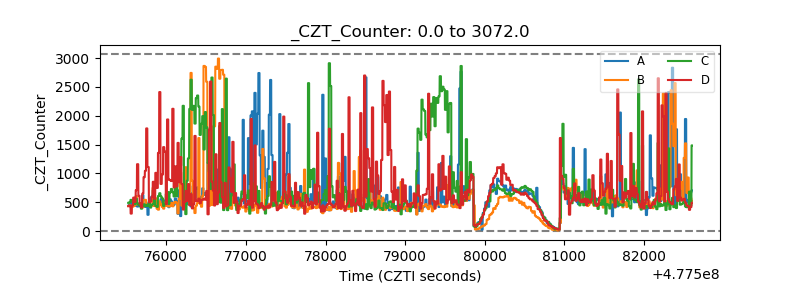 |
| +2.5 Volts monitor |  |
| +5 Volts monitor | 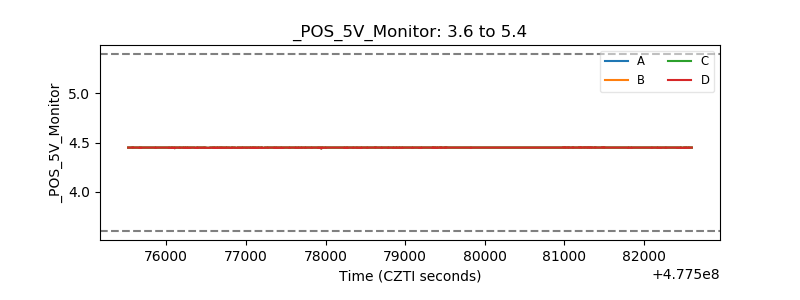 |
| _ROLL_ROT | 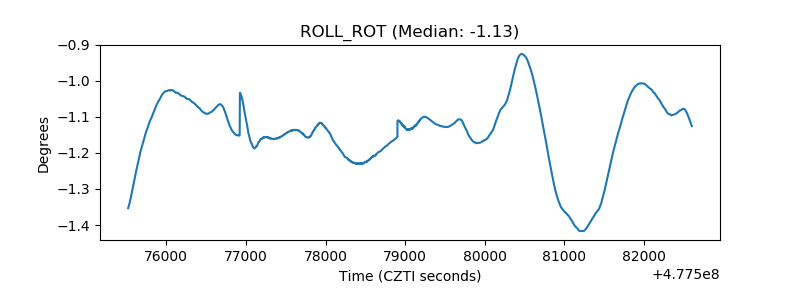 |
| _Roll_DEC | 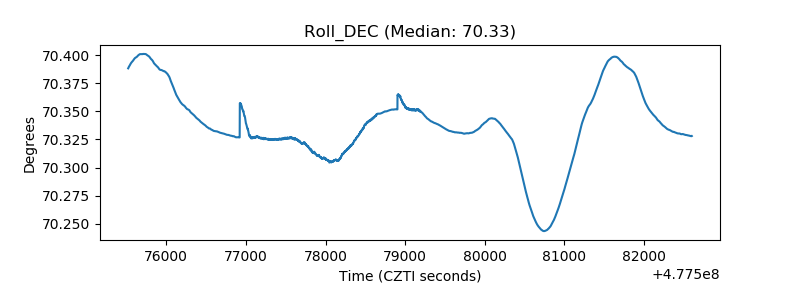 |
| _Roll_RA | 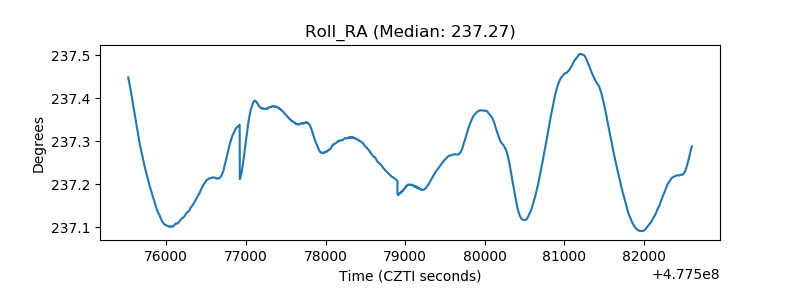 |
| Veto Counter | 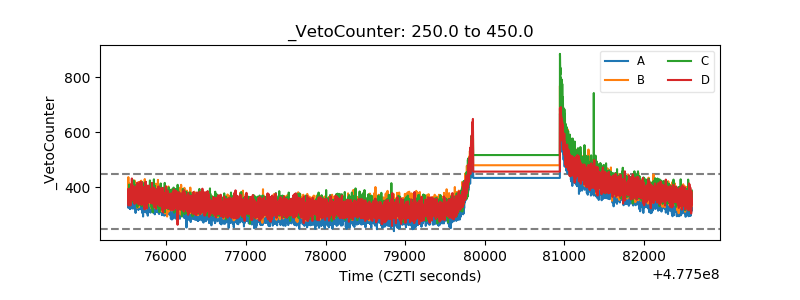 |