| Param | Original file | Final file |
|---|---|---|
| Filename | modeM0/AS1C07_001T01_9000006450_50812cztM0_level2.fits | modeM0/AS1C07_001T01_9000006450_50812cztM0_level2_quad_clean.evt |
| Size (bytes) | 472,639,680 | 86,705,280 |
| Size | 450.7 MB | 82.7 MB |
| Events in quadrant A | 4,428,275 | 560,074 |
| Events in quadrant B | 4,286,243 | 597,851 |
| Events in quadrant C | 3,694,224 | 551,460 |
| Events in quadrant D | 4,626,886 | 502,649 |
| Mode SS | |||
|---|---|---|---|
| Quadrant | BADHDUFLAG | Total packets | Discarded packets |
| A | 0 | 120 | 0 |
| B | 0 | 120 | 0 |
| C | 0 | 120 | 0 |
| D | 0 | 120 | 0 |
| Mode M0 | |||
|---|---|---|---|
| Quadrant | BADHDUFLAG | Total packets | Discarded packets |
| A | 0 | 17087 | 1 |
| B | 0 | 16774 | 4 |
| C | 0 | 15099 | 1 |
| D | 0 | 17844 | 1 |
| Mode M9 | |||
|---|---|---|---|
| Quadrant | BADHDUFLAG | Total packets | Discarded packets |
| A | 0 | 12 | 0 |
| B | 0 | 12 | 0 |
| C | 0 | 12 | 0 |
| D | 0 | 12 | 0 |
| Quadrant | Total seconds | Saturated seconds | Saturation percentage |
|---|---|---|---|
| A | 5919 | 471 | 7.957425% |
| B | 5919 | 540 | 9.123163% |
| C | 5919 | 195 | 3.294475% |
| D | 5919 | 364 | 6.149687% |
Noise dominated data is calculated using 1-second bins in cleaned event files. If a bin has >2000 counts, and if more than 50% of those come from <1% of pixels, then it is considered to be noise-dominated and hence unusable.
| Quadrant | # 1 sec bins | Bins with >0 counts | Bins with >2000 counts | High rate bins dominated by noise | Noise dominated (total time) | Noise dominated (detector-on time) | Marked lightcurve |
|---|---|---|---|---|---|---|---|
| A | 7078 | 5919 | 527 | 527 | 7.45% | 8.90% | 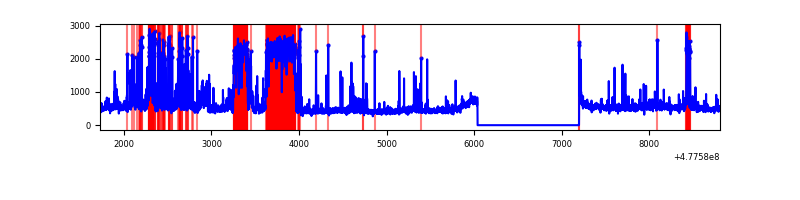 |
| B | 7078 | 5919 | 352 | 352 | 4.97% | 5.95% | 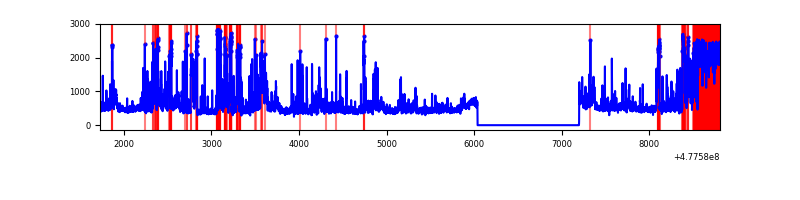 |
| C | 7078 | 5919 | 135 | 135 | 1.91% | 2.28% | 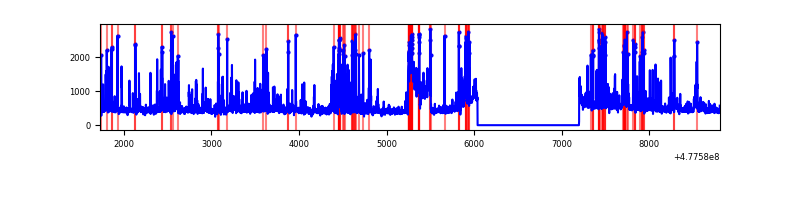 |
| D | 7078 | 5919 | 309 | 309 | 4.37% | 5.22% | 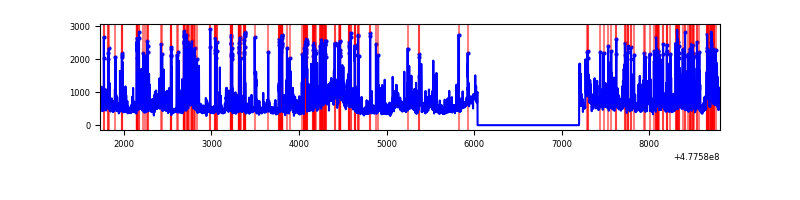 |
Top three noisy pixels from each quadrant. If the there are fewer than three noisy pixels in the level2.evt file, extra rows are filled as -1
| Pixel properties | Quadrant properties | ||||||
|---|---|---|---|---|---|---|---|
| Quadrant | DetID | PixID | Counts | Sigma | Mean | Median | Sigma |
| A | 12 | 80 | 941513 | 5953.35 | 636 | 621 | 158.0 |
| A | 6 | 161 | 414764 | 2620.43 | 636 | 621 | 158.0 |
| A | 4 | 3 | 125153 | 787.96 | 636 | 621 | 158.0 |
| B | 8 | 128 | 1149687 | 8778.83 | 624 | 604 | 130.9 |
| B | 4 | 206 | 394803 | 3011.62 | 624 | 604 | 130.9 |
| B | 0 | 171 | 46796 | 352.9 | 624 | 604 | 130.9 |
| C | 13 | 3 | 410546 | 2423.37 | 624 | 618 | 169.2 |
| C | 1 | 60 | 311749 | 1839.31 | 624 | 618 | 169.2 |
| C | 3 | 233 | 75086 | 440.23 | 624 | 618 | 169.2 |
| D | 2 | 216 | 655396 | 3836.14 | 613 | 592 | 170.7 |
| D | 2 | 249 | 395897 | 2315.88 | 613 | 592 | 170.7 |
| D | 8 | 176 | 248506 | 1452.39 | 613 | 592 | 170.7 |
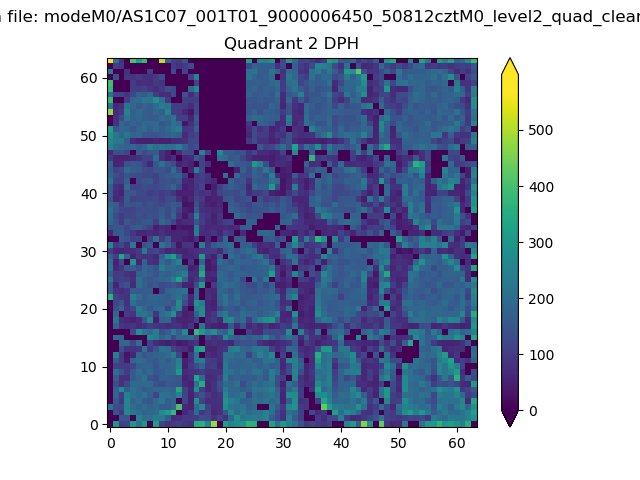
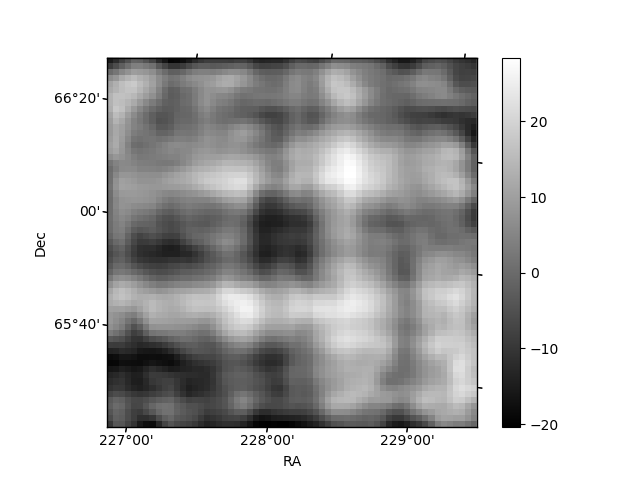
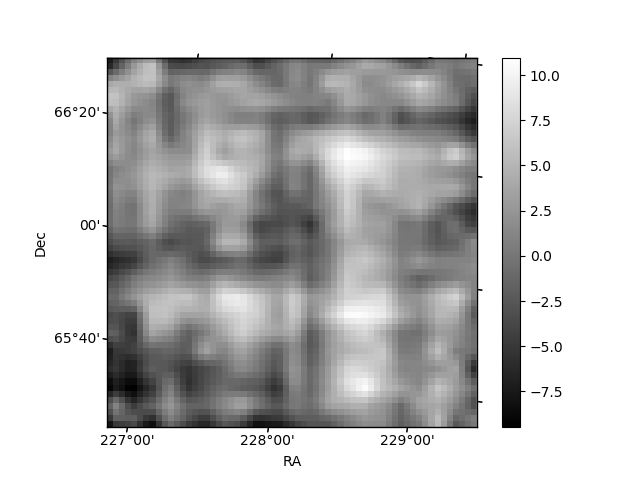
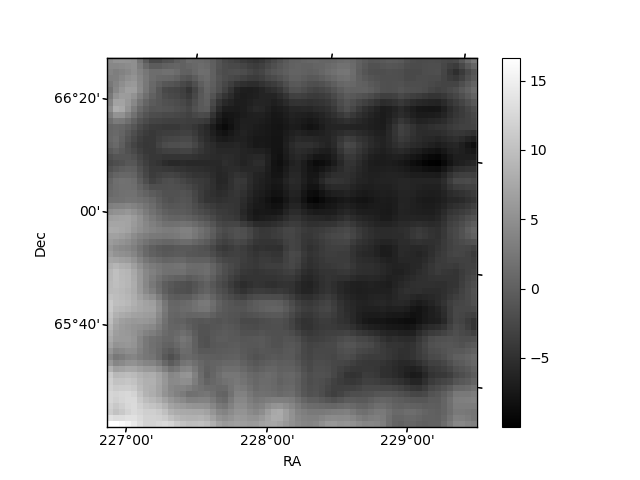
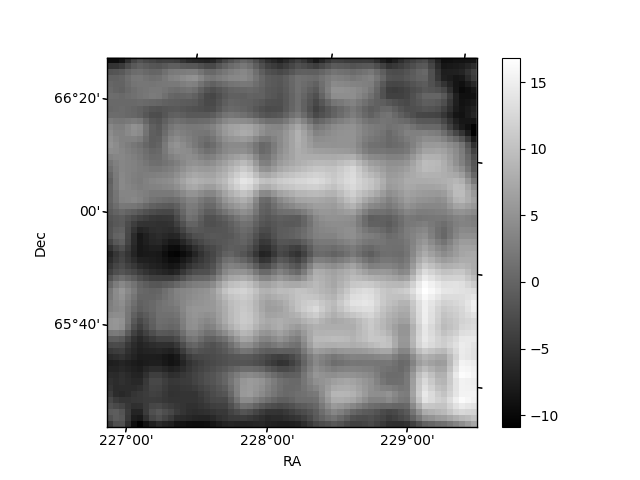
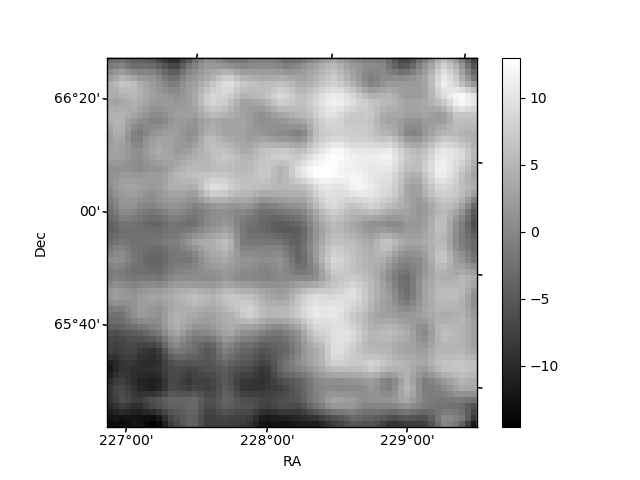
Histogram calculated using DETX and DETY for each event in the final _common_clean file
| Quadrant A | 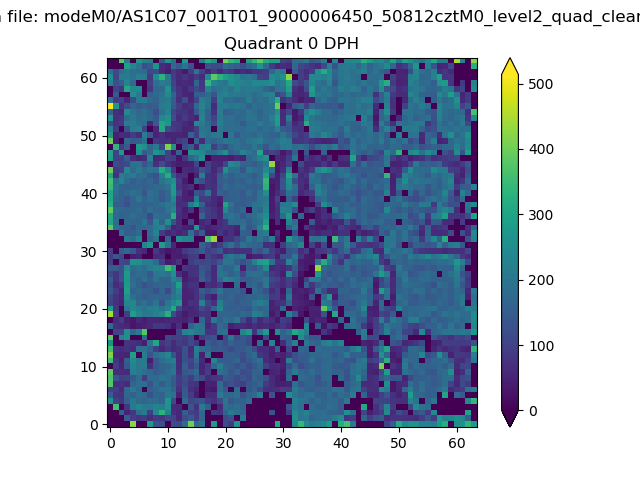 |
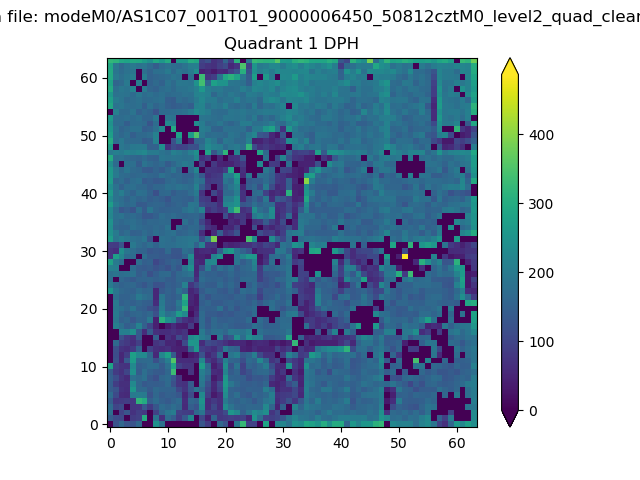 |
Quadrant B |
|---|---|---|---|
| Quadrant D | 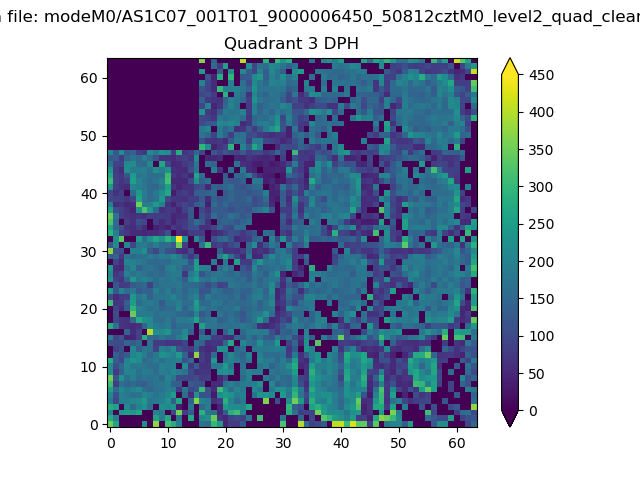 |
 |
Quadrant C |
| Plot type | Count rate plots | Images |
|---|---|---|
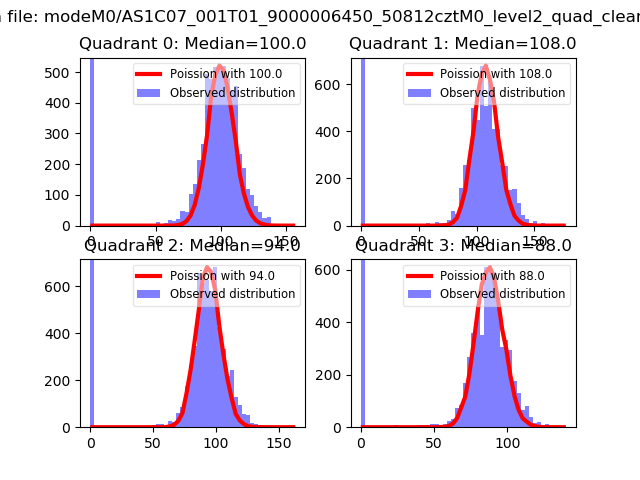
| Comparison with Poisson distribution Blue bars denote a histogram of data divided into 1 sec bins. Red curve is a Poisson curve with rate = median count rate of data. |
 |
 |
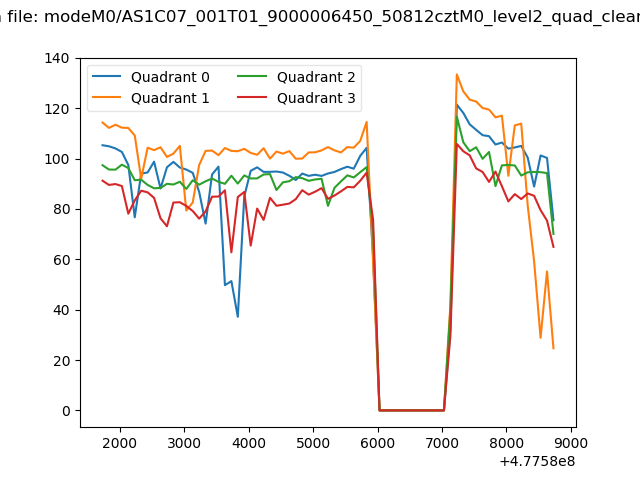
| Quadrant-wise count rates Data is divided into 100 sec bins |
 |
|
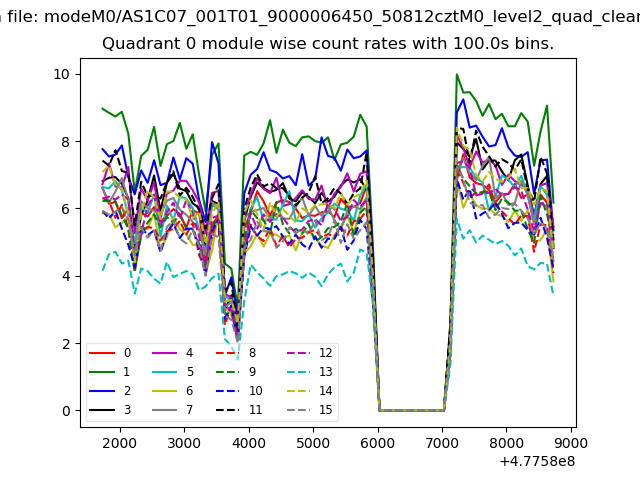
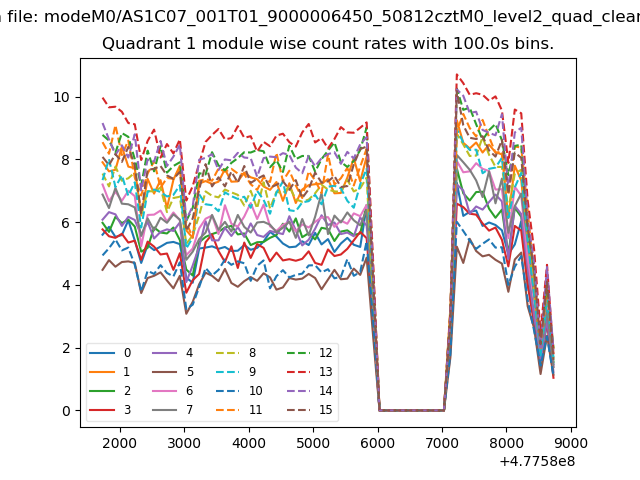
| Module-wise count rates for Quadrant A Data is divided into 100 sec bins |
 |
 |
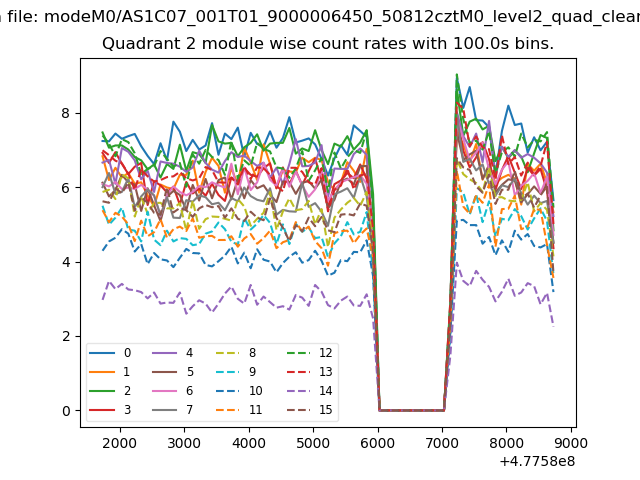
| Module-wise count rates for Quadrant B Data is divided into 100 sec bins |
 |
 |
| Module-wise count rates for Quadrant C Data is divided into 100 sec bins |
 |
 |
| Module-wise count rates for Quadrant D Data is divided into 100 sec bins |
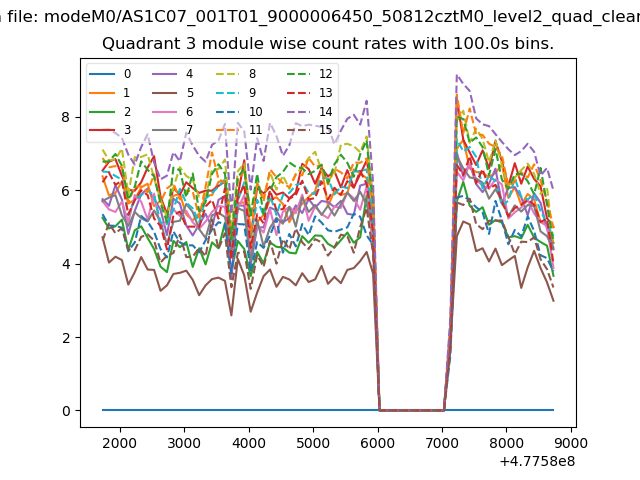 |
 |
| Parameter | Plot |
|---|---|
| CZT HV Monitor | 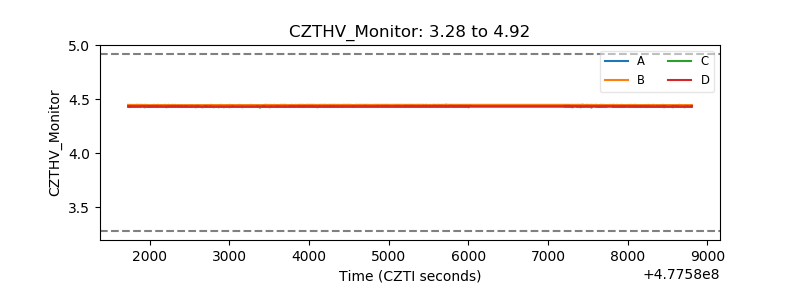 |
| D_VDD | 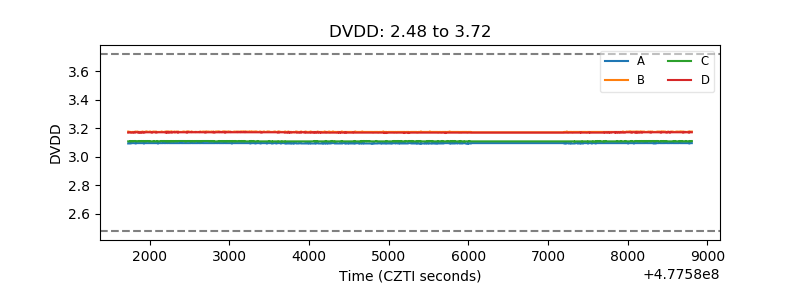 |
| Temperature 1 | 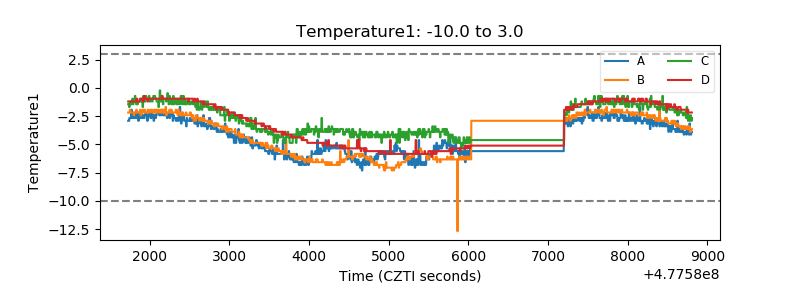 |
| Veto HV Monitor | 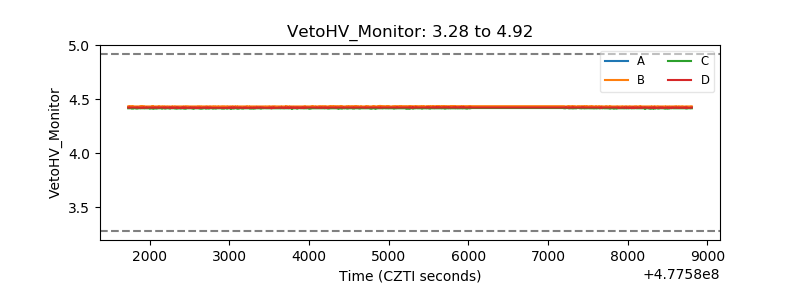 |
| Veto LLD | 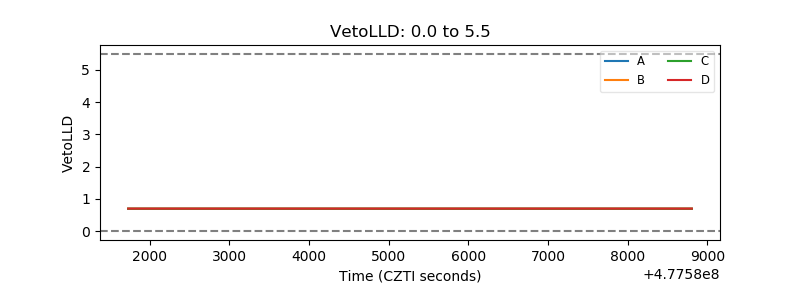 |
| Alpha Counter | 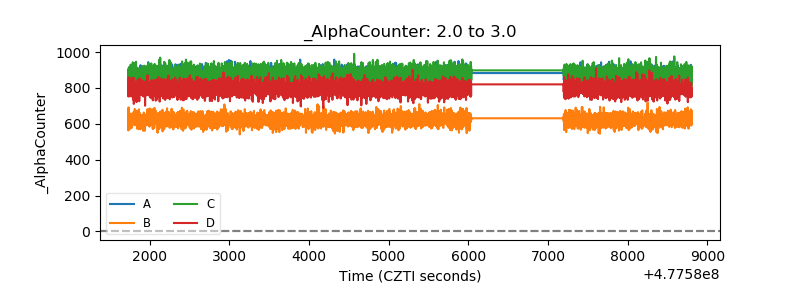 |
| _CPM_Rate | 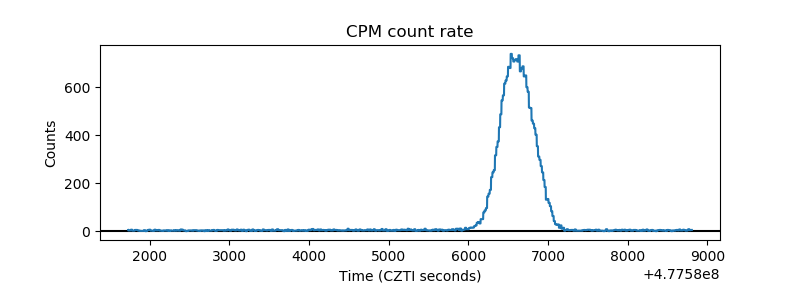 |
| CZT Counter | 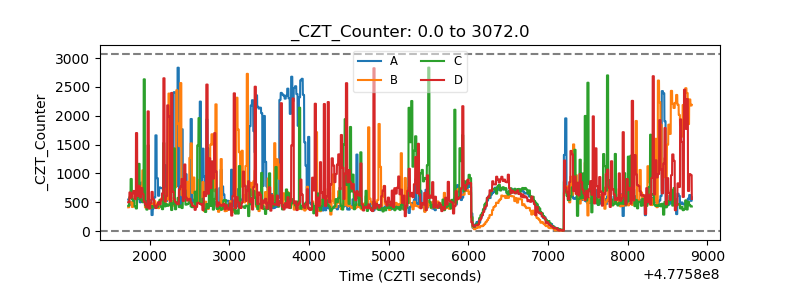 |
| +2.5 Volts monitor | 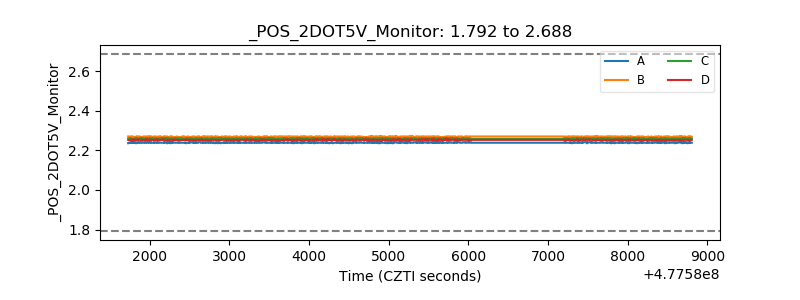 |
| +5 Volts monitor | 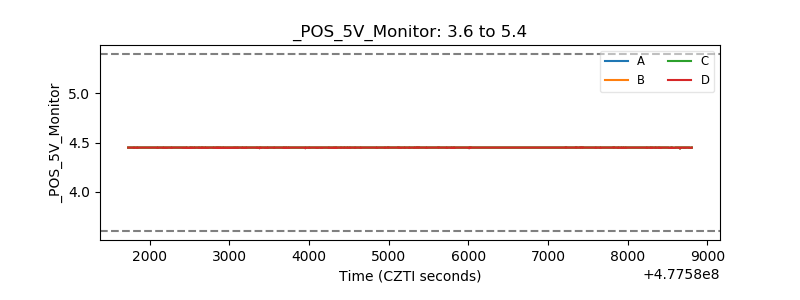 |
| _ROLL_ROT | 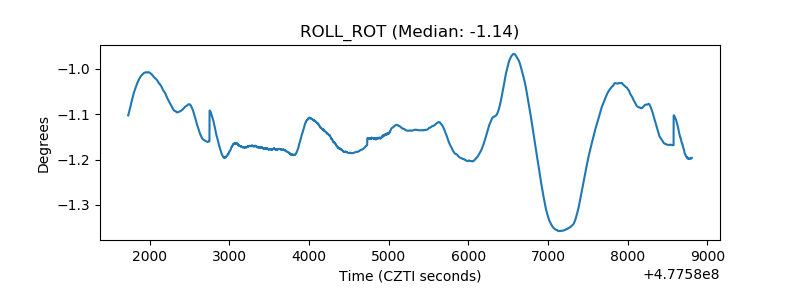 |
| _Roll_DEC | 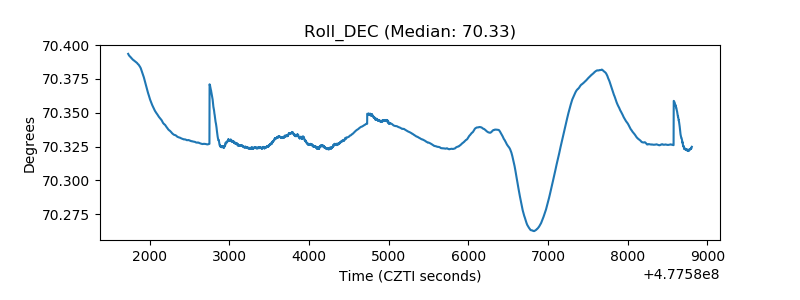 |
| _Roll_RA | 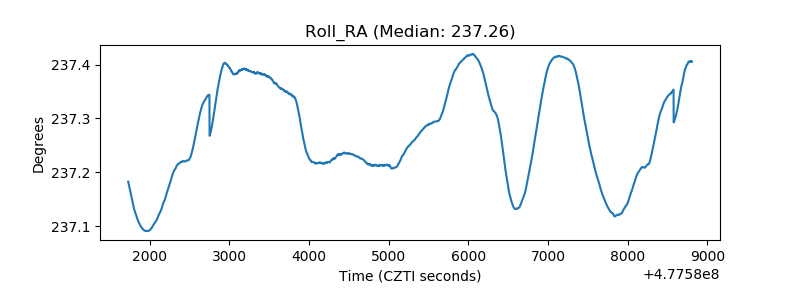 |
| Veto Counter | 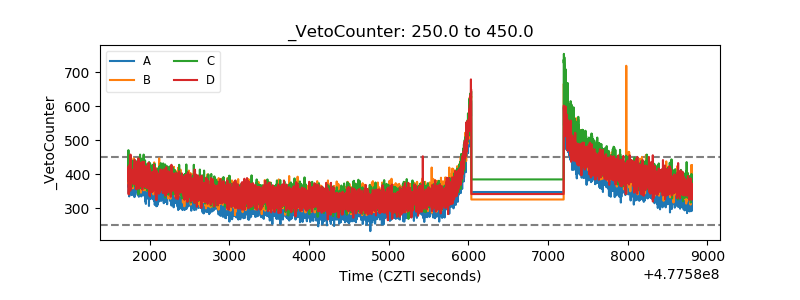 |