| Param | Original file | Final file |
|---|---|---|
| Filename | modeM0/AS1C07_001T01_9000006450_50814cztM0_level2.fits | modeM0/AS1C07_001T01_9000006450_50814cztM0_level2_quad_clean.evt |
| Size (bytes) | 580,847,040 | 93,355,200 |
| Size | 553.9 MB | 89.0 MB |
| Events in quadrant A | 5,994,580 | 568,276 |
| Events in quadrant B | 5,559,981 | 641,588 |
| Events in quadrant C | 4,177,577 | 605,407 |
| Events in quadrant D | 5,260,954 | 554,164 |
| Mode SS | |||
|---|---|---|---|
| Quadrant | BADHDUFLAG | Total packets | Discarded packets |
| A | 0 | 134 | 0 |
| B | 0 | 134 | 0 |
| C | 0 | 134 | 0 |
| D | 0 | 134 | 0 |
| Mode M0 | |||
|---|---|---|---|
| Quadrant | BADHDUFLAG | Total packets | Discarded packets |
| A | 0 | 22325 | 2 |
| B | 0 | 20997 | 2 |
| C | 0 | 16927 | 2 |
| D | 0 | 20071 | 2 |
| Mode M9 | |||
|---|---|---|---|
| Quadrant | BADHDUFLAG | Total packets | Discarded packets |
| A | 0 | 10 | 0 |
| B | 0 | 10 | 0 |
| C | 0 | 10 | 0 |
| D | 0 | 10 | 0 |
| Quadrant | Total seconds | Saturated seconds | Saturation percentage |
|---|---|---|---|
| A | 6553 | 923 | 14.085152% |
| B | 6554 | 715 | 10.909368% |
| C | 6553 | 161 | 2.456890% |
| D | 6553 | 387 | 5.905692% |
Noise dominated data is calculated using 1-second bins in cleaned event files. If a bin has >2000 counts, and if more than 50% of those come from <1% of pixels, then it is considered to be noise-dominated and hence unusable.
| Quadrant | # 1 sec bins | Bins with >0 counts | Bins with >2000 counts | High rate bins dominated by noise | Noise dominated (total time) | Noise dominated (detector-on time) | Marked lightcurve |
|---|---|---|---|---|---|---|---|
| A | 7603 | 6554 | 790 | 790 | 10.39% | 12.05% | 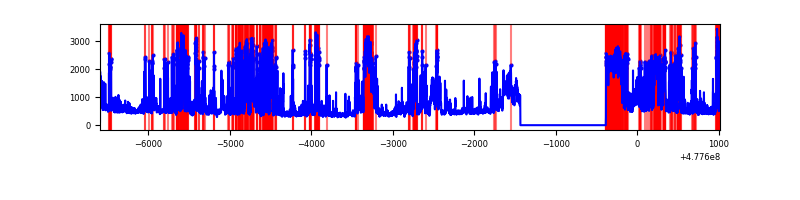 |
| B | 7604 | 6555 | 550 | 550 | 7.23% | 8.39% | 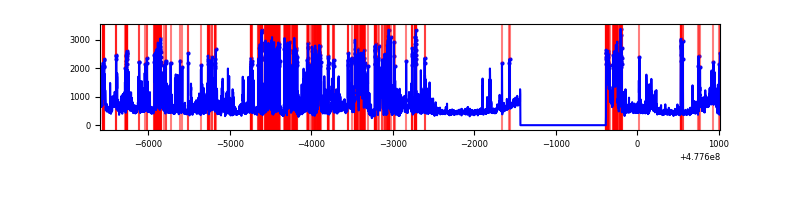 |
| C | 7603 | 6554 | 109 | 109 | 1.43% | 1.66% | 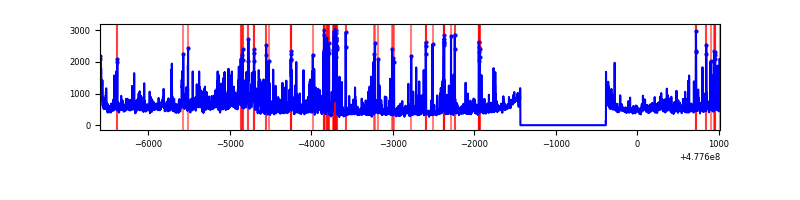 |
| D | 7603 | 6554 | 314 | 314 | 4.13% | 4.79% | 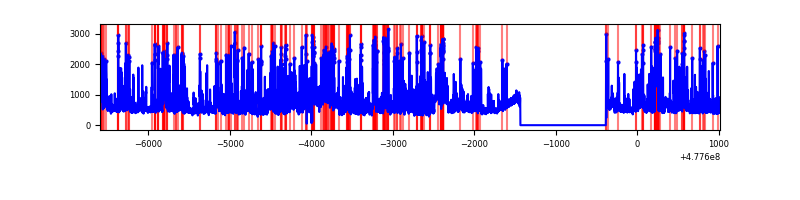 |
Top three noisy pixels from each quadrant. If the there are fewer than three noisy pixels in the level2.evt file, extra rows are filled as -1
| Pixel properties | Quadrant properties | ||||||
|---|---|---|---|---|---|---|---|
| Quadrant | DetID | PixID | Counts | Sigma | Mean | Median | Sigma |
| A | 14 | 254 | 1307862 | 7946.55 | 669 | 654 | 164.5 |
| A | 12 | 80 | 1020938 | 6202.33 | 669 | 654 | 164.5 |
| A | 4 | 191 | 348011 | 2111.59 | 669 | 654 | 164.5 |
| B | 4 | 206 | 1097921 | 7622.95 | 679 | 655 | 143.9 |
| B | 5 | 79 | 1022181 | 7096.77 | 679 | 655 | 143.9 |
| B | 8 | 128 | 241479 | 1673.06 | 679 | 655 | 143.9 |
| C | 10 | 171 | 289749 | 1519.66 | 697 | 689 | 190.2 |
| C | 1 | 60 | 232579 | 1219.1 | 697 | 689 | 190.2 |
| C | 9 | 38 | 171698 | 899.04 | 697 | 689 | 190.2 |
| D | 2 | 249 | 396997 | 2098.14 | 678 | 653 | 188.9 |
| D | 15 | 123 | 308562 | 1629.99 | 678 | 653 | 188.9 |
| D | 2 | 216 | 270151 | 1426.65 | 678 | 653 | 188.9 |
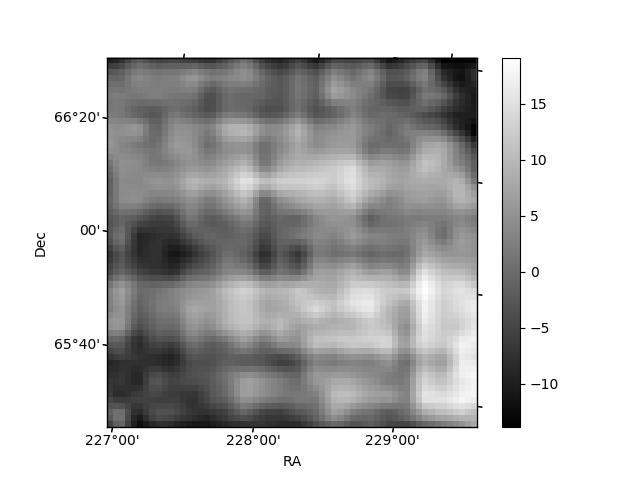
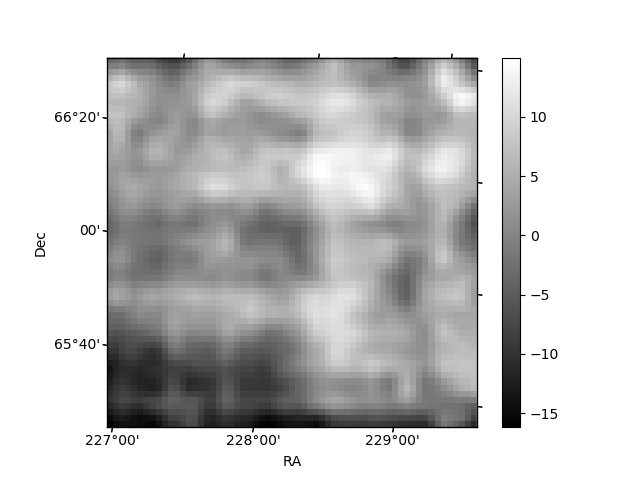
Histogram calculated using DETX and DETY for each event in the final _common_clean file
| Quadrant A | 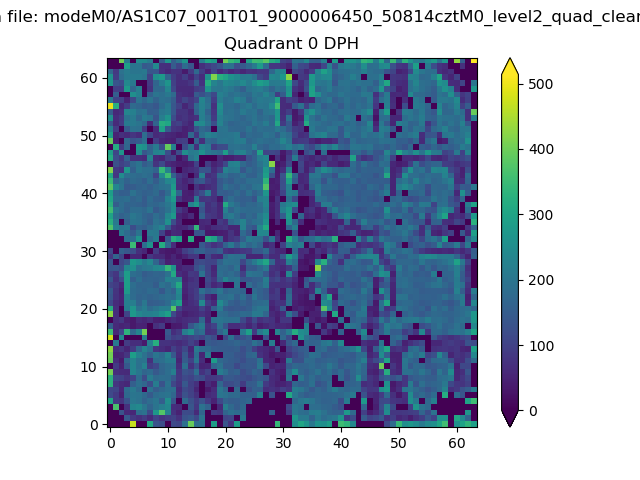 |
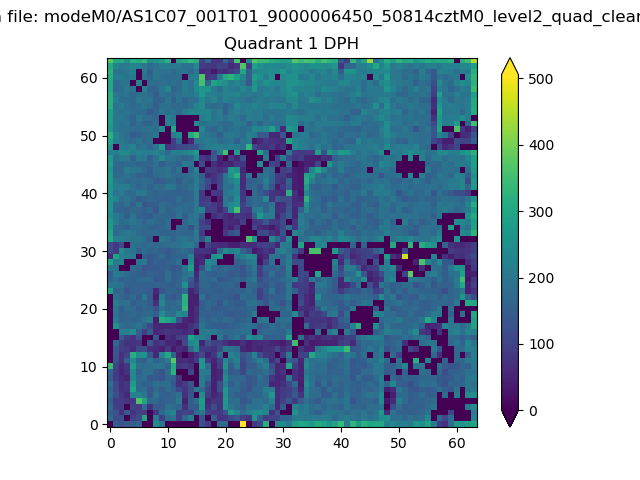 |
Quadrant B |
|---|---|---|---|
| Quadrant D | 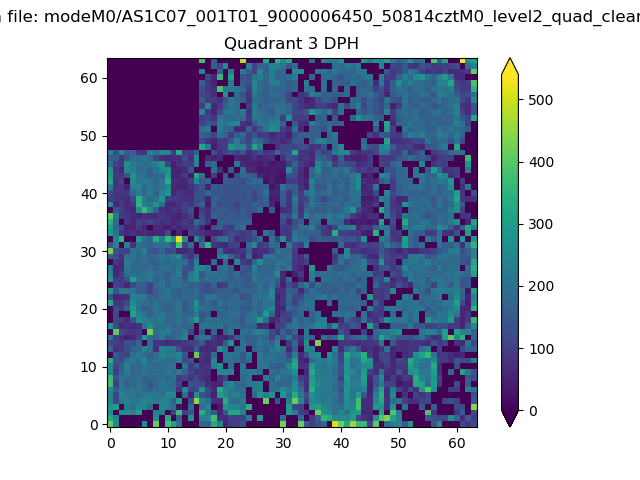 |
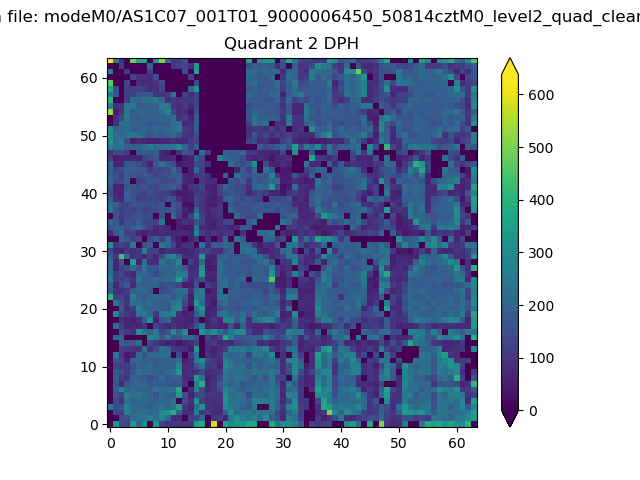 |
Quadrant C |
| Plot type | Count rate plots | Images |
|---|---|---|
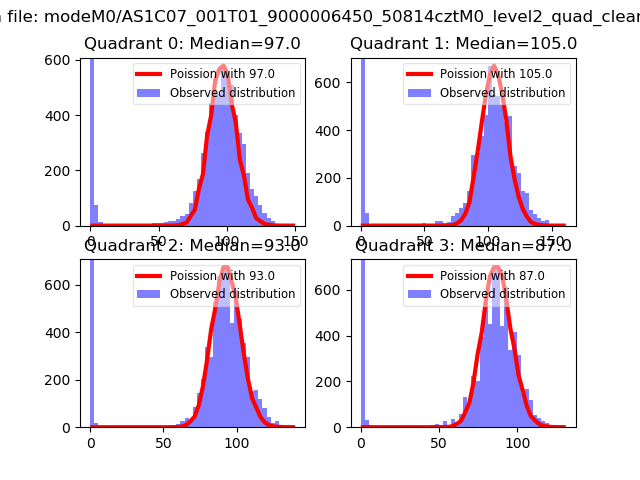
| Comparison with Poisson distribution Blue bars denote a histogram of data divided into 1 sec bins. Red curve is a Poisson curve with rate = median count rate of data. |
 |
 |
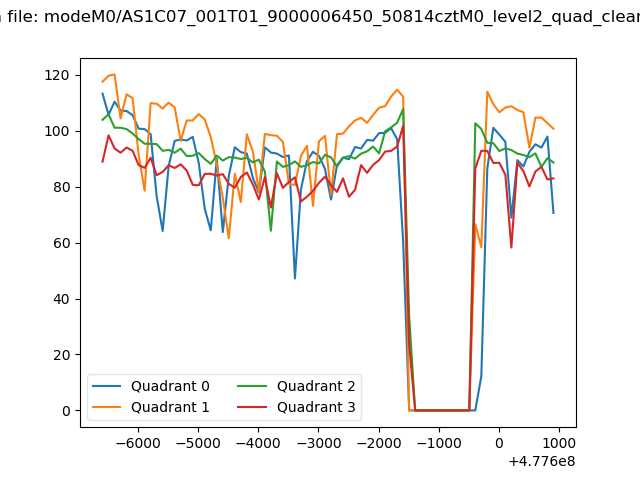
| Quadrant-wise count rates Data is divided into 100 sec bins |
 |
|
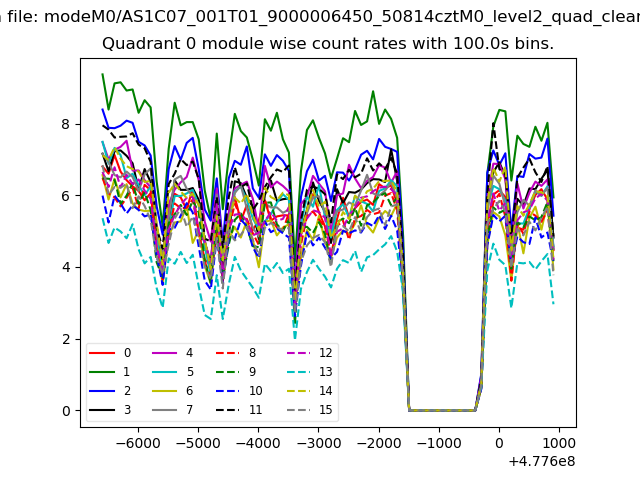
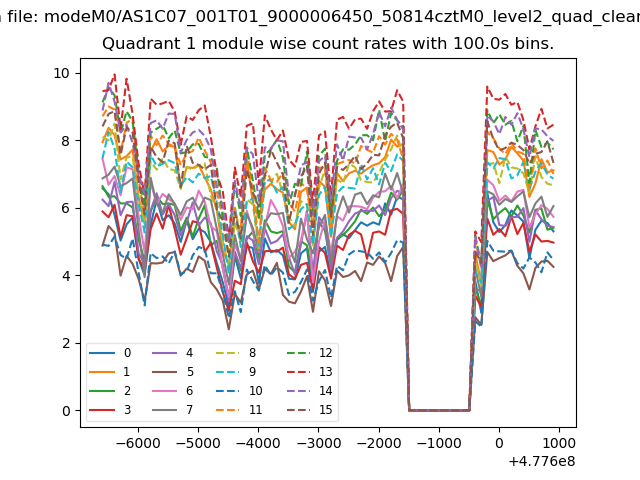
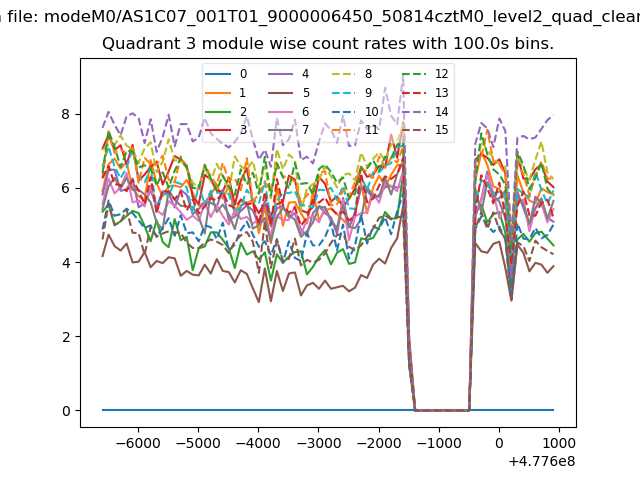
| Module-wise count rates for Quadrant A Data is divided into 100 sec bins |
 |
 |
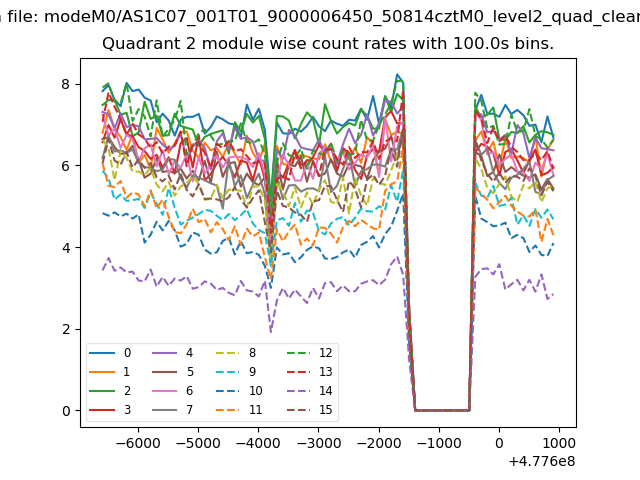
| Module-wise count rates for Quadrant B Data is divided into 100 sec bins |
 |
 |
| Module-wise count rates for Quadrant C Data is divided into 100 sec bins |
 |
 |
| Module-wise count rates for Quadrant D Data is divided into 100 sec bins |
 |
 |
| Parameter | Plot |
|---|---|
| CZT HV Monitor | 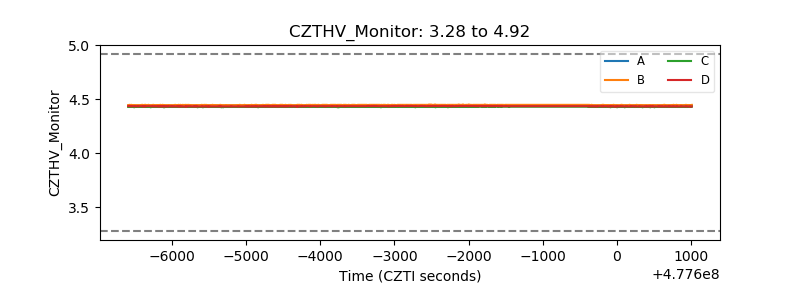 |
| D_VDD | 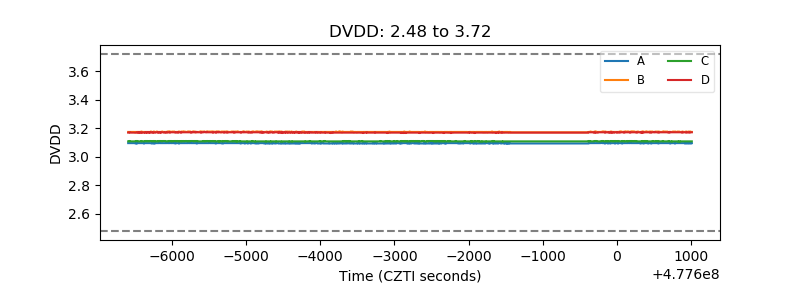 |
| Temperature 1 | 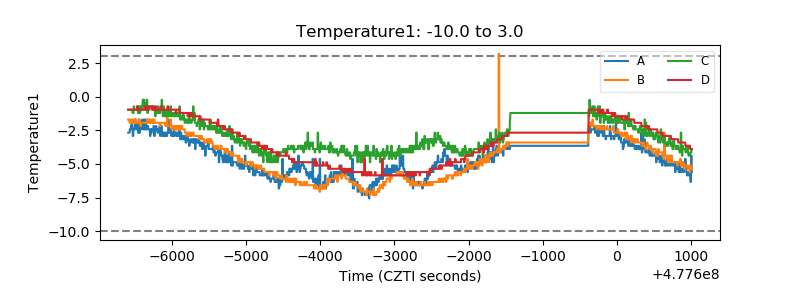 |
| Veto HV Monitor | 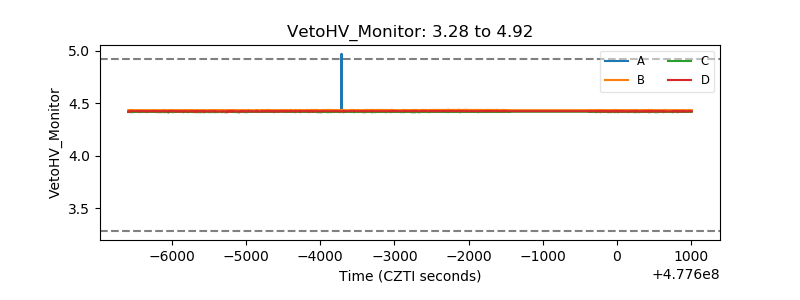 |
| Veto LLD | 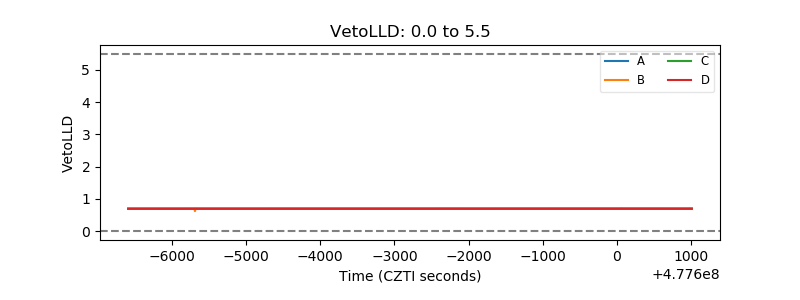 |
| Alpha Counter | 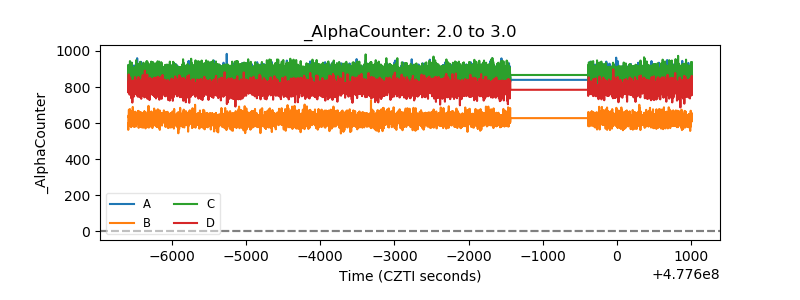 |
| _CPM_Rate | 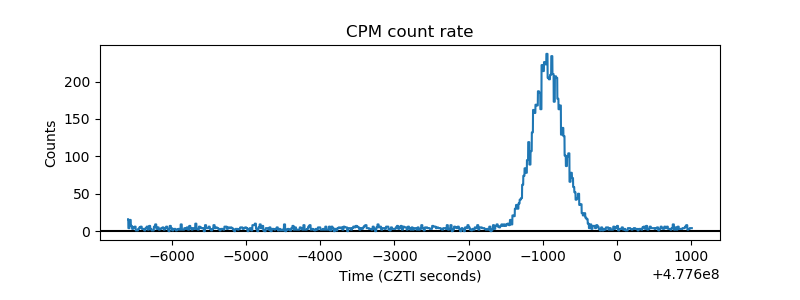 |
| CZT Counter | 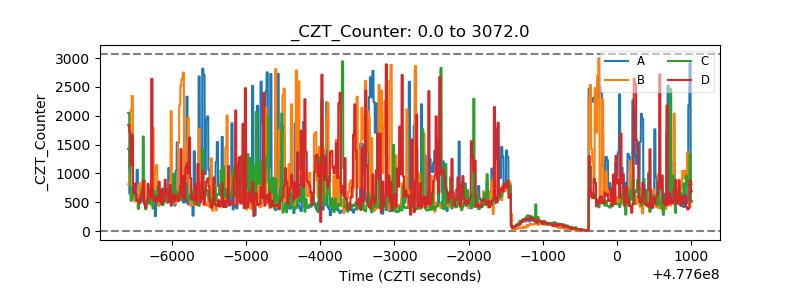 |
| +2.5 Volts monitor |  |
| +5 Volts monitor | 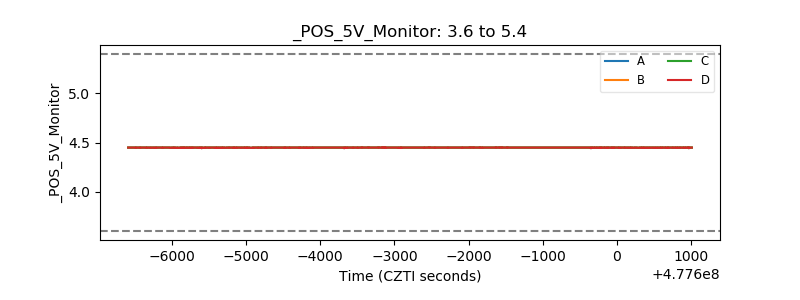 |
| _ROLL_ROT | 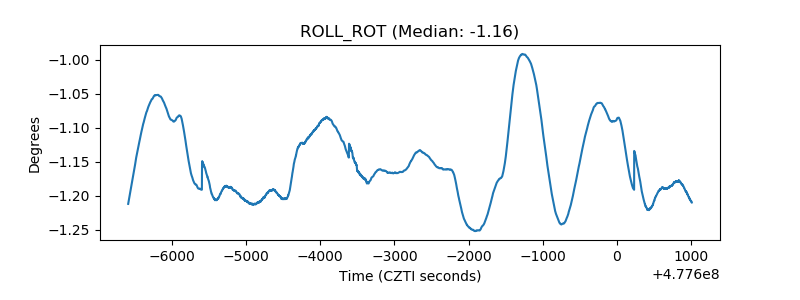 |
| _Roll_DEC | 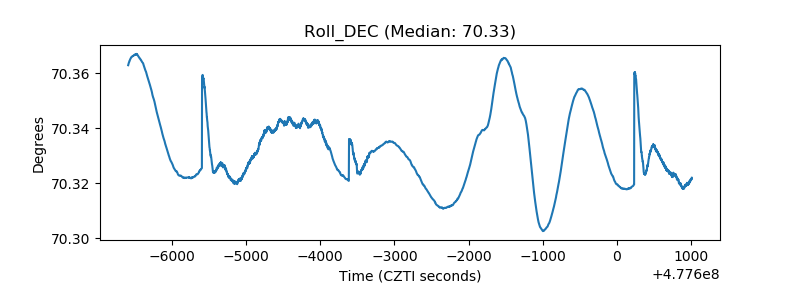 |
| _Roll_RA | 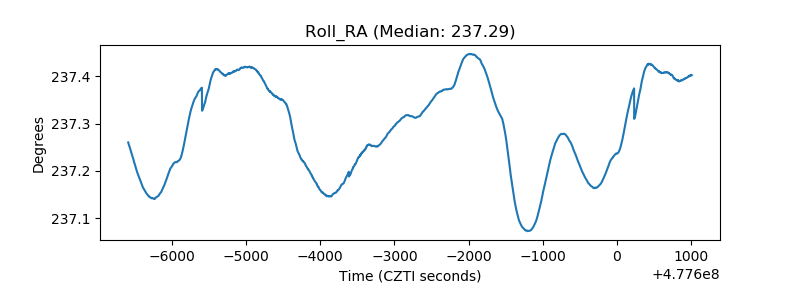 |
| Veto Counter | 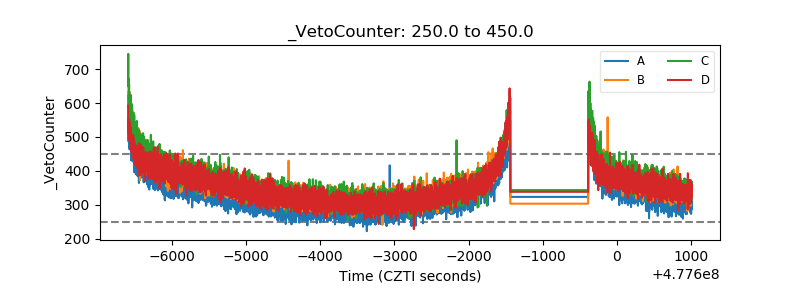 |