| Param | Original file | Final file |
|---|---|---|
| Filename | modeM0/AS1C07_001T01_9000006450_50815cztM0_level2.fits | modeM0/AS1C07_001T01_9000006450_50815cztM0_level2_quad_clean.evt |
| Size (bytes) | 532,586,880 | 96,099,840 |
| Size | 507.9 MB | 91.6 MB |
| Events in quadrant A | 5,896,533 | 578,252 |
| Events in quadrant B | 4,346,424 | 680,792 |
| Events in quadrant C | 3,914,849 | 616,340 |
| Events in quadrant D | 5,028,471 | 560,083 |
| Mode SS | |||
|---|---|---|---|
| Quadrant | BADHDUFLAG | Total packets | Discarded packets |
| A | 0 | 138 | 0 |
| B | 0 | 138 | 0 |
| C | 0 | 138 | 0 |
| D | 0 | 138 | 0 |
| Mode M0 | |||
|---|---|---|---|
| Quadrant | BADHDUFLAG | Total packets | Discarded packets |
| A | 0 | 22183 | 2 |
| B | 0 | 17627 | 2 |
| C | 0 | 16488 | 2 |
| D | 0 | 19759 | 2 |
| Mode M9 | |||
|---|---|---|---|
| Quadrant | BADHDUFLAG | Total packets | Discarded packets |
| A | 0 | 9 | 0 |
| B | 0 | 10 | 0 |
| C | 0 | 10 | 0 |
| D | 0 | 10 | 0 |
| Quadrant | Total seconds | Saturated seconds | Saturation percentage |
|---|---|---|---|
| A | 6806 | 896 | 13.164855% |
| B | 6806 | 299 | 4.393182% |
| C | 6806 | 115 | 1.689686% |
| D | 6806 | 420 | 6.171026% |
Noise dominated data is calculated using 1-second bins in cleaned event files. If a bin has >2000 counts, and if more than 50% of those come from <1% of pixels, then it is considered to be noise-dominated and hence unusable.
| Quadrant | # 1 sec bins | Bins with >0 counts | Bins with >2000 counts | High rate bins dominated by noise | Noise dominated (total time) | Noise dominated (detector-on time) | Marked lightcurve |
|---|---|---|---|---|---|---|---|
| A | 7606 | 6807 | 844 | 844 | 11.10% | 12.40% | 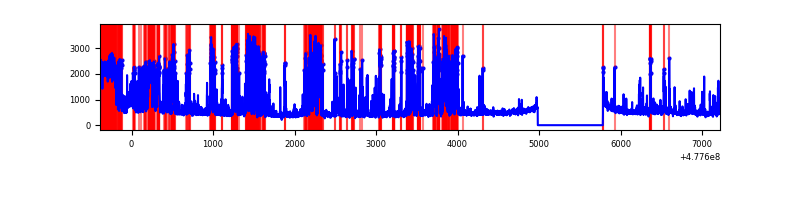 |
| B | 7606 | 6807 | 178 | 178 | 2.34% | 2.61% | 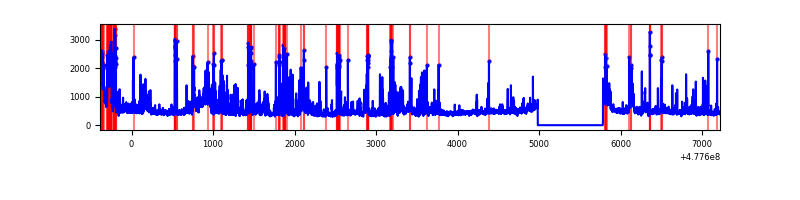 |
| C | 7606 | 6807 | 70 | 70 | 0.92% | 1.03% | 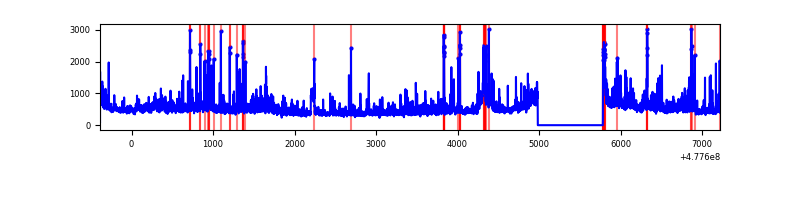 |
| D | 7606 | 6807 | 325 | 325 | 4.27% | 4.77% | 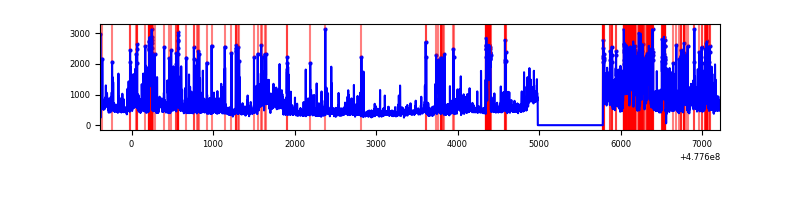 |
Top three noisy pixels from each quadrant. If the there are fewer than three noisy pixels in the level2.evt file, extra rows are filled as -1
| Pixel properties | Quadrant properties | ||||||
|---|---|---|---|---|---|---|---|
| Quadrant | DetID | PixID | Counts | Sigma | Mean | Median | Sigma |
| A | 14 | 254 | 1606656 | 9458.76 | 680 | 662 | 169.8 |
| A | 12 | 80 | 480774 | 2827.7 | 680 | 662 | 169.8 |
| A | 4 | 191 | 401054 | 2358.17 | 680 | 662 | 169.8 |
| B | 4 | 206 | 1002203 | 6657.96 | 707 | 684 | 150.4 |
| B | 5 | 79 | 173936 | 1151.76 | 707 | 684 | 150.4 |
| B | 10 | 247 | 70304 | 462.82 | 707 | 684 | 150.4 |
| C | 4 | 5 | 152353 | 771.71 | 706 | 696 | 196.5 |
| C | 5 | 10 | 141230 | 715.11 | 706 | 696 | 196.5 |
| C | 15 | 231 | 136978 | 693.48 | 706 | 696 | 196.5 |
| D | 1 | 47 | 557187 | 2888.26 | 687 | 662 | 192.7 |
| D | 8 | 48 | 374261 | 1938.91 | 687 | 662 | 192.7 |
| D | 2 | 249 | 306458 | 1587.02 | 687 | 662 | 192.7 |
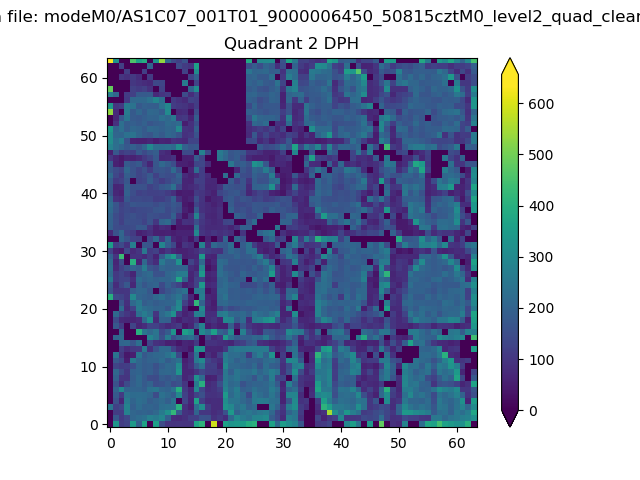
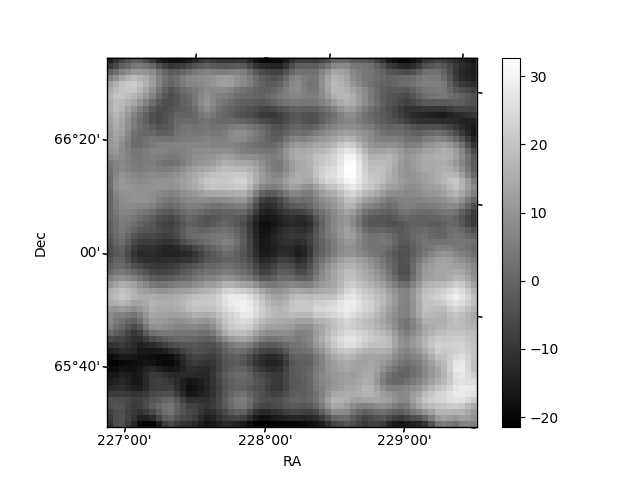
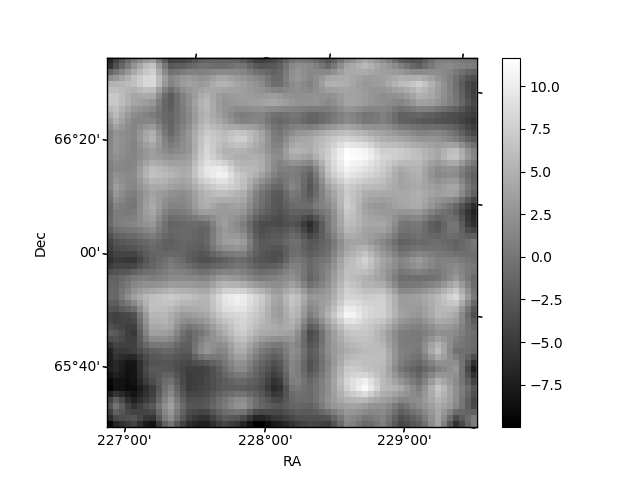
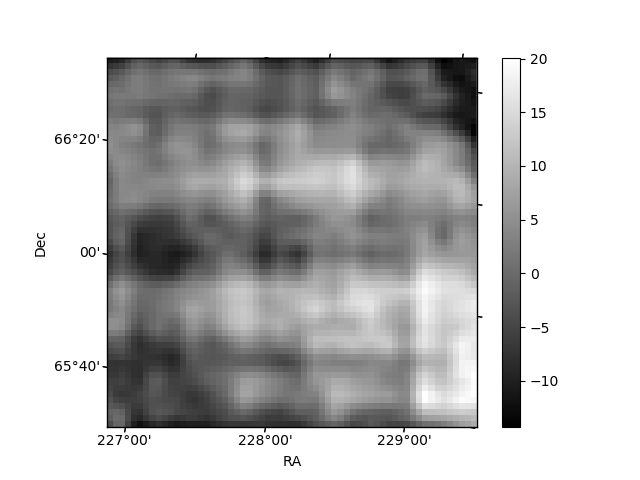
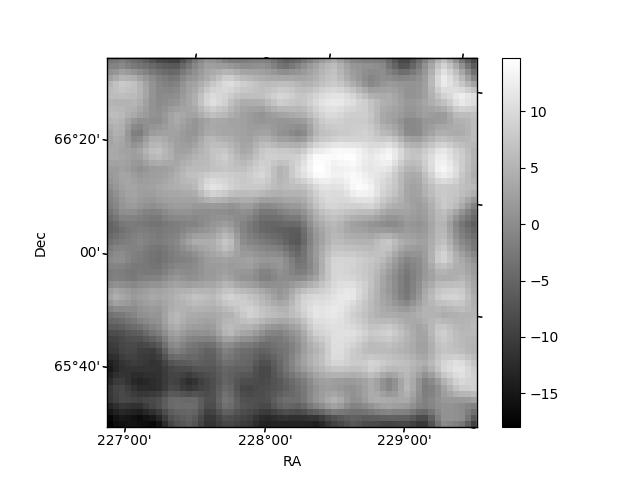
Histogram calculated using DETX and DETY for each event in the final _common_clean file
| Quadrant A | 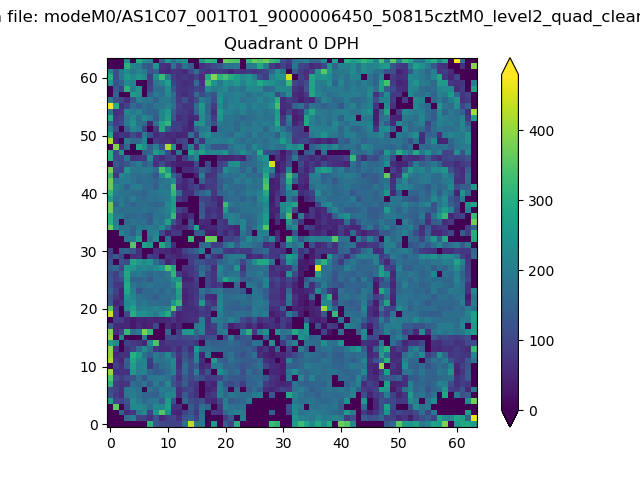 |
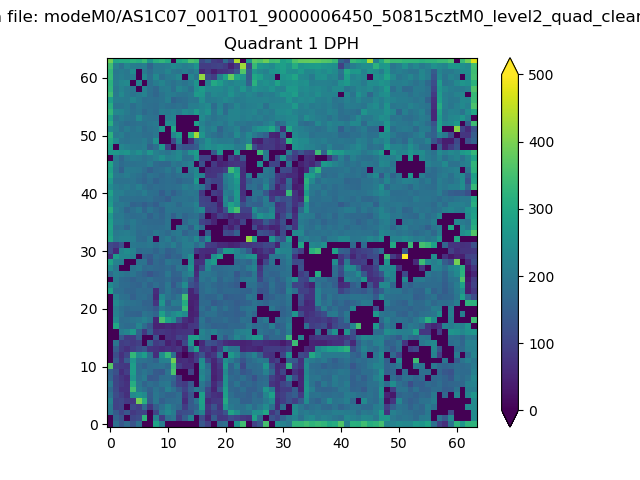 |
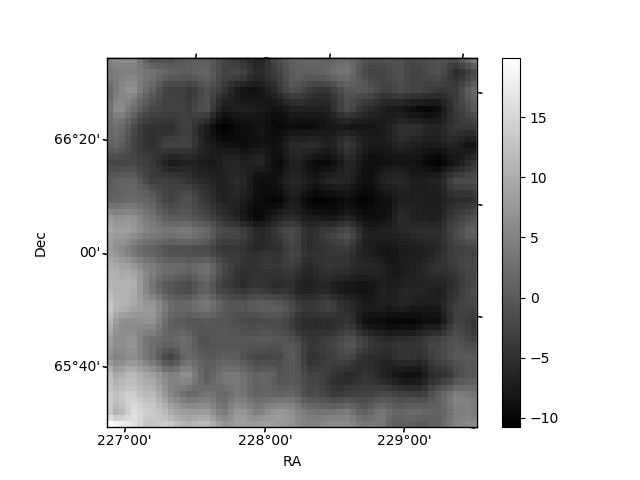
Quadrant B |
|---|---|---|---|
| Quadrant D | 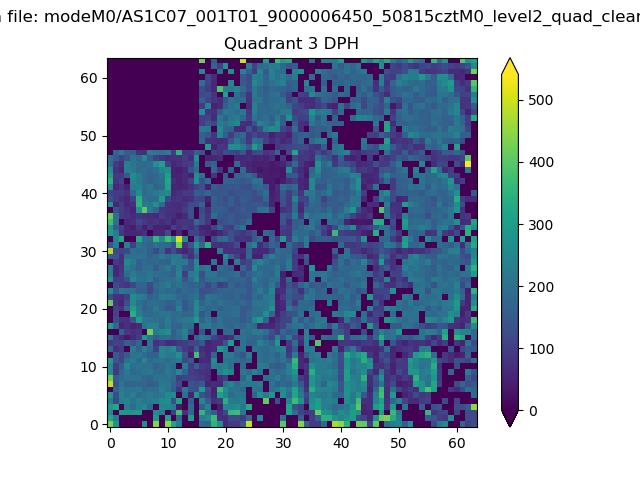 |
 |
Quadrant C |
| Plot type | Count rate plots | Images |
|---|---|---|
| Comparison with Poisson distribution Blue bars denote a histogram of data divided into 1 sec bins. Red curve is a Poisson curve with rate = median count rate of data. |
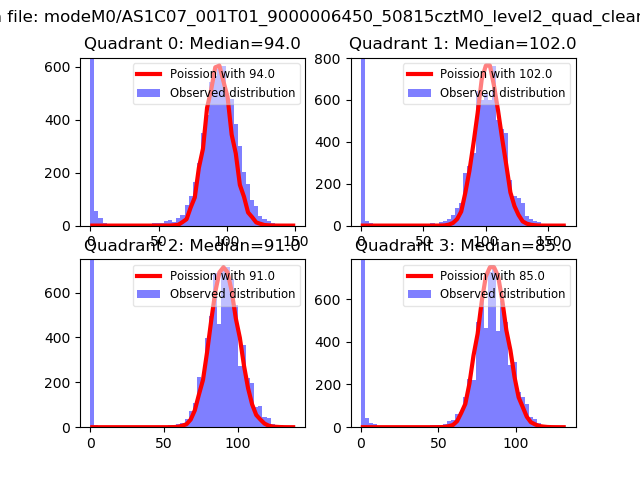 |
 |
| Quadrant-wise count rates Data is divided into 100 sec bins |
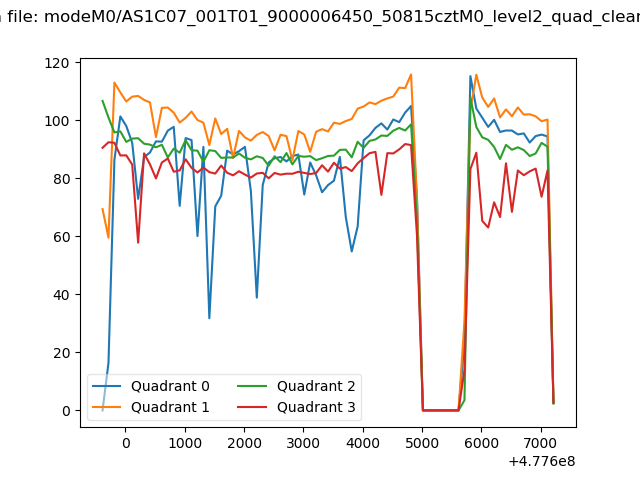 |
|
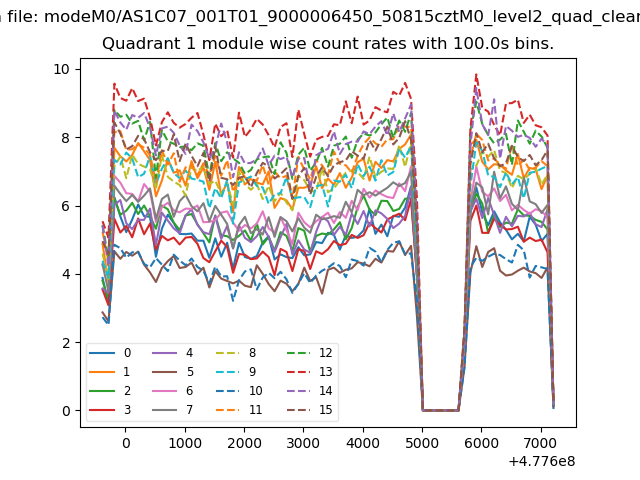
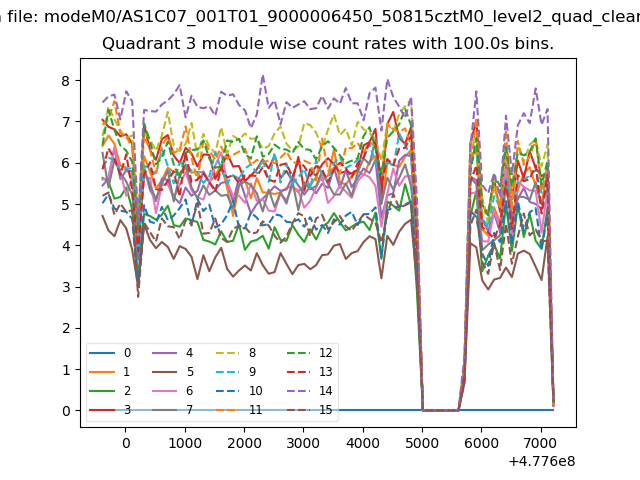
| Module-wise count rates for Quadrant A Data is divided into 100 sec bins |
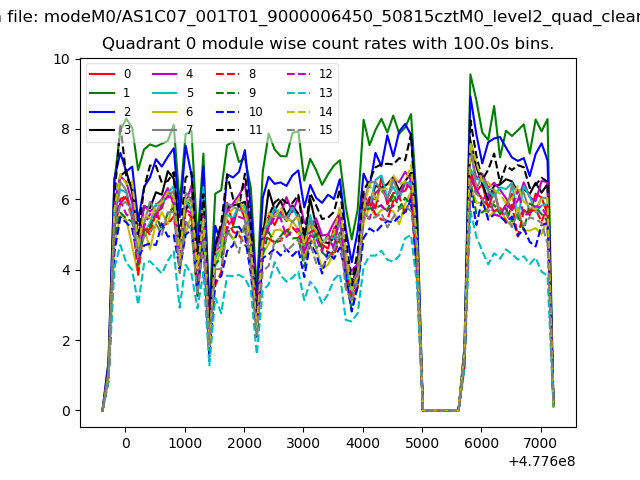 |
 |
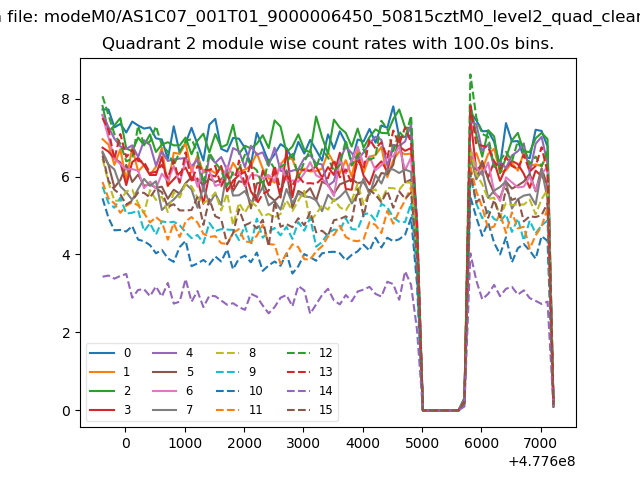
| Module-wise count rates for Quadrant B Data is divided into 100 sec bins |
 |
 |
| Module-wise count rates for Quadrant C Data is divided into 100 sec bins |
 |
 |
| Module-wise count rates for Quadrant D Data is divided into 100 sec bins |
 |
 |
| Parameter | Plot |
|---|---|
| CZT HV Monitor | 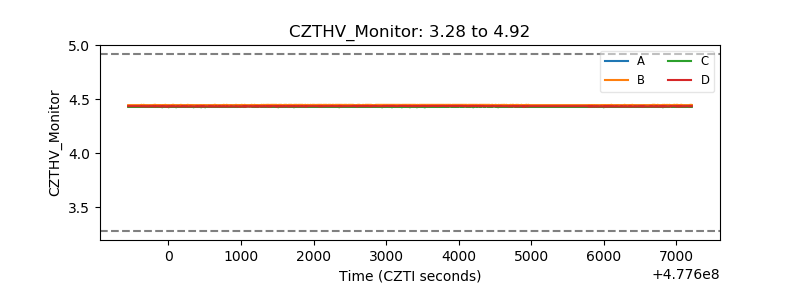 |
| D_VDD | 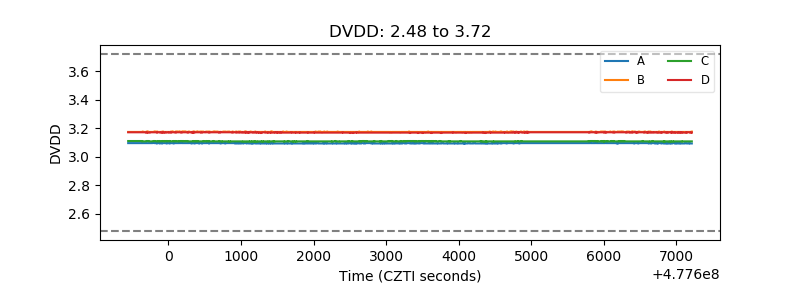 |
| Temperature 1 | 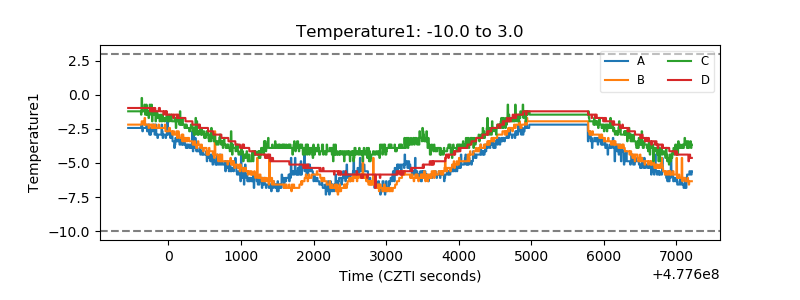 |
| Veto HV Monitor | 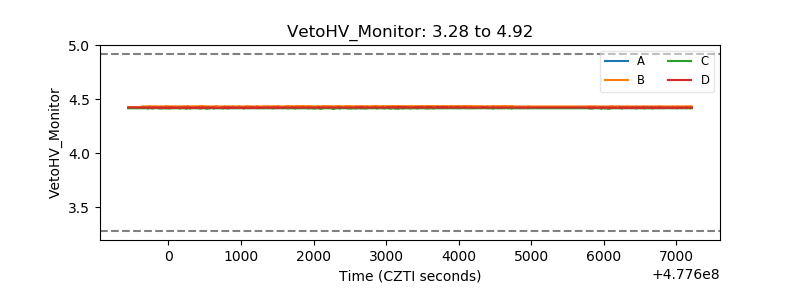 |
| Veto LLD | 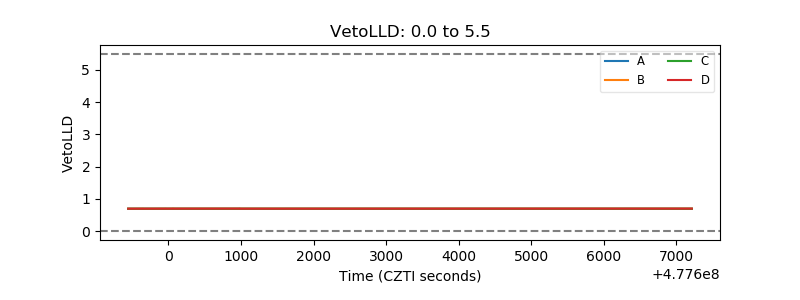 |
| Alpha Counter | 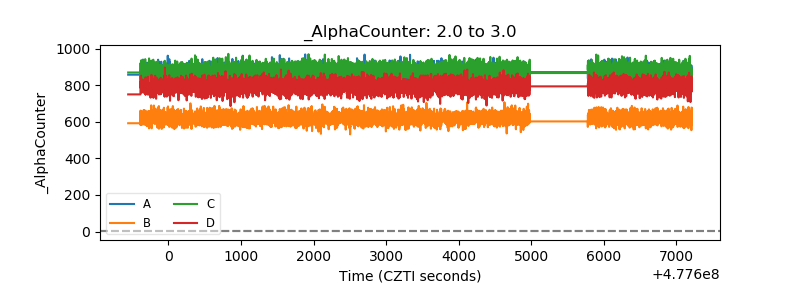 |
| _CPM_Rate | 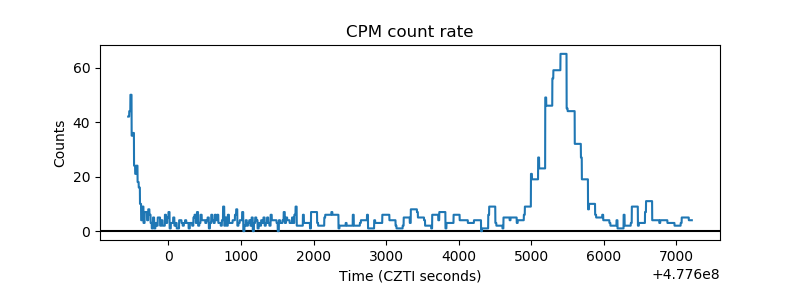 |
| CZT Counter | 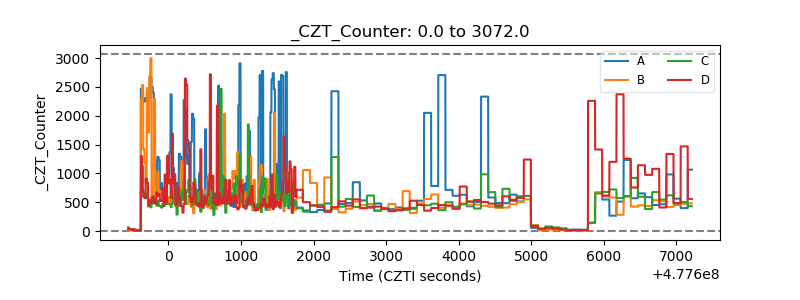 |
| +2.5 Volts monitor | 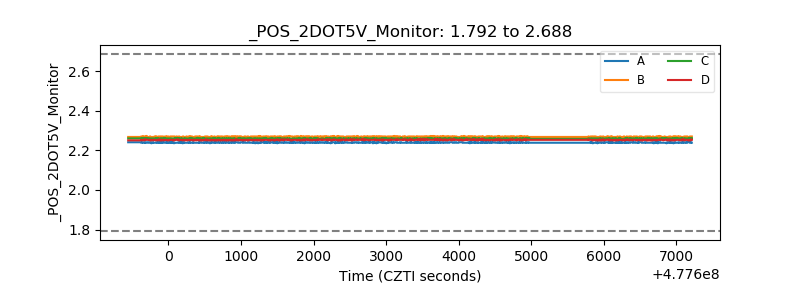 |
| +5 Volts monitor | 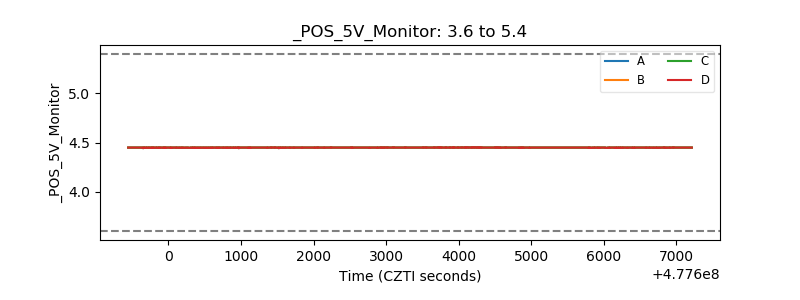 |
| _ROLL_ROT | 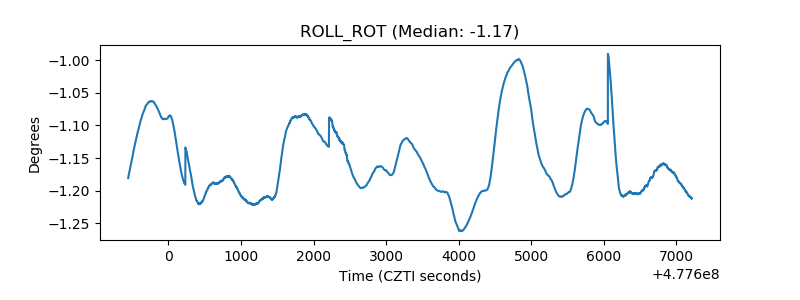 |
| _Roll_DEC | 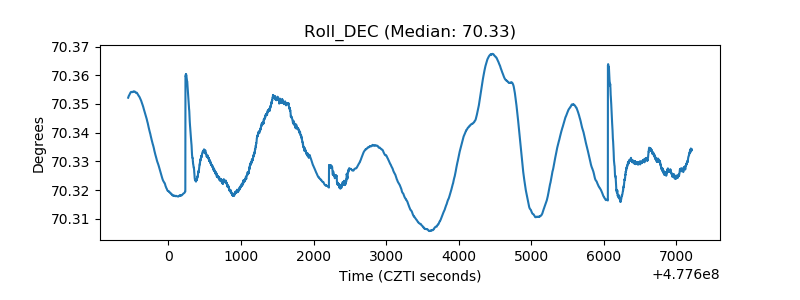 |
| _Roll_RA | 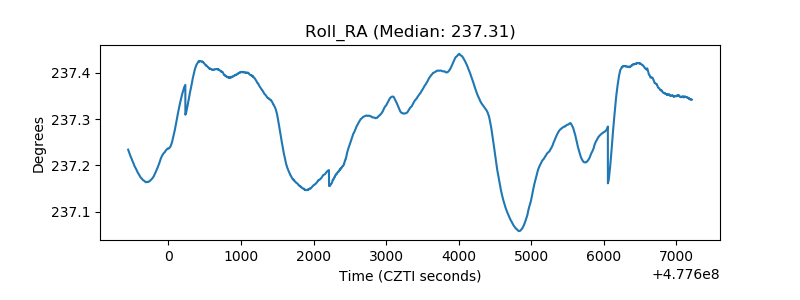 |
| Veto Counter | 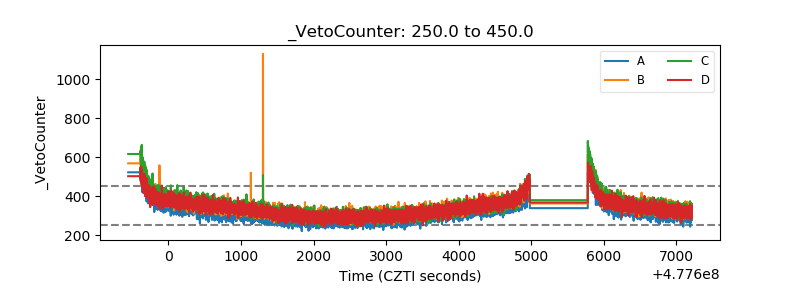 |