| Param | Original file | Final file |
|---|---|---|
| Filename | modeM0/AS1C07_001T01_9000006450_50816cztM0_level2.fits | modeM0/AS1C07_001T01_9000006450_50816cztM0_level2_quad_clean.evt |
| Size (bytes) | 704,139,840 | 101,638,080 |
| Size | 671.5 MB | 96.9 MB |
| Events in quadrant A | 6,757,051 | 647,744 |
| Events in quadrant B | 6,327,567 | 690,652 |
| Events in quadrant C | 5,038,848 | 668,745 |
| Events in quadrant D | 7,358,010 | 546,089 |
| Mode SS | |||
|---|---|---|---|
| Quadrant | BADHDUFLAG | Total packets | Discarded packets |
| A | 0 | 154 | 0 |
| B | 0 | 154 | 0 |
| C | 0 | 154 | 0 |
| D | 0 | 154 | 0 |
| Mode M0 | |||
|---|---|---|---|
| Quadrant | BADHDUFLAG | Total packets | Discarded packets |
| A | 0 | 25258 | 3 |
| B | 0 | 24047 | 4 |
| C | 0 | 20176 | 3 |
| D | 0 | 27208 | 3 |
| Mode M9 | |||
|---|---|---|---|
| Quadrant | BADHDUFLAG | Total packets | Discarded packets |
| A | 0 | 3 | 0 |
| B | 0 | 4 | 0 |
| C | 0 | 4 | 0 |
| D | 0 | 4 | 0 |
| Quadrant | Total seconds | Saturated seconds | Saturation percentage |
|---|---|---|---|
| A | 7533 | 862 | 11.442984% |
| B | 7532 | 1008 | 13.382900% |
| C | 7532 | 221 | 2.934148% |
| D | 7532 | 1245 | 16.529474% |
Noise dominated data is calculated using 1-second bins in cleaned event files. If a bin has >2000 counts, and if more than 50% of those come from <1% of pixels, then it is considered to be noise-dominated and hence unusable.
| Quadrant | # 1 sec bins | Bins with >0 counts | Bins with >2000 counts | High rate bins dominated by noise | Noise dominated (total time) | Noise dominated (detector-on time) | Marked lightcurve |
|---|---|---|---|---|---|---|---|
| A | 7758 | 7536 | 740 | 740 | 9.54% | 9.82% | 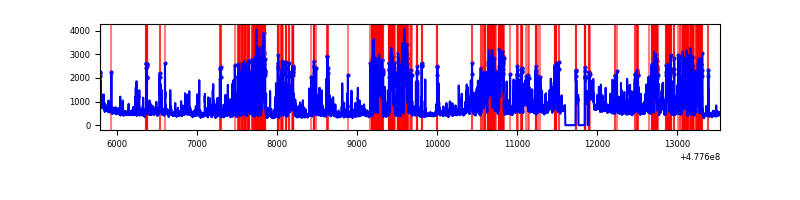 |
| B | 7757 | 7535 | 655 | 655 | 8.44% | 8.69% | 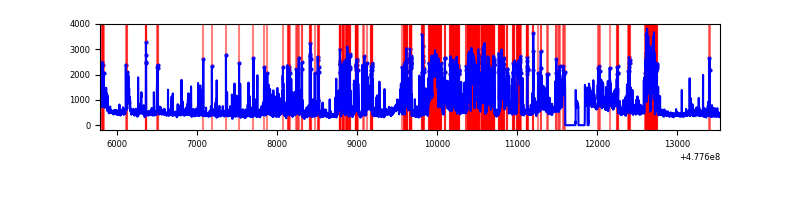 |
| C | 7757 | 7535 | 121 | 121 | 1.56% | 1.61% | 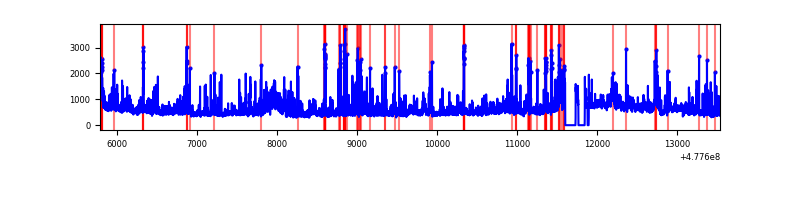 |
| D | 7757 | 7535 | 818 | 818 | 10.55% | 10.86% | 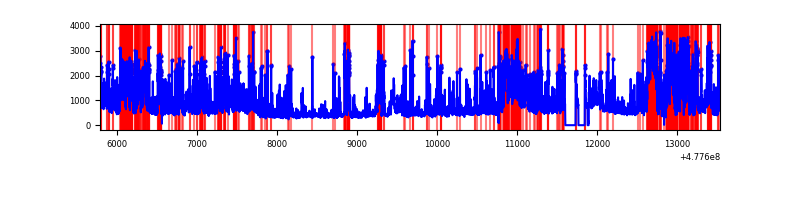 |
Top three noisy pixels from each quadrant. If the there are fewer than three noisy pixels in the level2.evt file, extra rows are filled as -1
| Pixel properties | Quadrant properties | ||||||
|---|---|---|---|---|---|---|---|
| Quadrant | DetID | PixID | Counts | Sigma | Mean | Median | Sigma |
| A | 6 | 161 | 1191692 | 6247.83 | 770 | 752 | 190.6 |
| A | 14 | 254 | 906176 | 4749.97 | 770 | 752 | 190.6 |
| A | 4 | 191 | 668495 | 3503.07 | 770 | 752 | 190.6 |
| B | 4 | 206 | 2735529 | 16803.73 | 772 | 746 | 162.7 |
| B | 8 | 128 | 135951 | 830.76 | 772 | 746 | 162.7 |
| B | 10 | 28 | 56111 | 340.19 | 772 | 746 | 162.7 |
| C | 5 | 10 | 535919 | 2449.52 | 788 | 777 | 218.5 |
| C | 9 | 38 | 320116 | 1461.72 | 788 | 777 | 218.5 |
| C | 13 | 3 | 256997 | 1172.8 | 788 | 777 | 218.5 |
| D | 15 | 123 | 1555458 | 7852.01 | 708 | 680 | 198.0 |
| D | 1 | 47 | 653990 | 3299.37 | 708 | 680 | 198.0 |
| D | 2 | 249 | 591597 | 2984.27 | 708 | 680 | 198.0 |
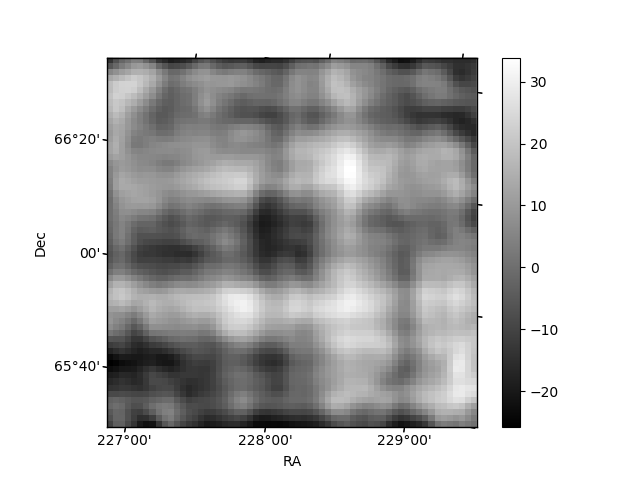
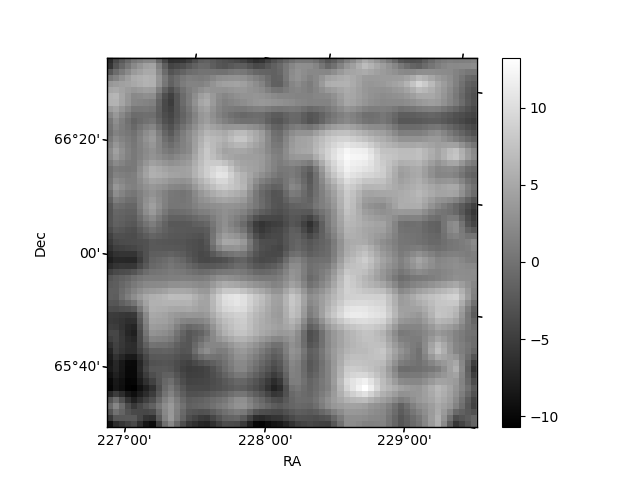
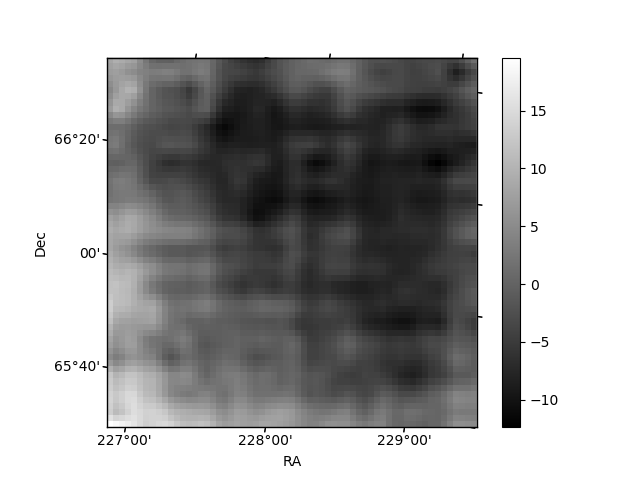
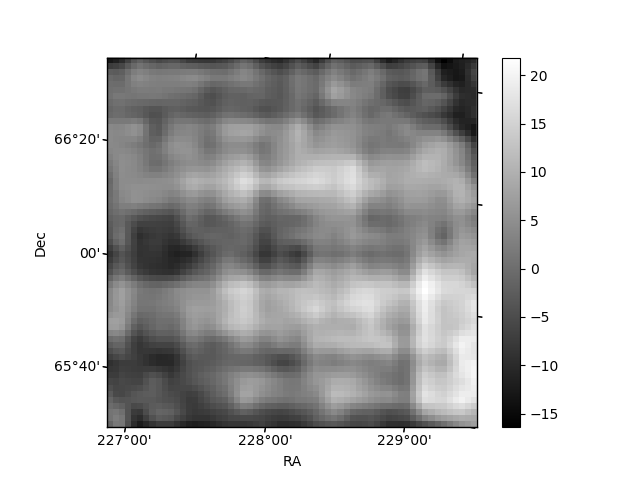
Histogram calculated using DETX and DETY for each event in the final _common_clean file
| Quadrant A | 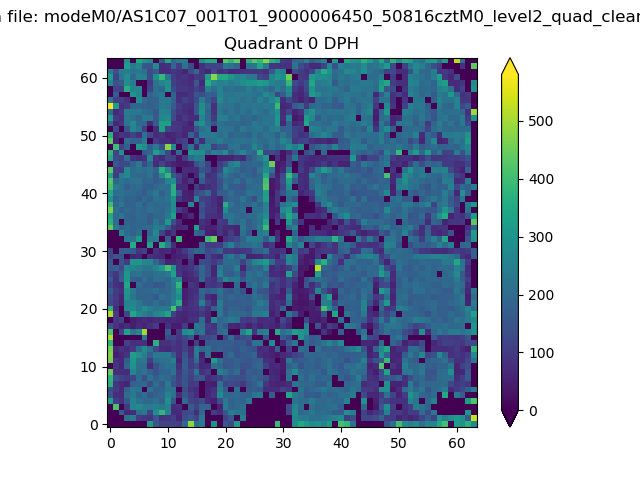 |
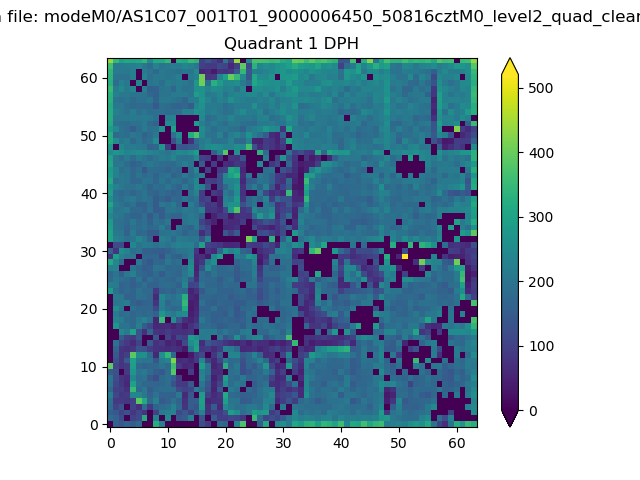 |
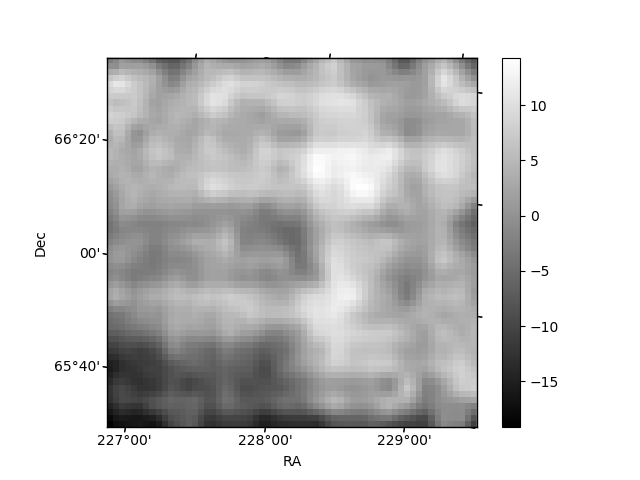
Quadrant B |
|---|---|---|---|
| Quadrant D | 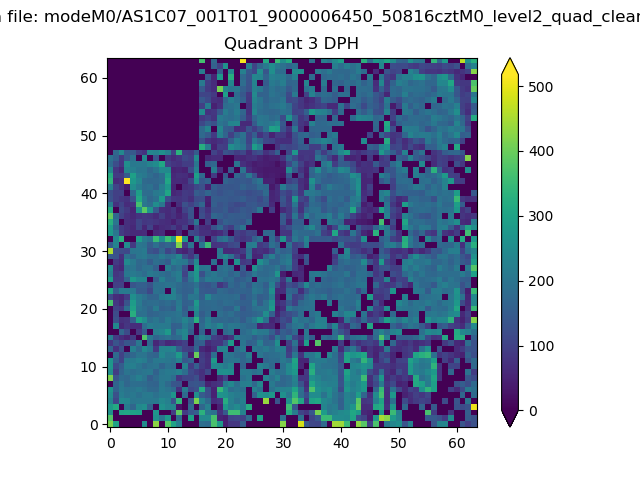 |
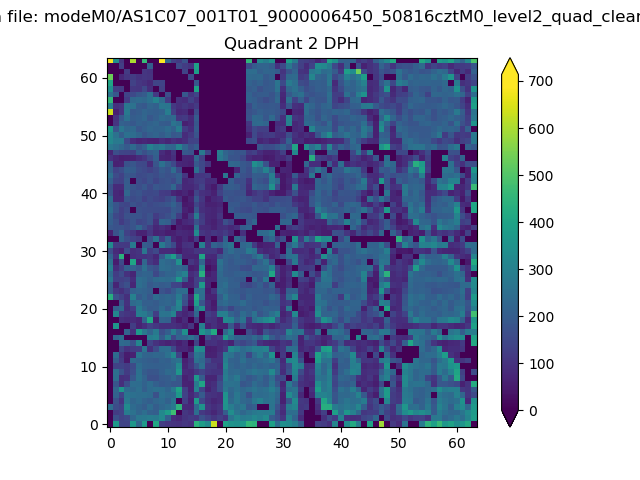 |
Quadrant C |
| Plot type | Count rate plots | Images |
|---|---|---|
| Comparison with Poisson distribution Blue bars denote a histogram of data divided into 1 sec bins. Red curve is a Poisson curve with rate = median count rate of data. |
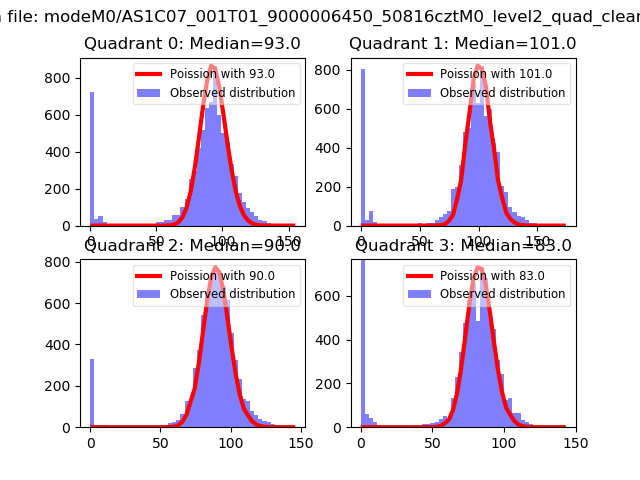 |
 |
| Quadrant-wise count rates Data is divided into 100 sec bins |
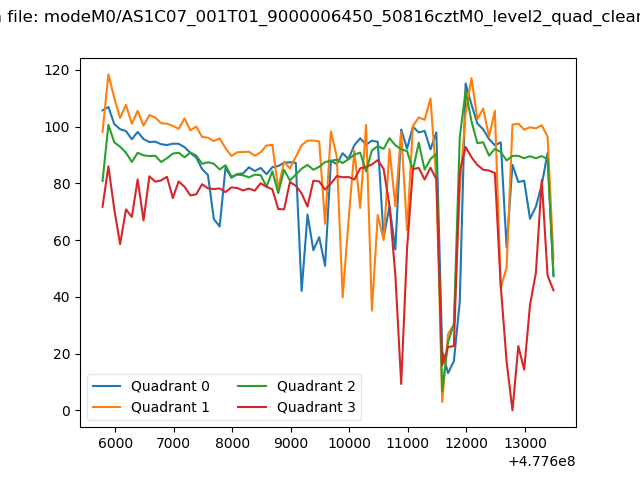 |
|
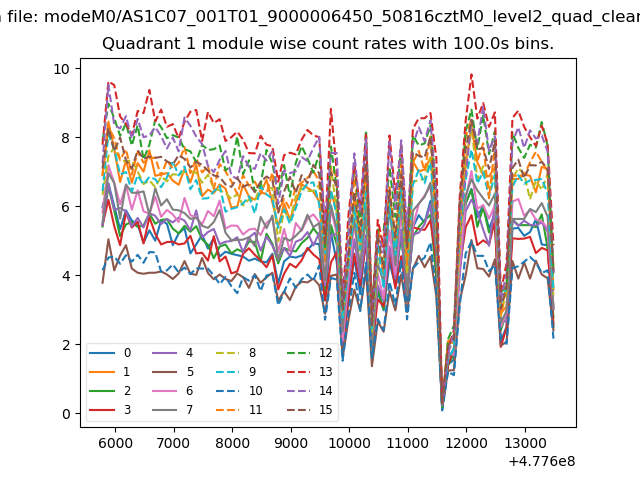
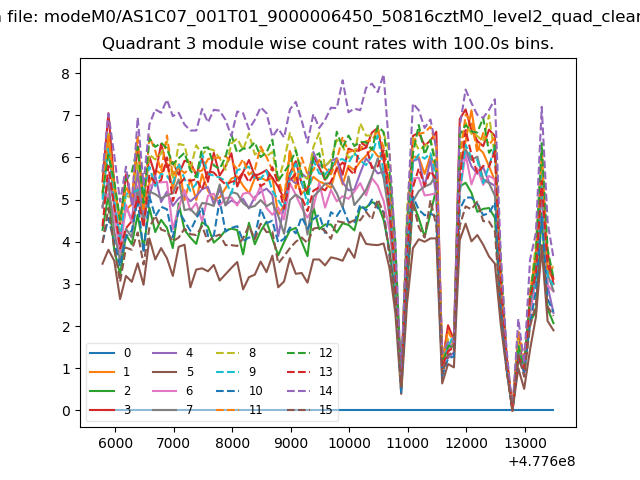
| Module-wise count rates for Quadrant A Data is divided into 100 sec bins |
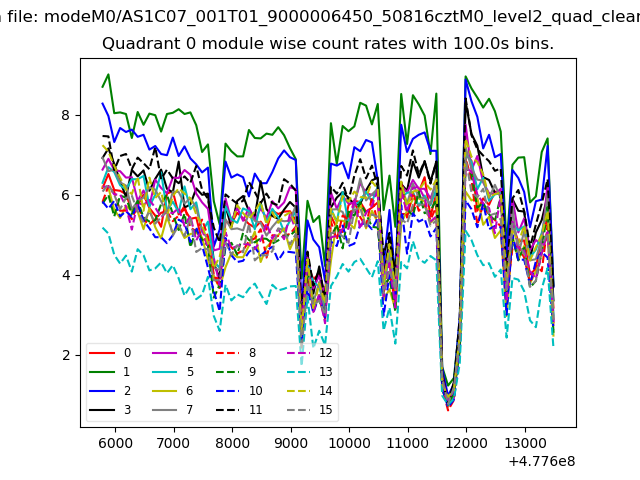 |
 |
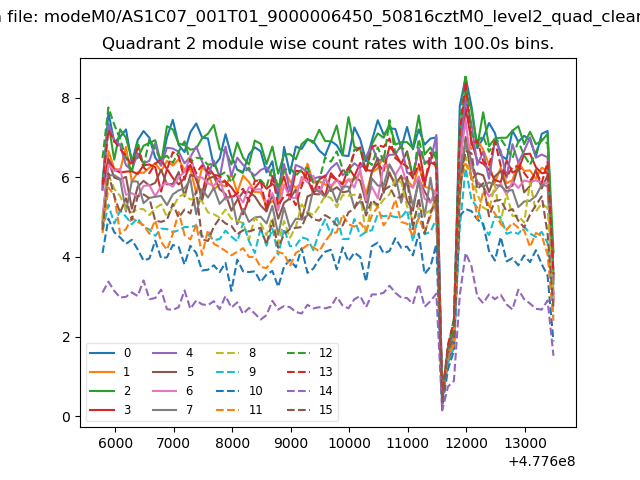
| Module-wise count rates for Quadrant B Data is divided into 100 sec bins |
 |
 |
| Module-wise count rates for Quadrant C Data is divided into 100 sec bins |
 |
 |
| Module-wise count rates for Quadrant D Data is divided into 100 sec bins |
 |
 |
| Parameter | Plot |
|---|---|
| CZT HV Monitor | 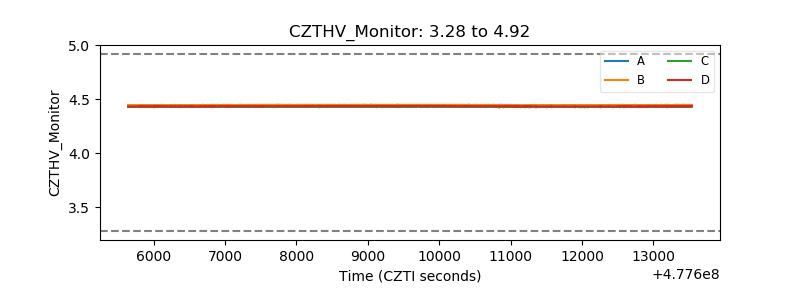 |
| D_VDD | 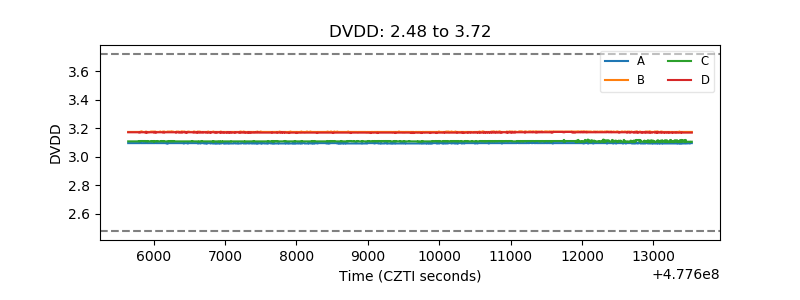 |
| Temperature 1 | 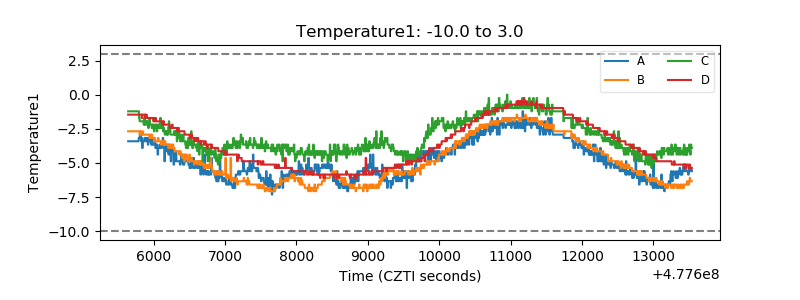 |
| Veto HV Monitor | 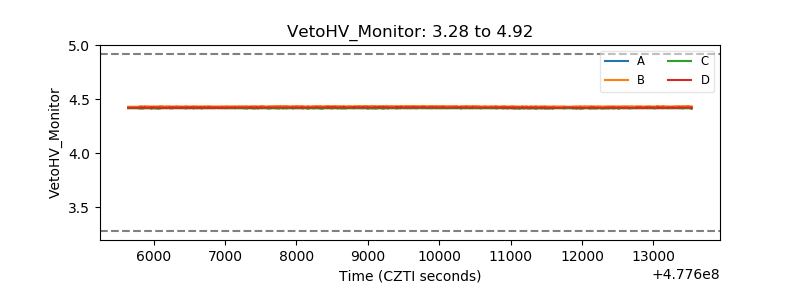 |
| Veto LLD | 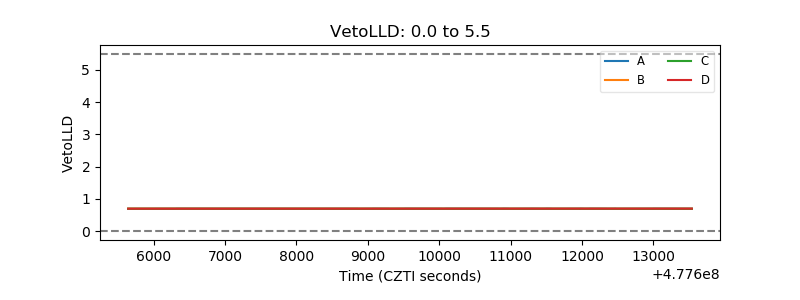 |
| Alpha Counter | 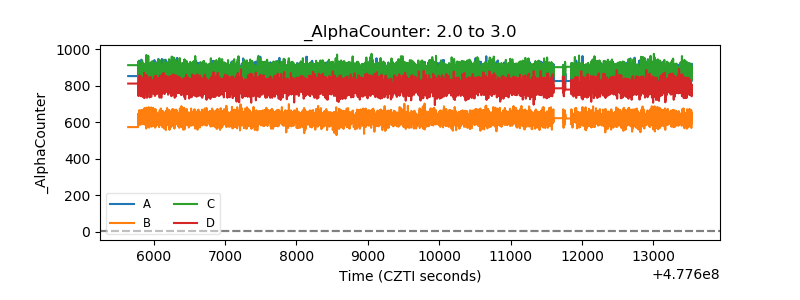 |
| _CPM_Rate | 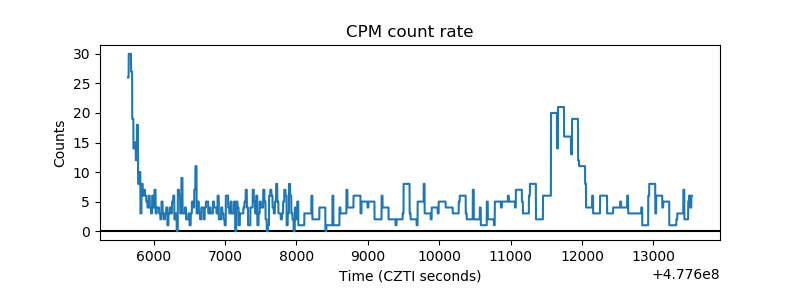 |
| CZT Counter | 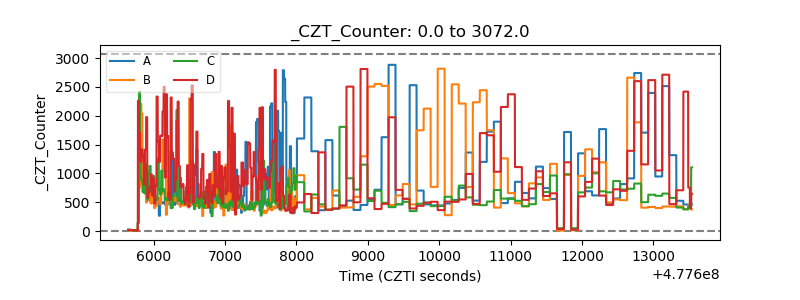 |
| +2.5 Volts monitor | 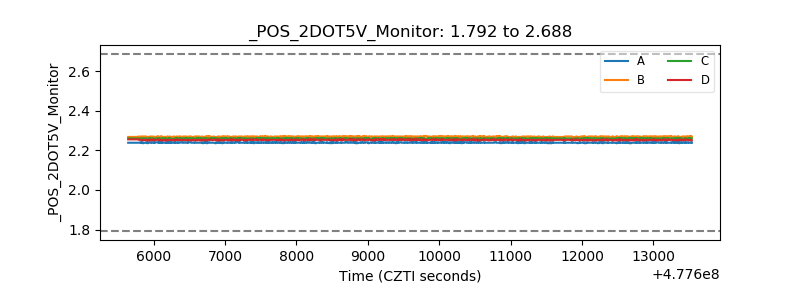 |
| +5 Volts monitor | 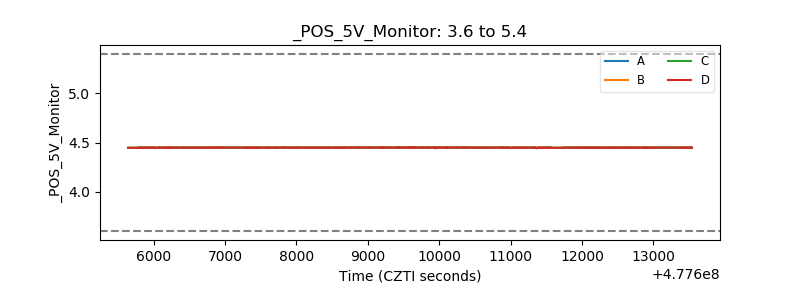 |
| _ROLL_ROT | 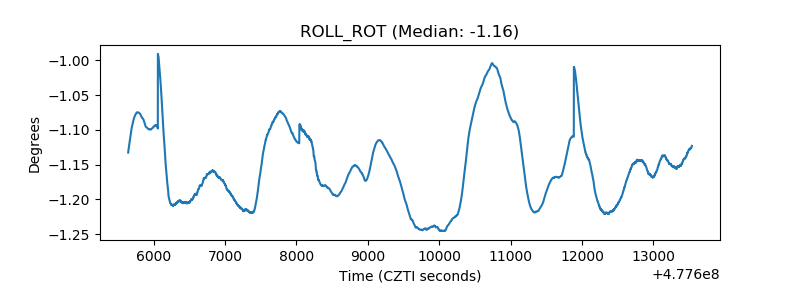 |
| _Roll_DEC | 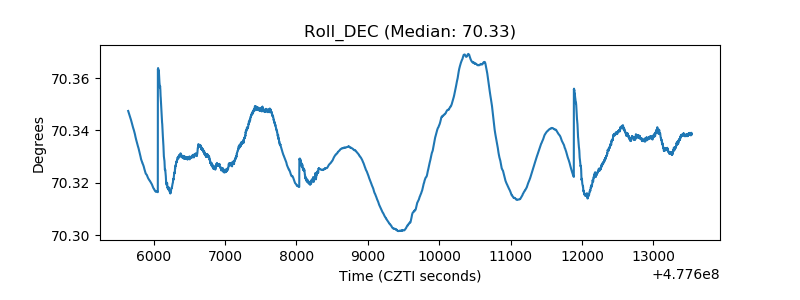 |
| _Roll_RA | 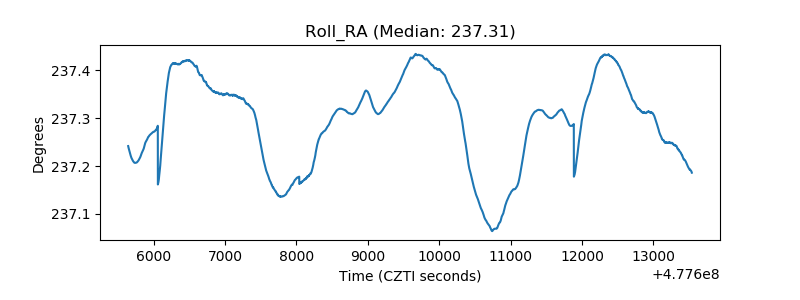 |
| Veto Counter | 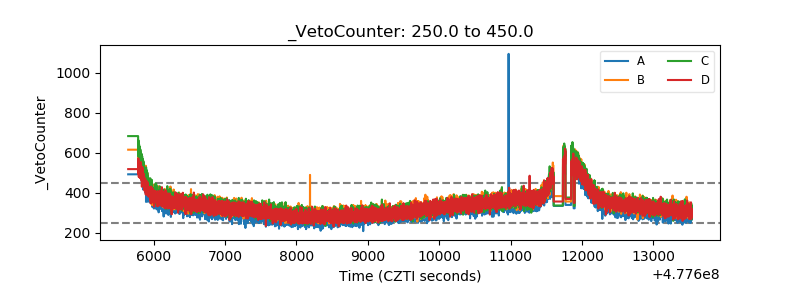 |