| Param | Original file | Final file |
|---|---|---|
| Filename | modeM0/AS1C07_001T01_9000006450_50817cztM0_level2.fits | modeM0/AS1C07_001T01_9000006450_50817cztM0_level2_quad_clean.evt |
| Size (bytes) | 742,985,280 | 112,694,400 |
| Size | 708.6 MB | 107.5 MB |
| Events in quadrant A | 6,705,130 | 742,303 |
| Events in quadrant B | 4,853,063 | 823,096 |
| Events in quadrant C | 5,249,086 | 742,155 |
| Events in quadrant D | 10,052,849 | 528,086 |
| Mode SS | |||
|---|---|---|---|
| Quadrant | BADHDUFLAG | Total packets | Discarded packets |
| A | 0 | 170 | 0 |
| B | 0 | 170 | 0 |
| C | 0 | 170 | 0 |
| D | 0 | 170 | 0 |
| Mode M0 | |||
|---|---|---|---|
| Quadrant | BADHDUFLAG | Total packets | Discarded packets |
| A | 0 | 25793 | 2 |
| B | 0 | 20357 | 2 |
| C | 0 | 21594 | 2 |
| D | 0 | 35607 | 2 |
| Mode M9 | |||
|---|---|---|---|
| Quadrant | BADHDUFLAG | Total packets | Discarded packets |
| A | 0 | 2 | 0 |
| B | 0 | 2 | 0 |
| C | 0 | 2 | 0 |
| D | 0 | 2 | 0 |
| Quadrant | Total seconds | Saturated seconds | Saturation percentage |
|---|---|---|---|
| A | 8296 | 544 | 6.557377% |
| B | 8295 | 375 | 4.520796% |
| C | 8295 | 192 | 2.314647% |
| D | 8296 | 2302 | 27.748312% |
Noise dominated data is calculated using 1-second bins in cleaned event files. If a bin has >2000 counts, and if more than 50% of those come from <1% of pixels, then it is considered to be noise-dominated and hence unusable.
| Quadrant | # 1 sec bins | Bins with >0 counts | Bins with >2000 counts | High rate bins dominated by noise | Noise dominated (total time) | Noise dominated (detector-on time) | Marked lightcurve |
|---|---|---|---|---|---|---|---|
| A | 8521 | 8299 | 421 | 421 | 4.94% | 5.07% |  |
| B | 8520 | 8298 | 154 | 154 | 1.81% | 1.86% | 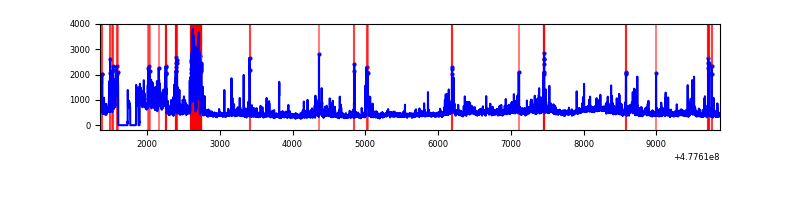 |
| C | 8520 | 8298 | 80 | 80 | 0.94% | 0.96% | 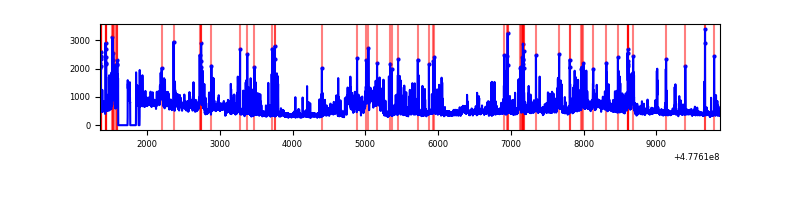 |
| D | 8521 | 8299 | 1619 | 1619 | 19.00% | 19.51% | 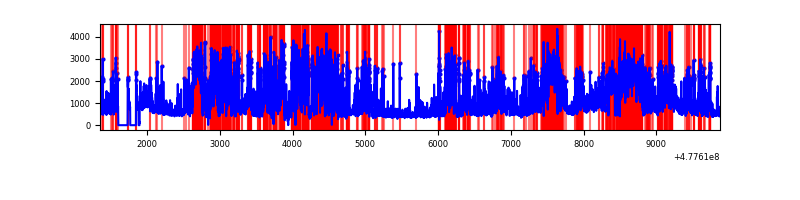 |
Top three noisy pixels from each quadrant. If the there are fewer than three noisy pixels in the level2.evt file, extra rows are filled as -1
| Pixel properties | Quadrant properties | ||||||
|---|---|---|---|---|---|---|---|
| Quadrant | DetID | PixID | Counts | Sigma | Mean | Median | Sigma |
| A | 4 | 191 | 969705 | 4447.59 | 878 | 858 | 217.8 |
| A | 6 | 161 | 528637 | 2422.82 | 878 | 858 | 217.8 |
| A | 4 | 3 | 248546 | 1137.04 | 878 | 858 | 217.8 |
| B | 4 | 206 | 600768 | 3190.86 | 889 | 856 | 188.0 |
| B | 0 | 172 | 87247 | 459.5 | 889 | 856 | 188.0 |
| B | 8 | 128 | 86147 | 453.65 | 889 | 856 | 188.0 |
| C | 9 | 38 | 667402 | 2725.23 | 883 | 871 | 244.6 |
| C | 5 | 10 | 153513 | 624.1 | 883 | 871 | 244.6 |
| C | 14 | 242 | 95678 | 387.64 | 883 | 871 | 244.6 |
| D | 15 | 123 | 3469722 | 16755.75 | 738 | 711 | 207.0 |
| D | 10 | 181 | 540112 | 2605.37 | 738 | 711 | 207.0 |
| D | 3 | 12 | 497860 | 2401.29 | 738 | 711 | 207.0 |
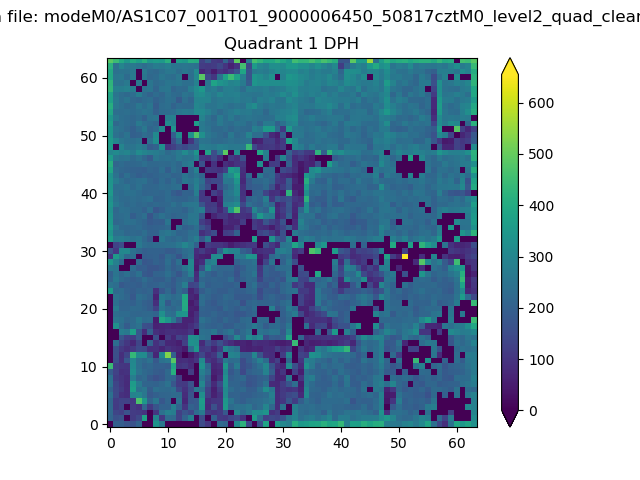
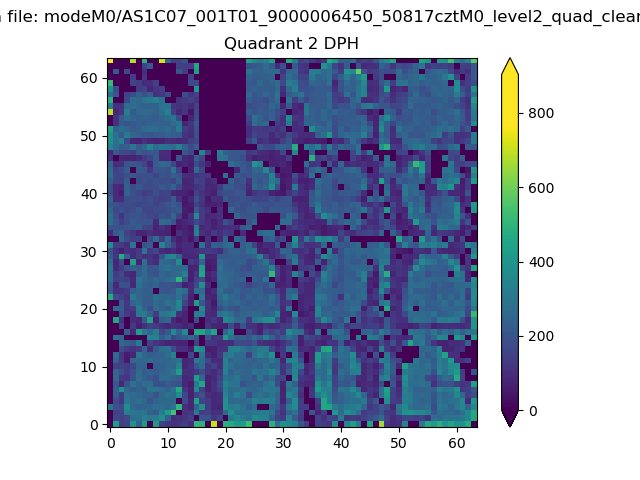
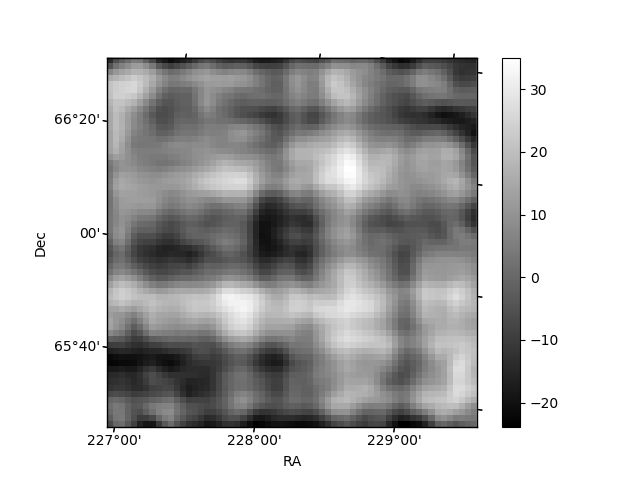
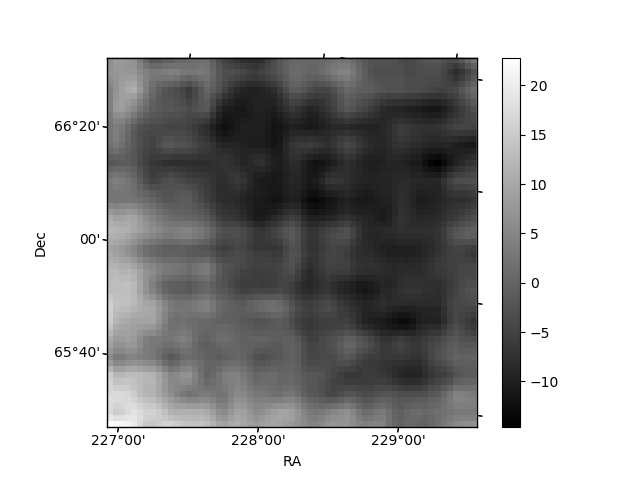
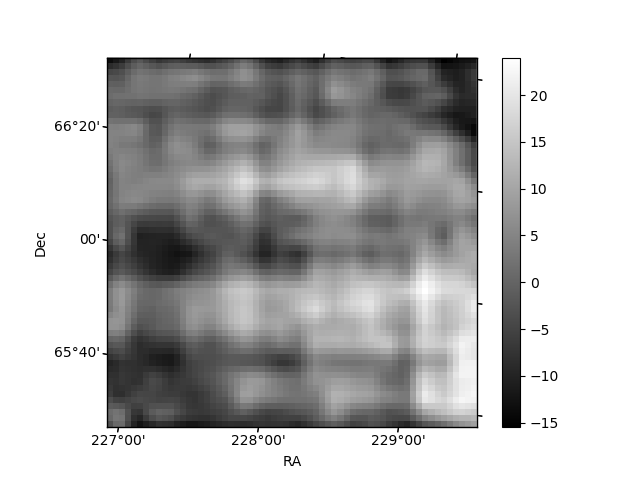
Histogram calculated using DETX and DETY for each event in the final _common_clean file
| Quadrant A | 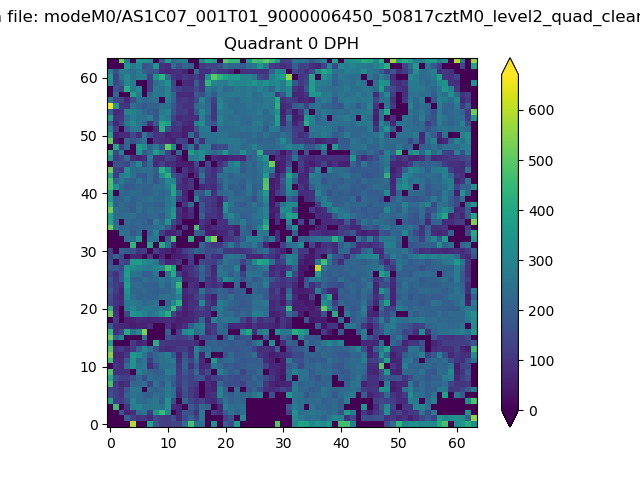 |
 |
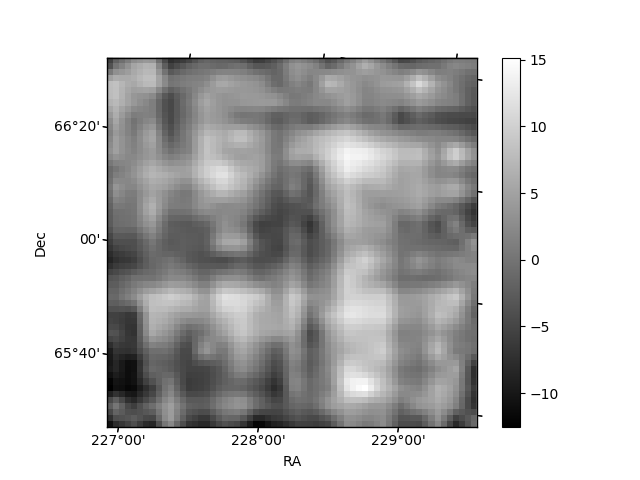
Quadrant B |
|---|---|---|---|
| Quadrant D | 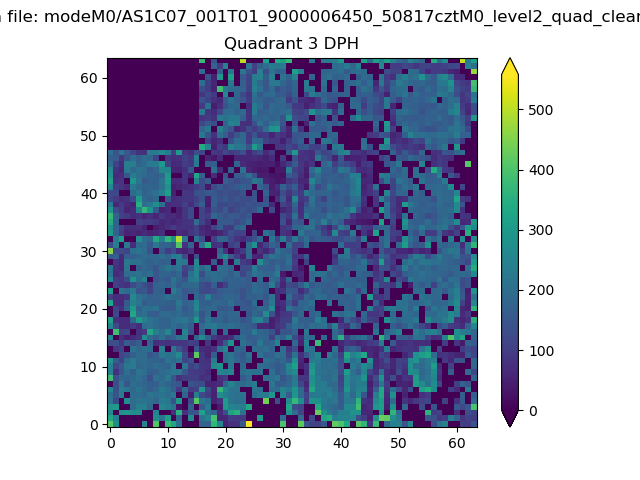 |
 |
Quadrant C |
| Plot type | Count rate plots | Images |
|---|---|---|
| Comparison with Poisson distribution Blue bars denote a histogram of data divided into 1 sec bins. Red curve is a Poisson curve with rate = median count rate of data. |
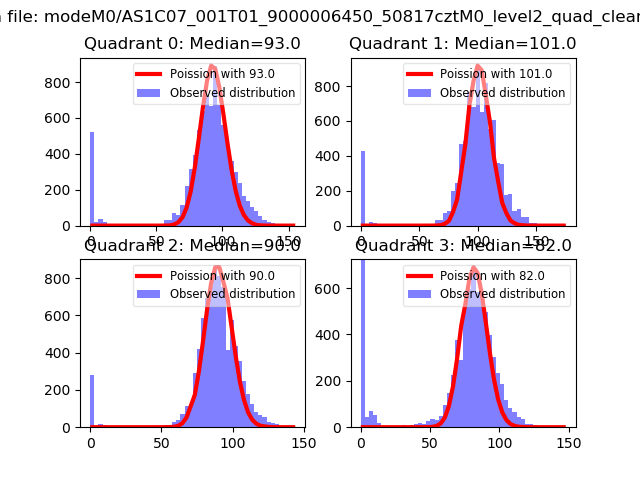 |
 |
| Quadrant-wise count rates Data is divided into 100 sec bins |
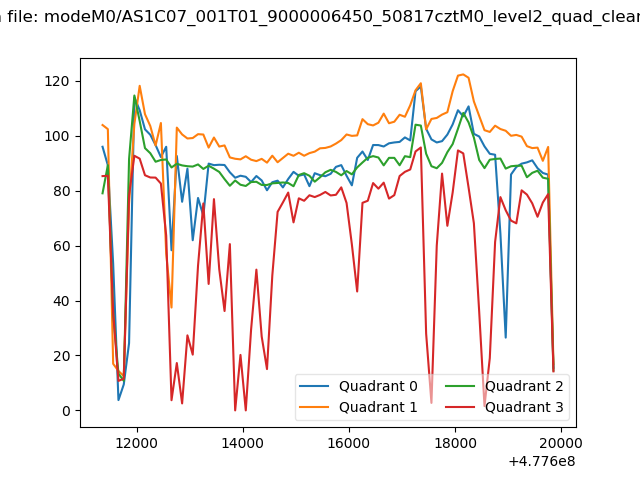 |
|
| Module-wise count rates for Quadrant A Data is divided into 100 sec bins |
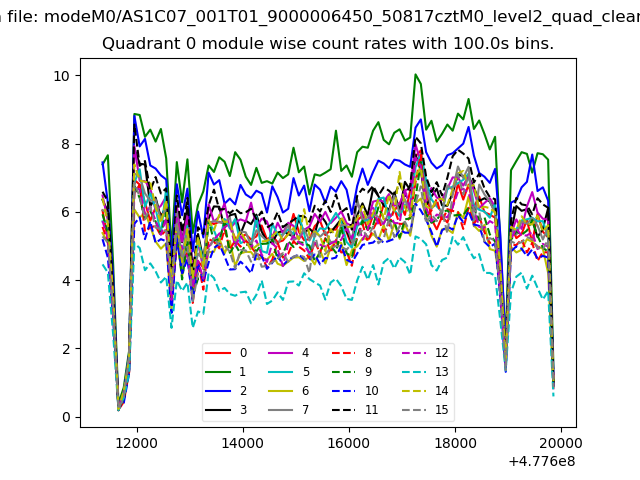 |
 |
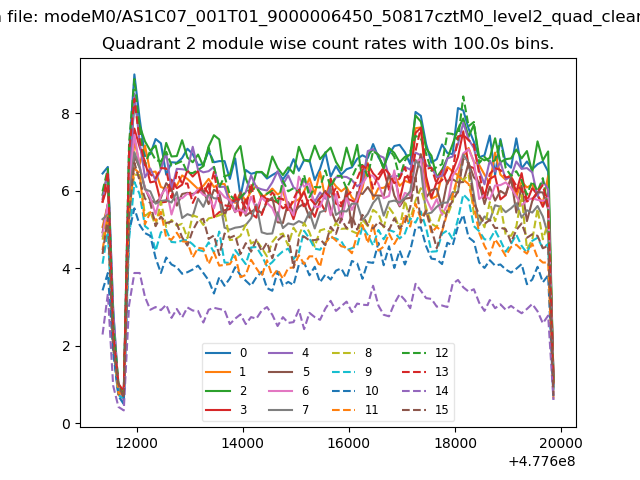
| Module-wise count rates for Quadrant B Data is divided into 100 sec bins |
 |
 |
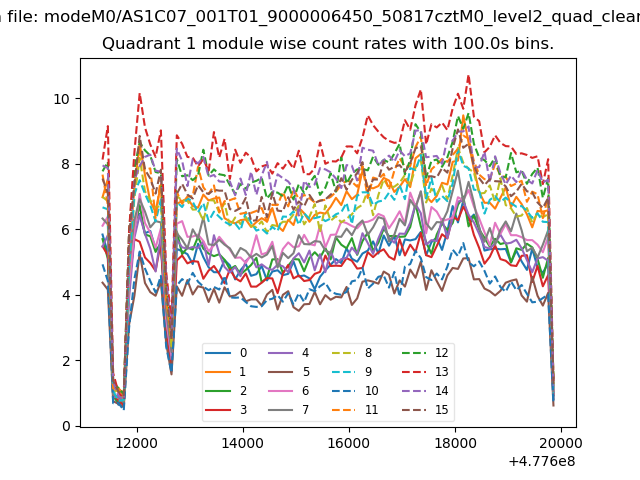
| Module-wise count rates for Quadrant C Data is divided into 100 sec bins |
 |
 |
| Module-wise count rates for Quadrant D Data is divided into 100 sec bins |
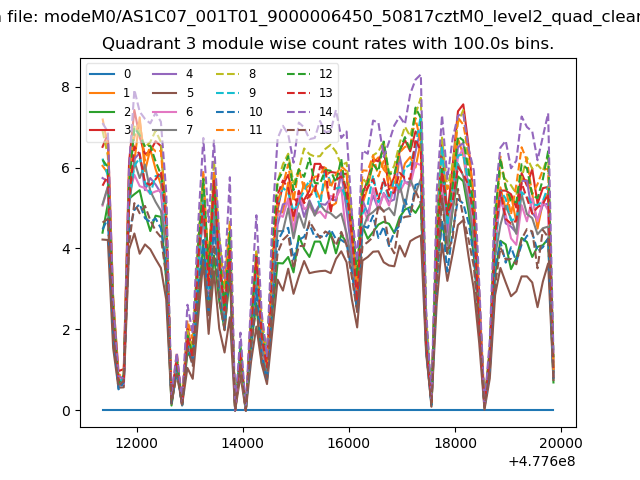 |
 |
| Parameter | Plot |
|---|---|
| CZT HV Monitor | 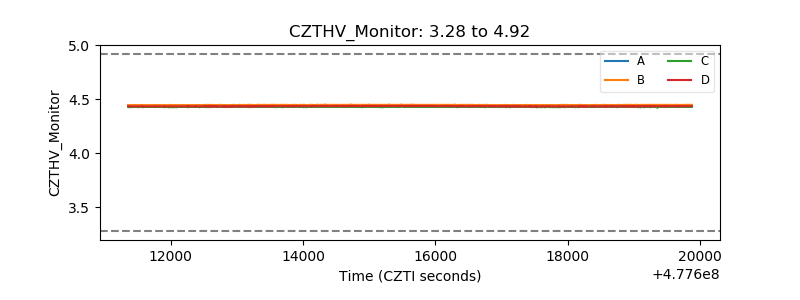 |
| D_VDD | 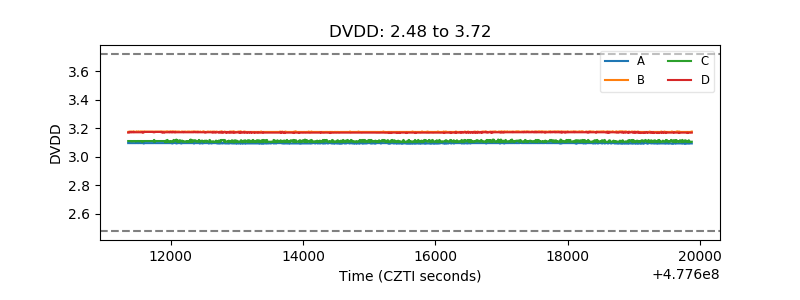 |
| Temperature 1 | 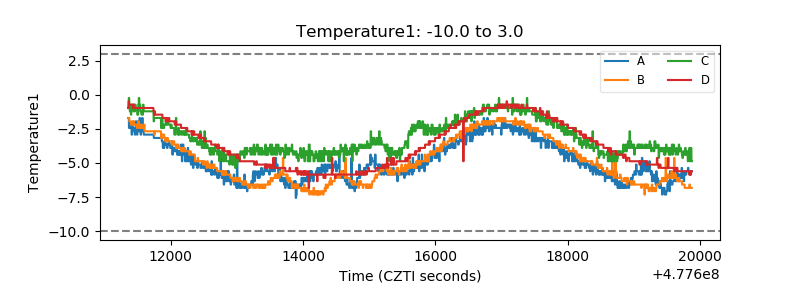 |
| Veto HV Monitor | 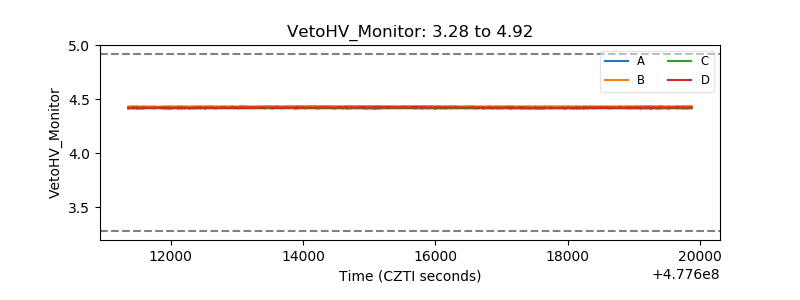 |
| Veto LLD | 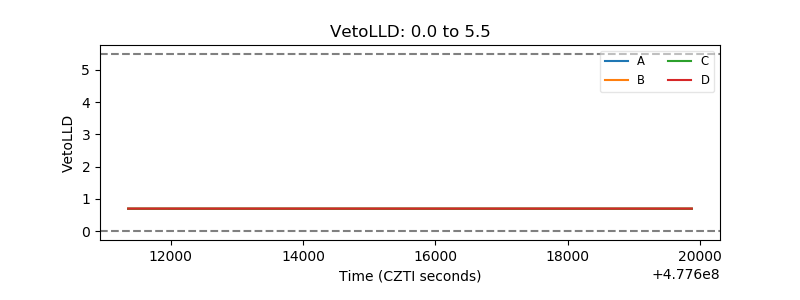 |
| Alpha Counter | 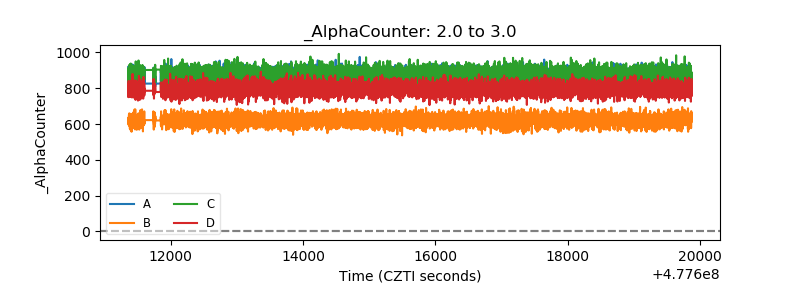 |
| _CPM_Rate | 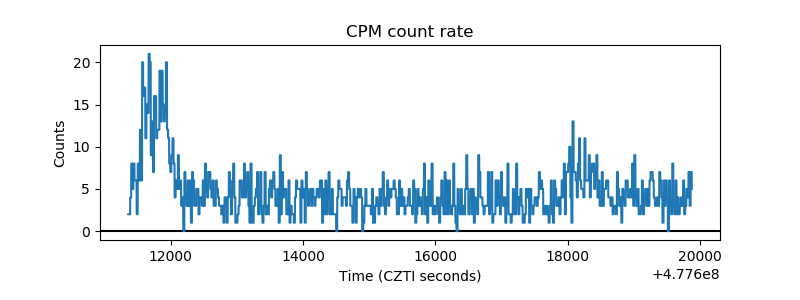 |
| CZT Counter | 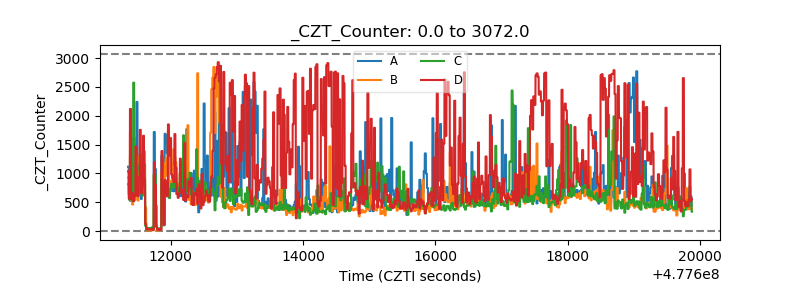 |
| +2.5 Volts monitor | 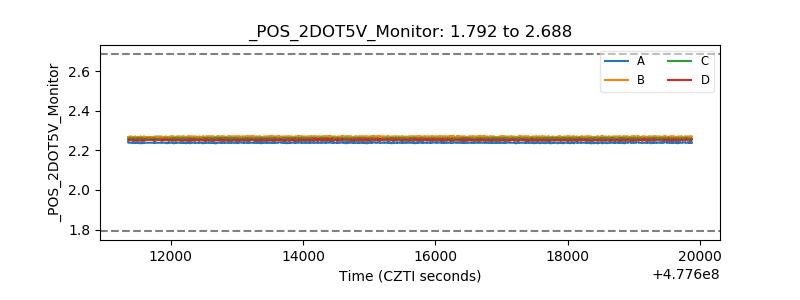 |
| +5 Volts monitor | 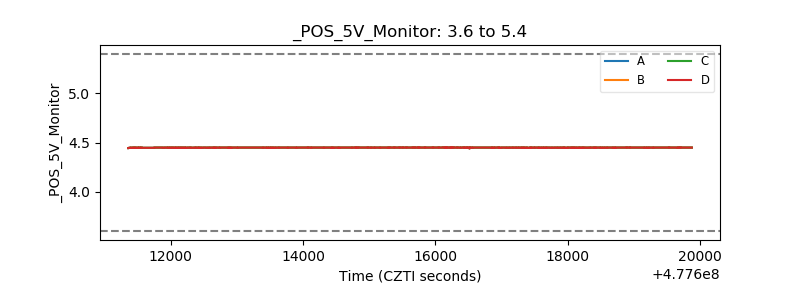 |
| _ROLL_ROT | 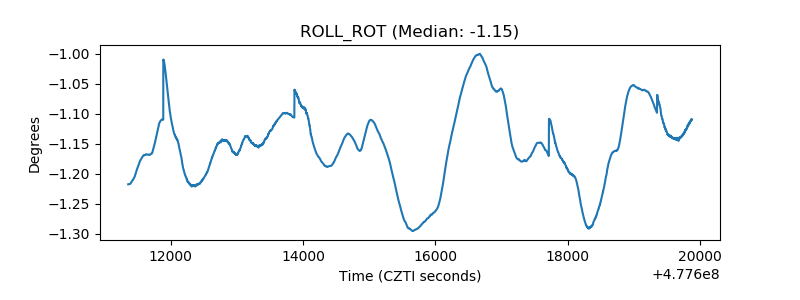 |
| _Roll_DEC | 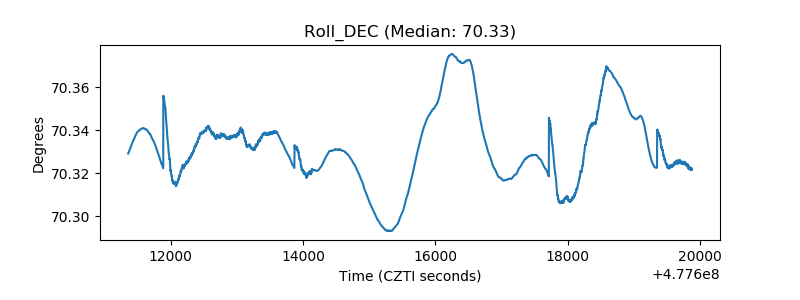 |
| _Roll_RA | 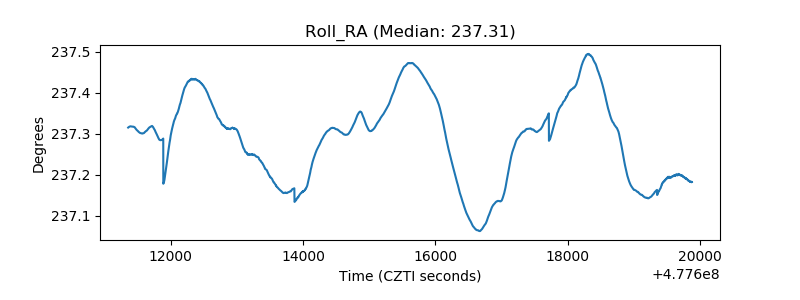 |
| Veto Counter | 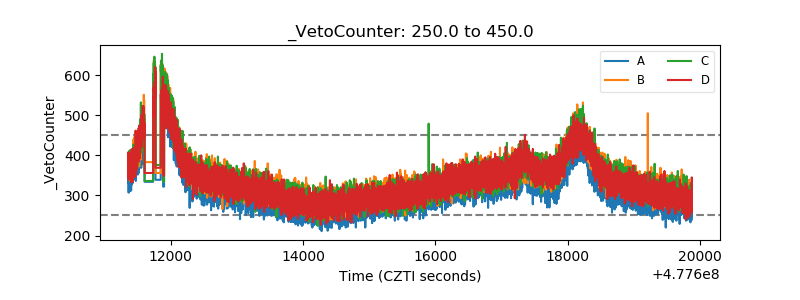 |