| Param | Original file | Final file |
|---|---|---|
| Filename | modeM0/AS1C07_001T01_9000006450_50821cztM0_level2.fits | modeM0/AS1C07_001T01_9000006450_50821cztM0_level2_quad_clean.evt |
| Size (bytes) | 1,647,826,560 | 266,627,520 |
| Size | 1.5 GB | 254.3 MB |
| Events in quadrant A | 15,047,700 | 1,711,466 |
| Events in quadrant B | 9,598,084 | 1,984,771 |
| Events in quadrant C | 17,834,965 | 1,487,061 |
| Events in quadrant D | 16,961,726 | 1,502,853 |
| Mode SS | |||
|---|---|---|---|
| Quadrant | BADHDUFLAG | Total packets | Discarded packets |
| A | 0 | 408 | 0 |
| B | 0 | 408 | 0 |
| C | 0 | 408 | 0 |
| D | 0 | 408 | 0 |
| Mode M0 | |||
|---|---|---|---|
| Quadrant | BADHDUFLAG | Total packets | Discarded packets |
| A | 0 | 58209 | 3 |
| B | 0 | 43461 | 3 |
| C | 0 | 67294 | 3 |
| D | 0 | 64666 | 3 |
| Mode M9 | |||
|---|---|---|---|
| Quadrant | BADHDUFLAG | Total packets | Discarded packets |
| A | 0 | 11 | 0 |
| B | 0 | 11 | 0 |
| C | 0 | 11 | 0 |
| D | 0 | 11 | 0 |
| Quadrant | Total seconds | Saturated seconds | Saturation percentage |
|---|---|---|---|
| A | 20120 | 1411 | 7.012922% |
| B | 20120 | 341 | 1.694831% |
| C | 20121 | 3102 | 15.416729% |
| D | 20121 | 1759 | 8.742110% |
Noise dominated data is calculated using 1-second bins in cleaned event files. If a bin has >2000 counts, and if more than 50% of those come from <1% of pixels, then it is considered to be noise-dominated and hence unusable.
| Quadrant | # 1 sec bins | Bins with >0 counts | Bins with >2000 counts | High rate bins dominated by noise | Noise dominated (total time) | Noise dominated (detector-on time) | Marked lightcurve |
|---|---|---|---|---|---|---|---|
| A | 21150 | 20123 | 978 | 978 | 4.62% | 4.86% | 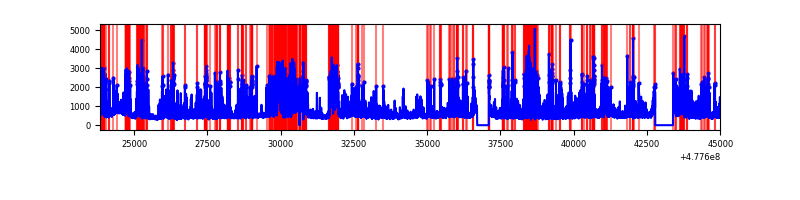 |
| B | 21150 | 20123 | 65 | 65 | 0.31% | 0.32% | 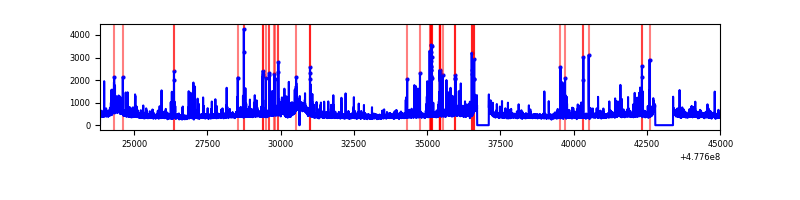 |
| C | 21151 | 20124 | 2187 | 2187 | 10.34% | 10.87% | 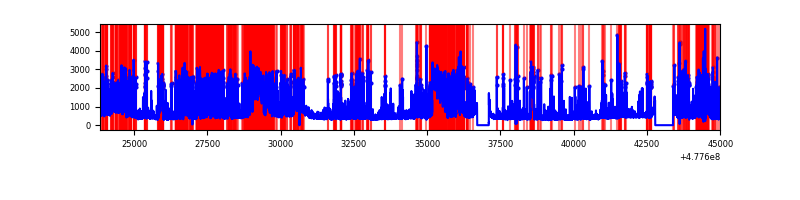 |
| D | 21151 | 20124 | 1449 | 1449 | 6.85% | 7.20% | 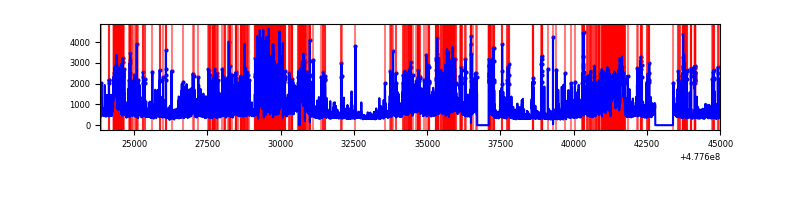 |
Top three noisy pixels from each quadrant. If the there are fewer than three noisy pixels in the level2.evt file, extra rows are filled as -1
| Pixel properties | Quadrant properties | ||||||
|---|---|---|---|---|---|---|---|
| Quadrant | DetID | PixID | Counts | Sigma | Mean | Median | Sigma |
| A | 4 | 13 | 2041993 | 3944.17 | 2097 | 2048 | 517.2 |
| A | 6 | 161 | 1539569 | 2972.75 | 2097 | 2048 | 517.2 |
| A | 14 | 254 | 879572 | 1696.67 | 2097 | 2048 | 517.2 |
| B | 5 | 185 | 135260 | 294.08 | 2137 | 2056 | 453.0 |
| B | 8 | 128 | 125893 | 273.4 | 2137 | 2056 | 453.0 |
| B | 7 | 252 | 105152 | 227.61 | 2137 | 2056 | 453.0 |
| C | 4 | 210 | 3419132 | 6392.01 | 1950 | 1933 | 534.6 |
| C | 15 | 147 | 1471238 | 2748.39 | 1950 | 1933 | 534.6 |
| C | 13 | 3 | 974691 | 1819.58 | 1950 | 1933 | 534.6 |
| D | 10 | 181 | 1007179 | 1799.37 | 1988 | 1922 | 558.7 |
| D | 15 | 154 | 956381 | 1708.44 | 1988 | 1922 | 558.7 |
| D | 2 | 249 | 927624 | 1656.97 | 1988 | 1922 | 558.7 |
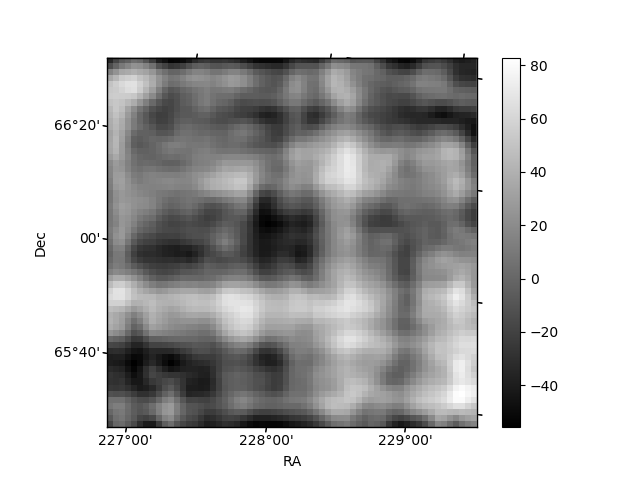
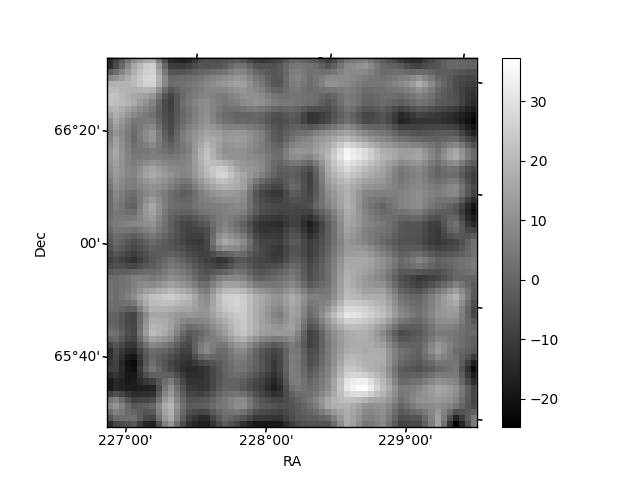
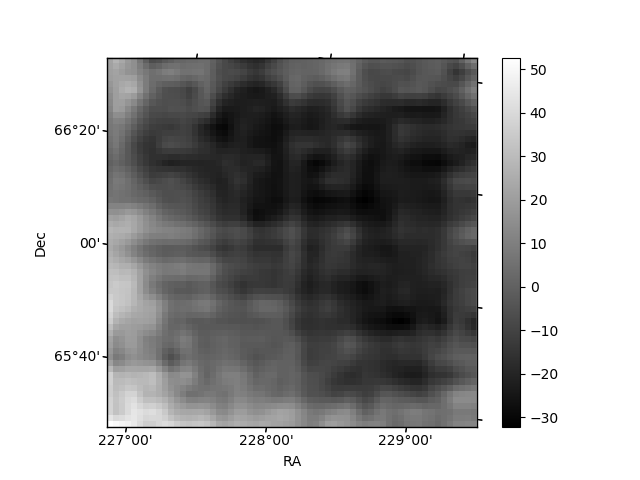
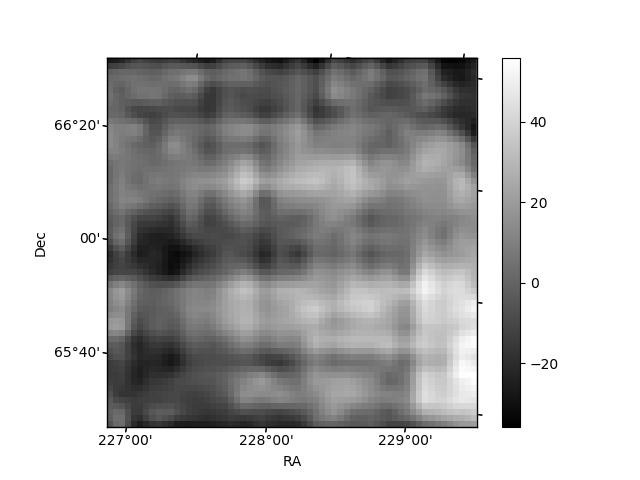
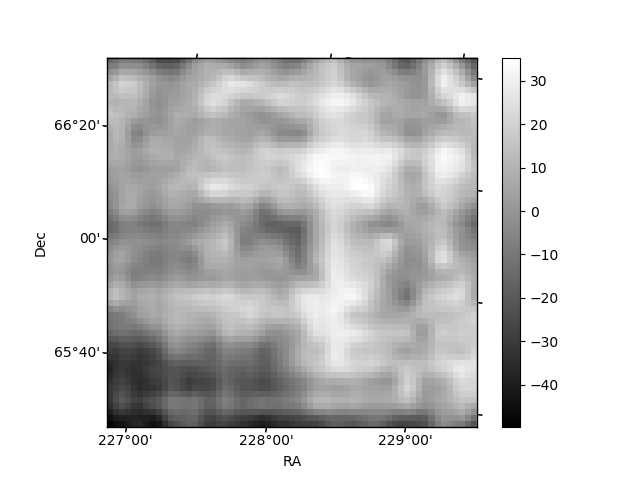
Histogram calculated using DETX and DETY for each event in the final _common_clean file
| Quadrant A | 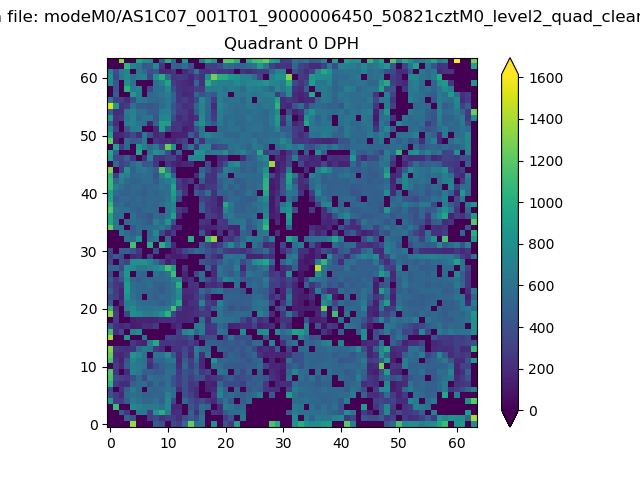 |
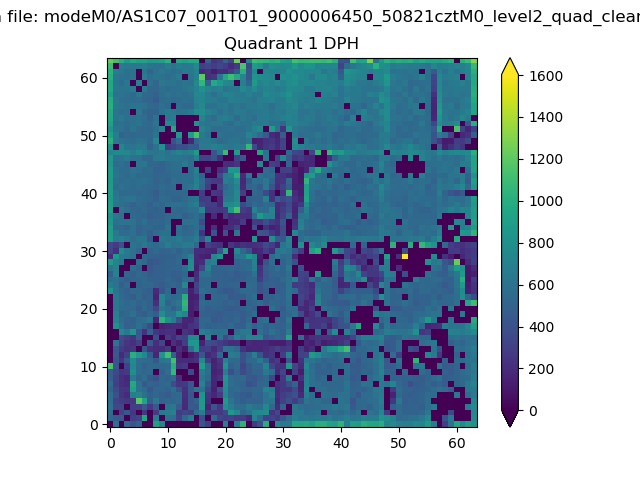 |
Quadrant B |
|---|---|---|---|
| Quadrant D | 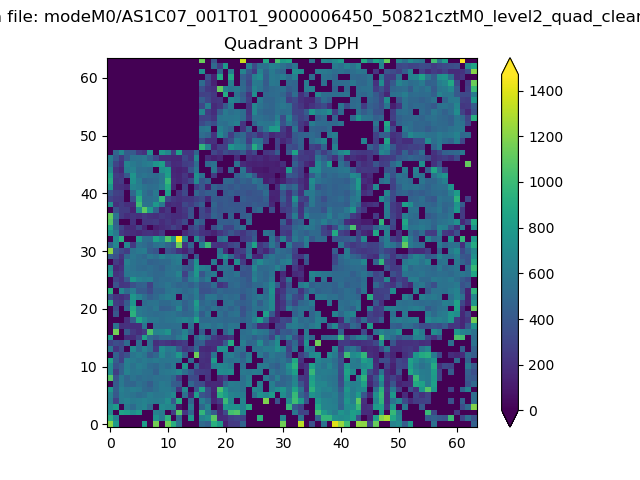 |
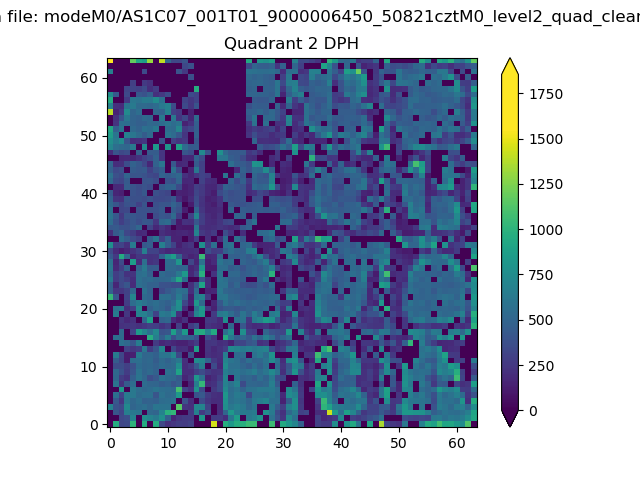 |
Quadrant C |
| Plot type | Count rate plots | Images |
|---|---|---|
| Comparison with Poisson distribution Blue bars denote a histogram of data divided into 1 sec bins. Red curve is a Poisson curve with rate = median count rate of data. |
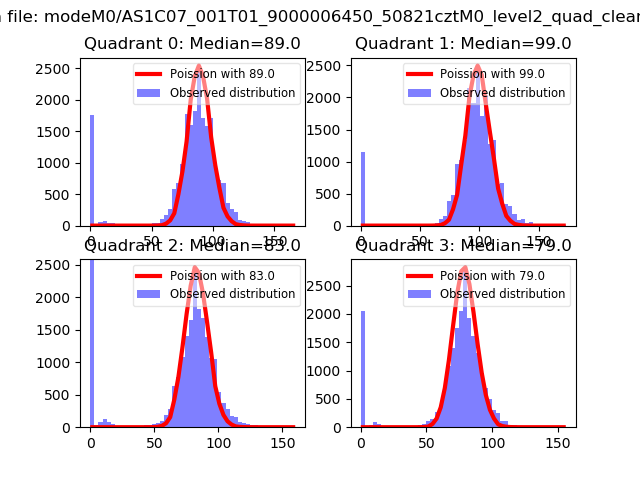 |
 |
| Quadrant-wise count rates Data is divided into 100 sec bins |
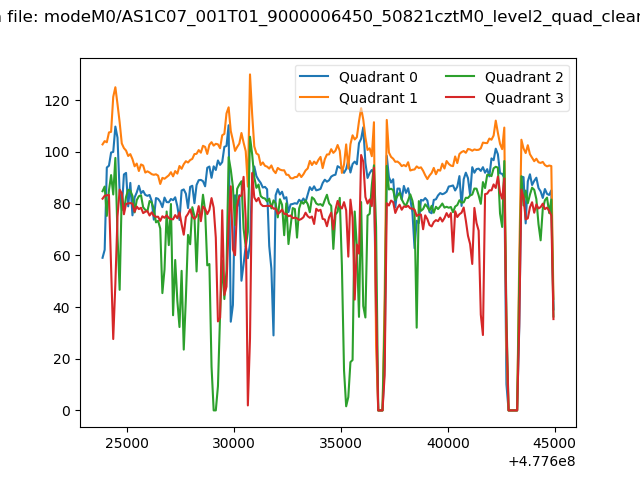 |
|
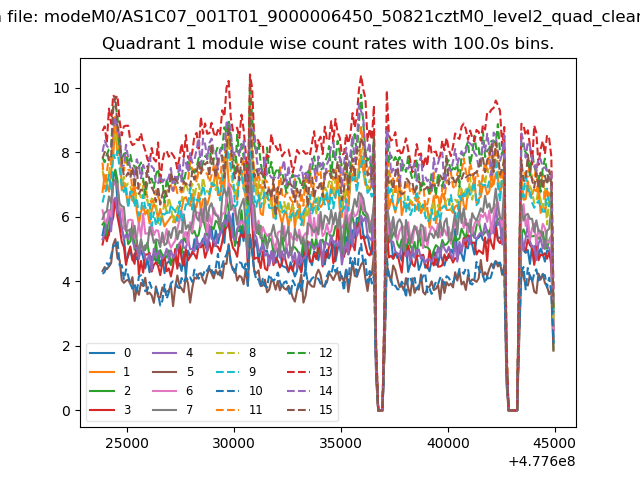
| Module-wise count rates for Quadrant A Data is divided into 100 sec bins |
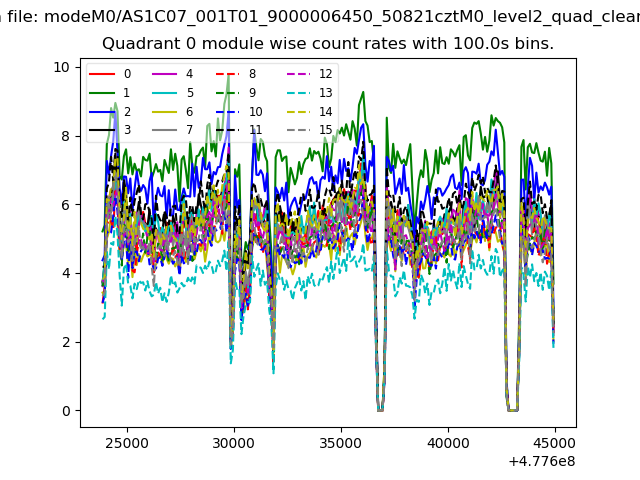 |
 |
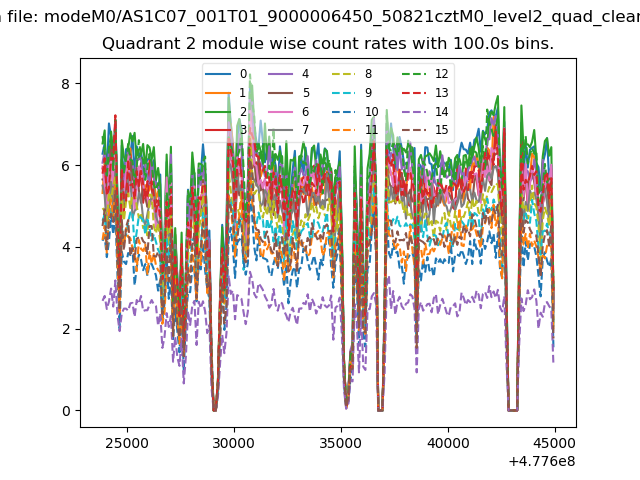
| Module-wise count rates for Quadrant B Data is divided into 100 sec bins |
 |
 |
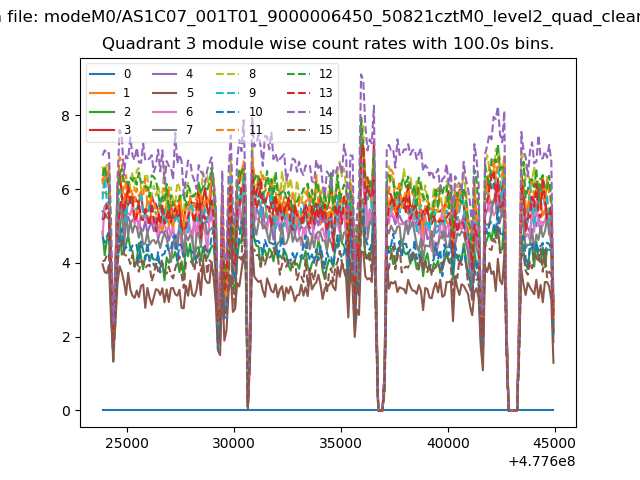
| Module-wise count rates for Quadrant C Data is divided into 100 sec bins |
 |
 |
| Module-wise count rates for Quadrant D Data is divided into 100 sec bins |
 |
 |
| Parameter | Plot |
|---|---|
| CZT HV Monitor | 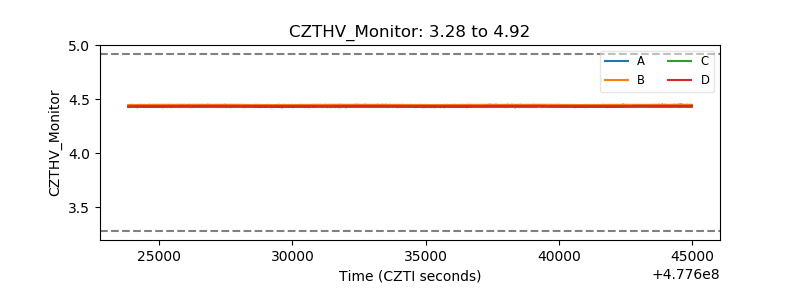 |
| D_VDD | 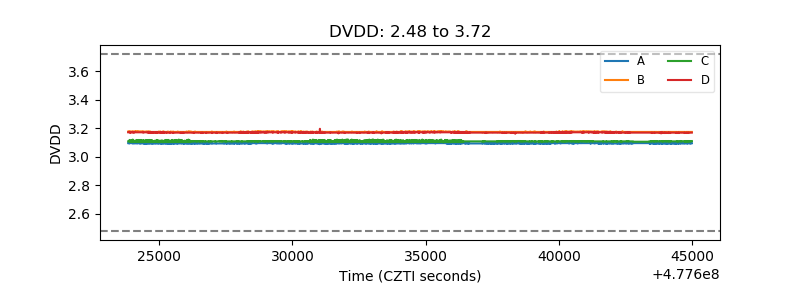 |
| Temperature 1 | 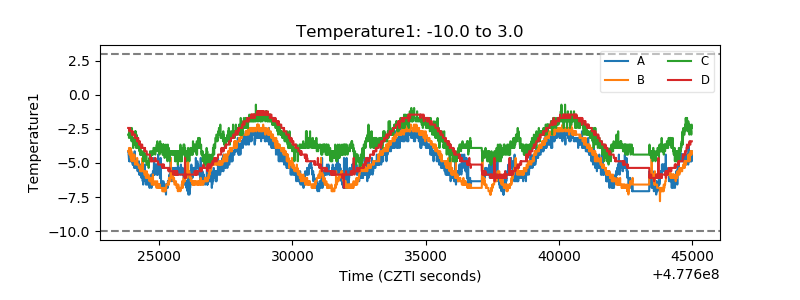 |
| Veto HV Monitor | 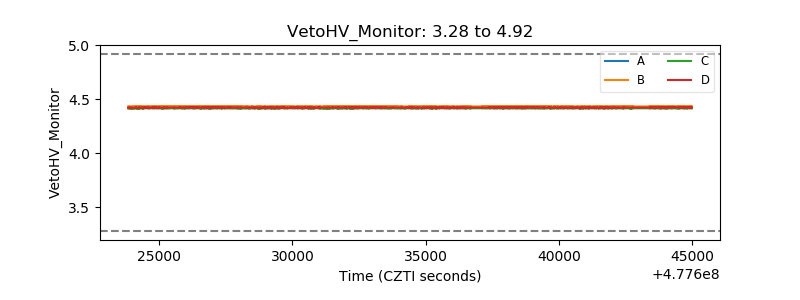 |
| Veto LLD | 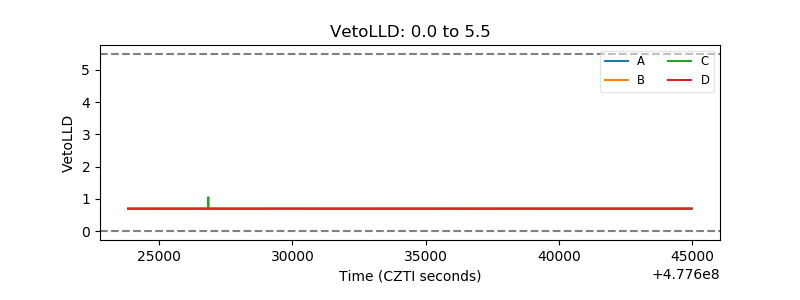 |
| Alpha Counter | 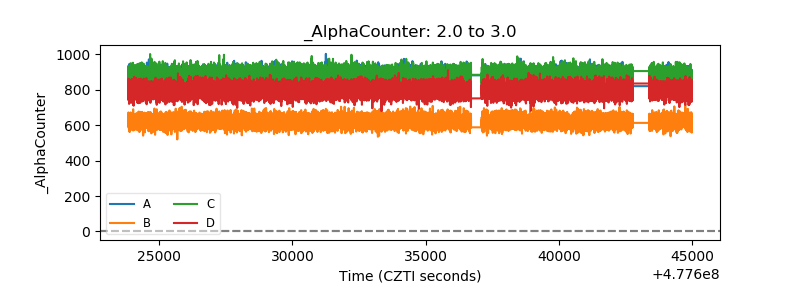 |
| _CPM_Rate | 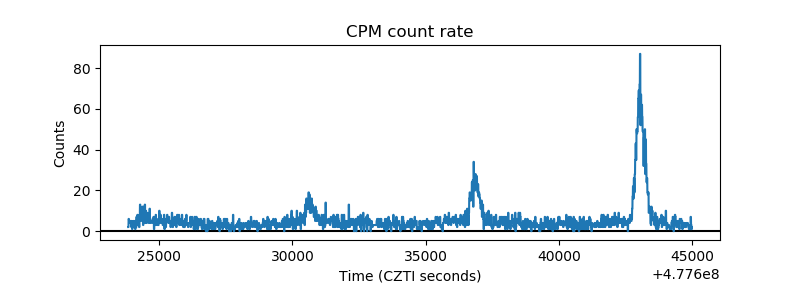 |
| CZT Counter | 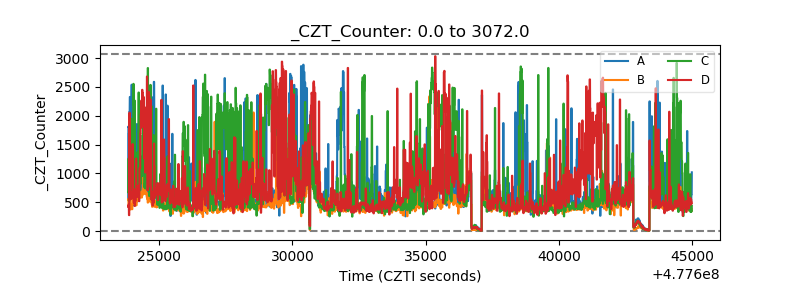 |
| +2.5 Volts monitor | 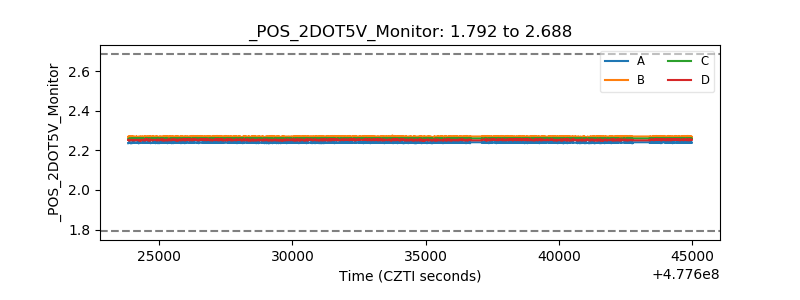 |
| +5 Volts monitor | 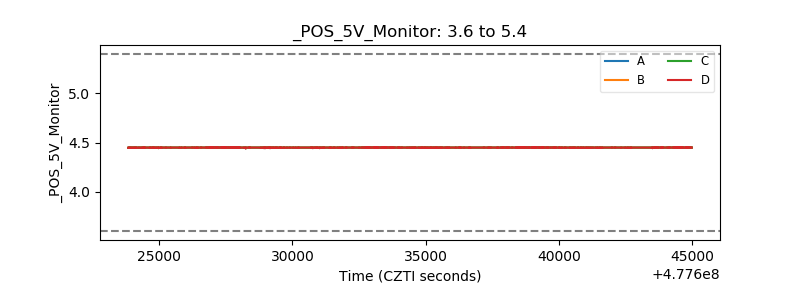 |
| _ROLL_ROT | 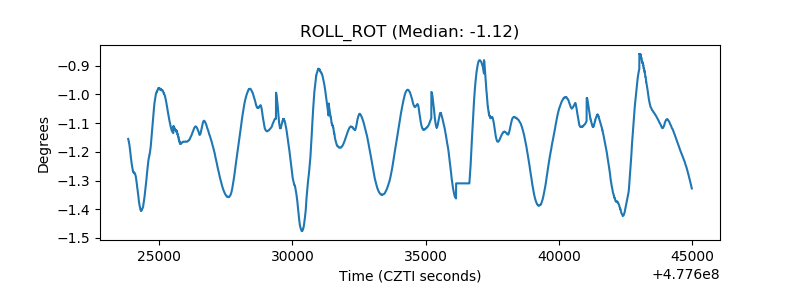 |
| _Roll_DEC | 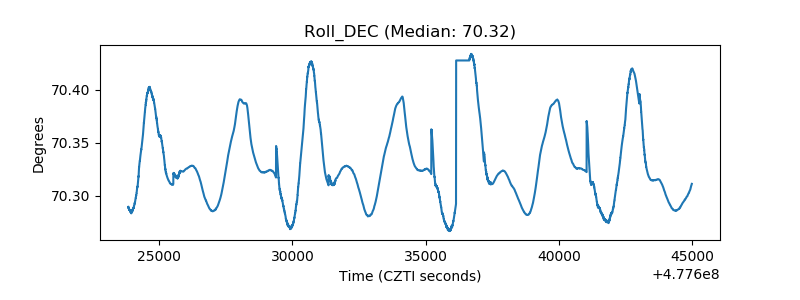 |
| _Roll_RA | 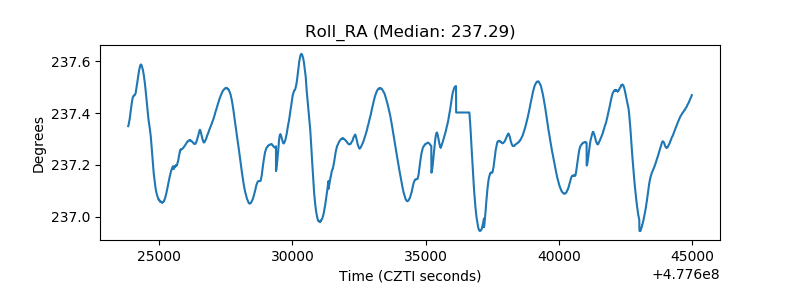 |
| Veto Counter | 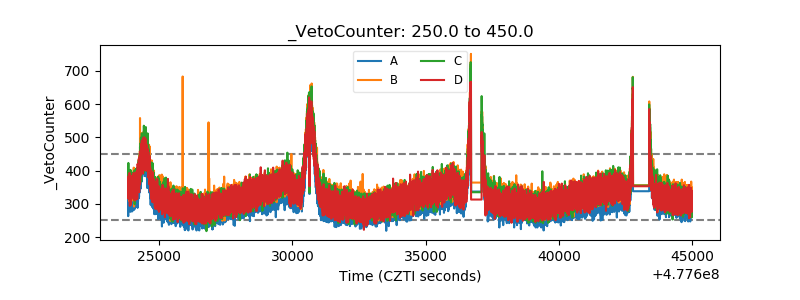 |