| Param | Original file | Final file |
|---|---|---|
| Filename | modeM0/AS1C07_001T01_9000006450_50847cztM0_level2.fits | modeM0/AS1C07_001T01_9000006450_50847cztM0_level2_quad_clean.evt |
| Size (bytes) | 716,071,680 | 115,416,000 |
| Size | 682.9 MB | 110.1 MB |
| Events in quadrant A | 6,382,892 | 742,106 |
| Events in quadrant B | 5,182,379 | 834,540 |
| Events in quadrant C | 6,661,400 | 691,414 |
| Events in quadrant D | 7,635,578 | 647,603 |
| Mode SS | |||
|---|---|---|---|
| Quadrant | BADHDUFLAG | Total packets | Discarded packets |
| A | 0 | 168 | 0 |
| B | 0 | 168 | 0 |
| C | 0 | 168 | 0 |
| D | 0 | 168 | 0 |
| Mode M0 | |||
|---|---|---|---|
| Quadrant | BADHDUFLAG | Total packets | Discarded packets |
| A | 0 | 24628 | 1 |
| B | 0 | 21260 | 0 |
| C | 0 | 25721 | 0 |
| D | 0 | 28519 | 0 |
| Quadrant | Total seconds | Saturated seconds | Saturation percentage |
|---|---|---|---|
| A | 8326 | 499 | 5.993274% |
| B | 8326 | 198 | 2.378093% |
| C | 8326 | 724 | 8.695652% |
| D | 8326 | 801 | 9.620466% |
Noise dominated data is calculated using 1-second bins in cleaned event files. If a bin has >2000 counts, and if more than 50% of those come from <1% of pixels, then it is considered to be noise-dominated and hence unusable.
| Quadrant | # 1 sec bins | Bins with >0 counts | Bins with >2000 counts | High rate bins dominated by noise | Noise dominated (total time) | Noise dominated (detector-on time) | Marked lightcurve |
|---|---|---|---|---|---|---|---|
| A | 8326 | 8326 | 519 | 519 | 6.23% | 6.23% | 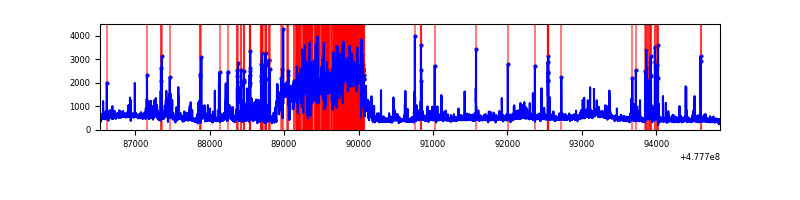 |
| B | 8326 | 8326 | 126 | 126 | 1.51% | 1.51% | 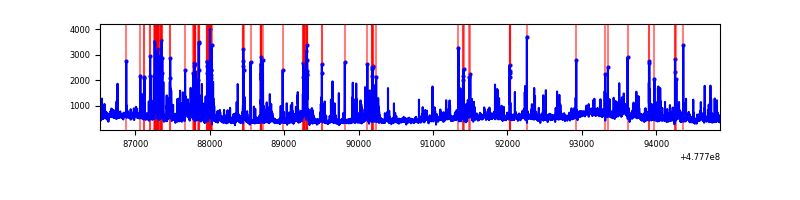 |
| C | 8326 | 8326 | 504 | 504 | 6.05% | 6.05% | 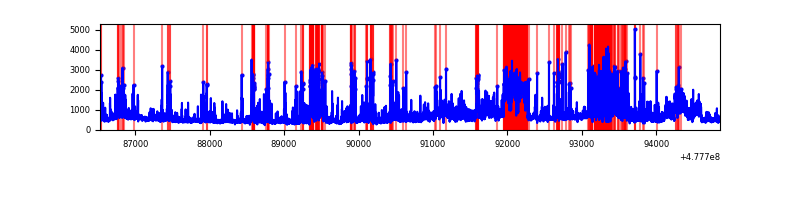 |
| D | 8326 | 8326 | 642 | 642 | 7.71% | 7.71% | 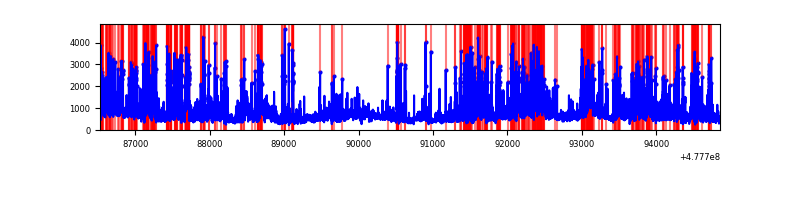 |
Top three noisy pixels from each quadrant. If the there are fewer than three noisy pixels in the level2.evt file, extra rows are filled as -1
| Pixel properties | Quadrant properties | ||||||
|---|---|---|---|---|---|---|---|
| Quadrant | DetID | PixID | Counts | Sigma | Mean | Median | Sigma |
| A | 12 | 80 | 1223659 | 5719.95 | 864 | 844 | 213.8 |
| A | 3 | 130 | 904070 | 4225.01 | 864 | 844 | 213.8 |
| A | 14 | 254 | 161372 | 750.9 | 864 | 844 | 213.8 |
| B | 4 | 206 | 667288 | 3554.54 | 879 | 845 | 187.5 |
| B | 5 | 172 | 397353 | 2114.81 | 879 | 845 | 187.5 |
| B | 7 | 252 | 113086 | 598.65 | 879 | 845 | 187.5 |
| C | 5 | 10 | 513488 | 2258.54 | 835 | 829 | 227.0 |
| C | 4 | 210 | 470587 | 2069.53 | 835 | 829 | 227.0 |
| C | 15 | 158 | 467104 | 2054.19 | 835 | 829 | 227.0 |
| D | 10 | 181 | 717734 | 3126.94 | 825 | 797 | 229.3 |
| D | 2 | 249 | 390708 | 1700.61 | 825 | 797 | 229.3 |
| D | 6 | 191 | 362065 | 1575.68 | 825 | 797 | 229.3 |
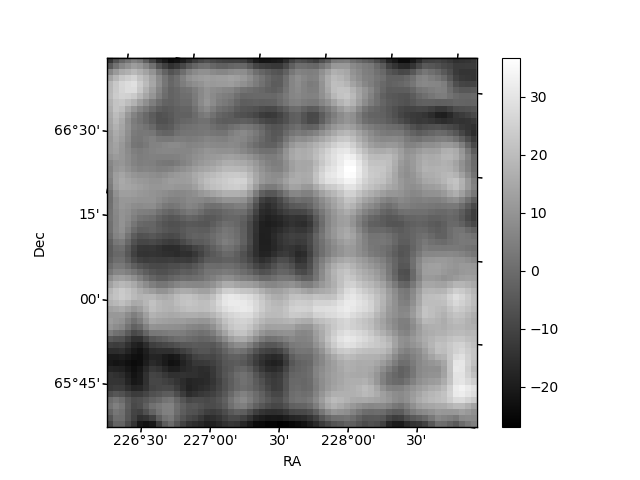
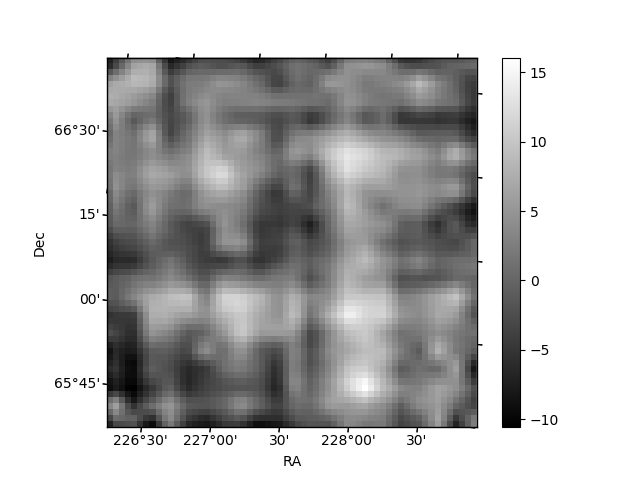
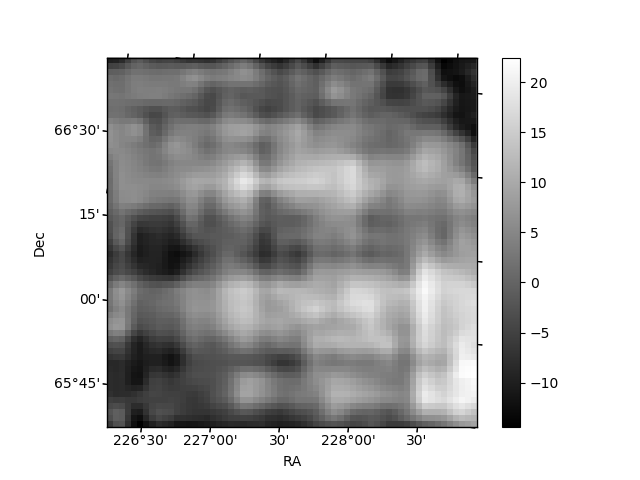
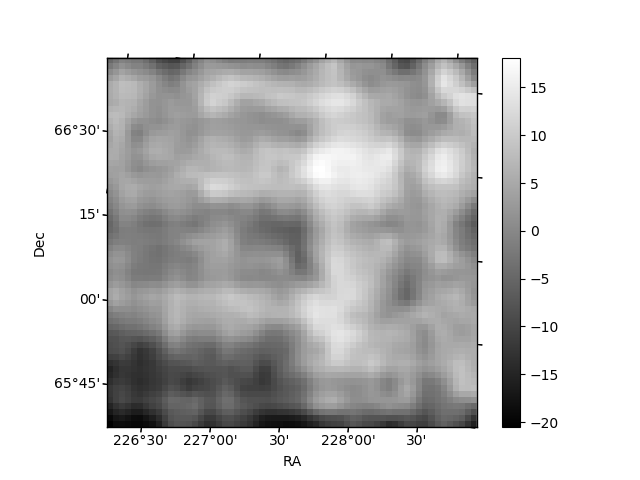
Histogram calculated using DETX and DETY for each event in the final _common_clean file
| Quadrant A | 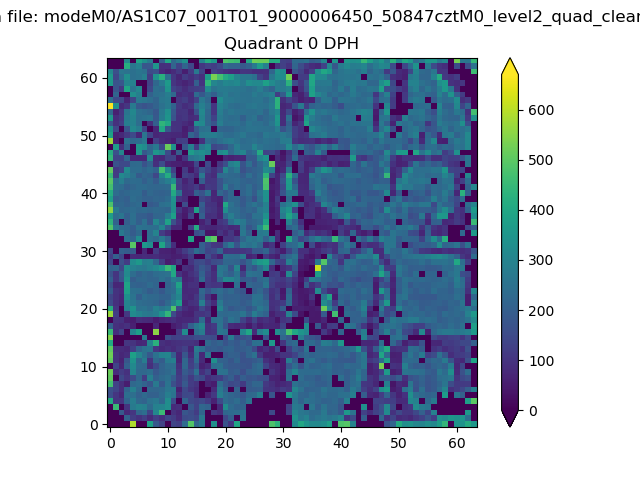 |
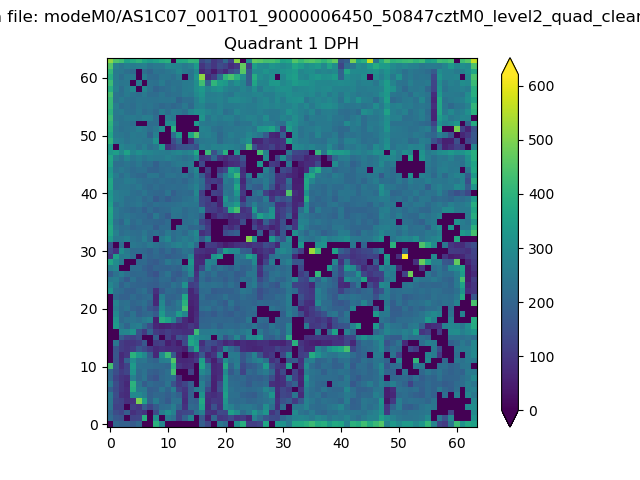 |
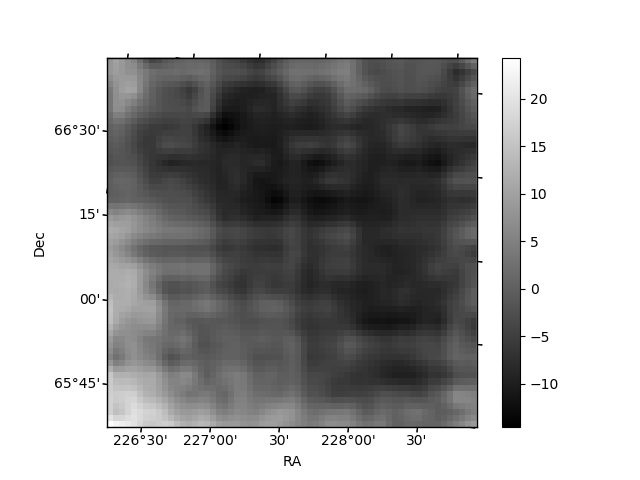
Quadrant B |
|---|---|---|---|
| Quadrant D | 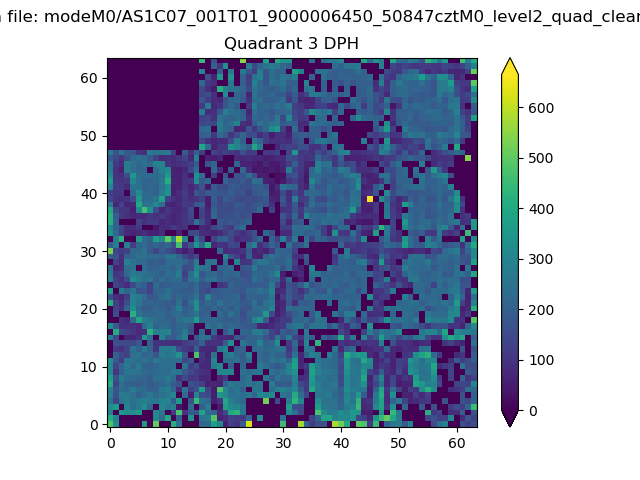 |
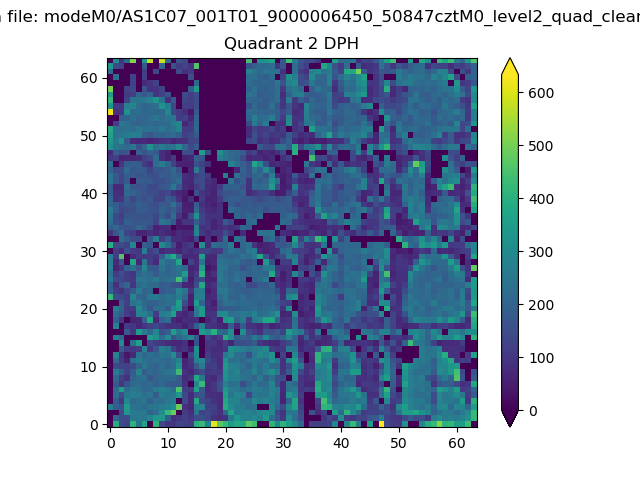 |
Quadrant C |
| Plot type | Count rate plots | Images |
|---|---|---|
| Comparison with Poisson distribution Blue bars denote a histogram of data divided into 1 sec bins. Red curve is a Poisson curve with rate = median count rate of data. |
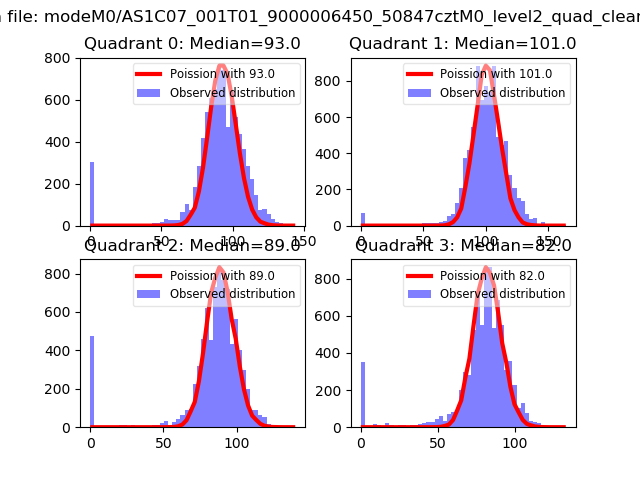 |
 |
| Quadrant-wise count rates Data is divided into 100 sec bins |
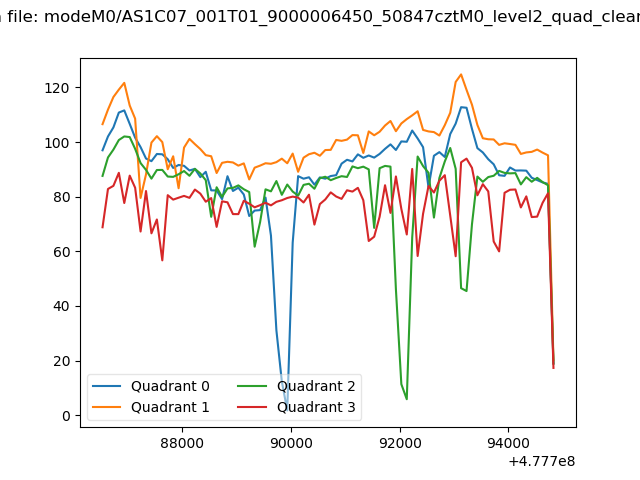 |
|
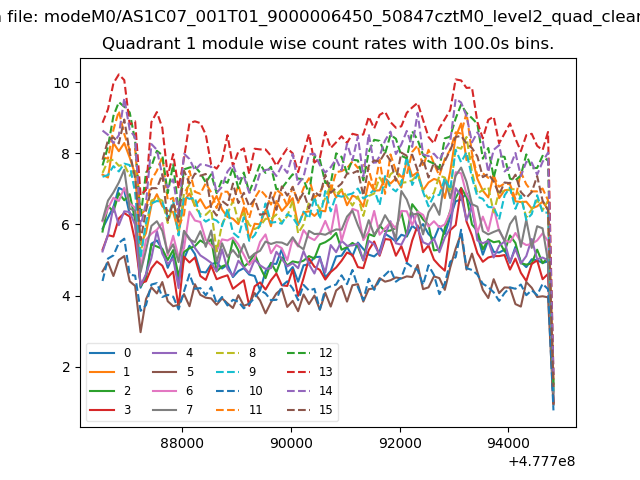
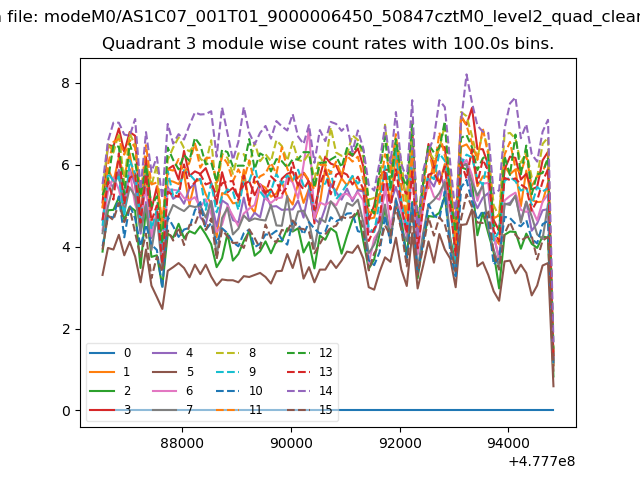
| Module-wise count rates for Quadrant A Data is divided into 100 sec bins |
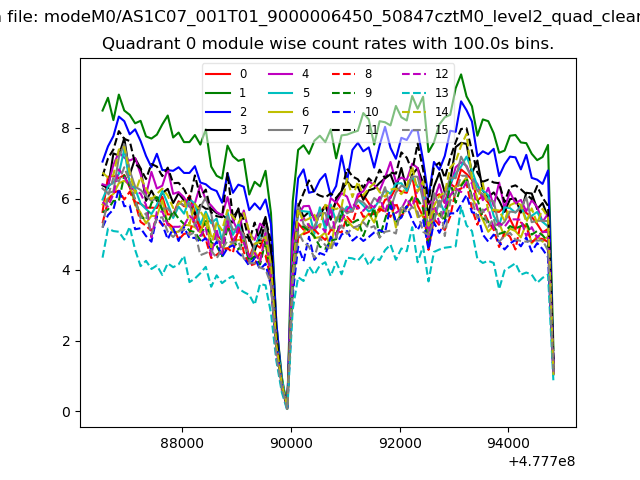 |
 |
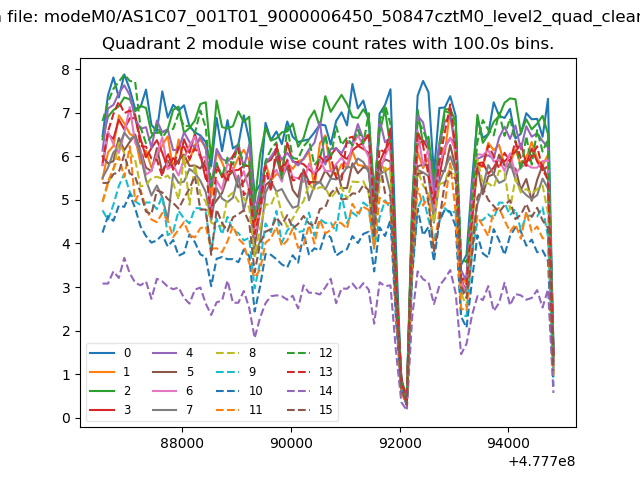
| Module-wise count rates for Quadrant B Data is divided into 100 sec bins |
 |
 |
| Module-wise count rates for Quadrant C Data is divided into 100 sec bins |
 |
 |
| Module-wise count rates for Quadrant D Data is divided into 100 sec bins |
 |
 |
| Parameter | Plot |
|---|---|
| CZT HV Monitor | 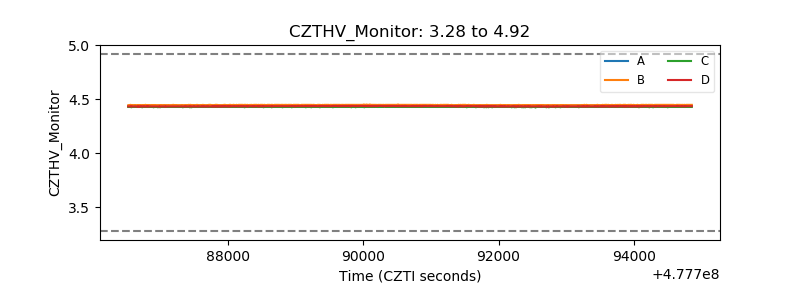 |
| D_VDD | 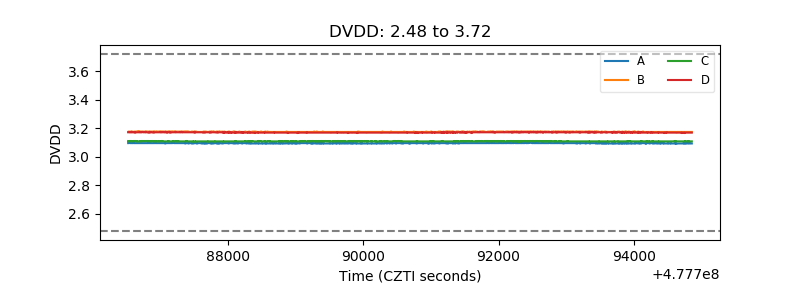 |
| Temperature 1 | 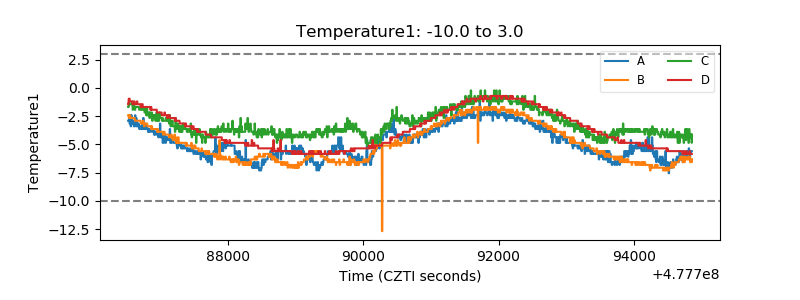 |
| Veto HV Monitor | 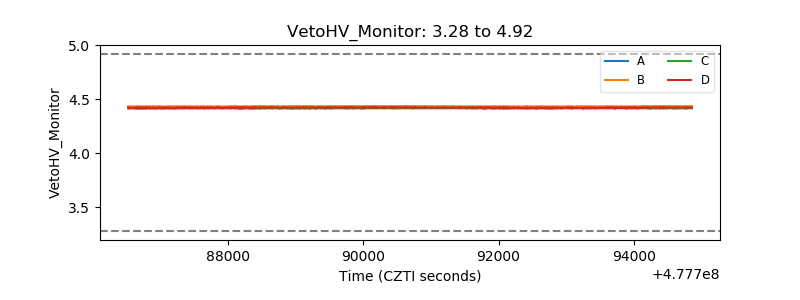 |
| Veto LLD | 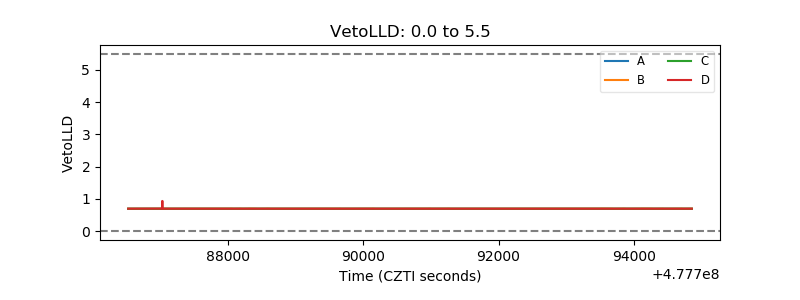 |
| Alpha Counter | 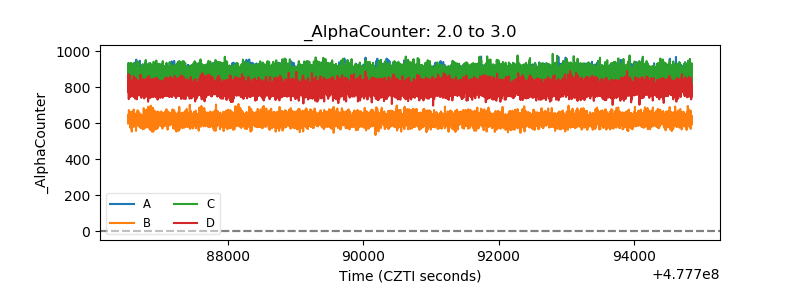 |
| _CPM_Rate | 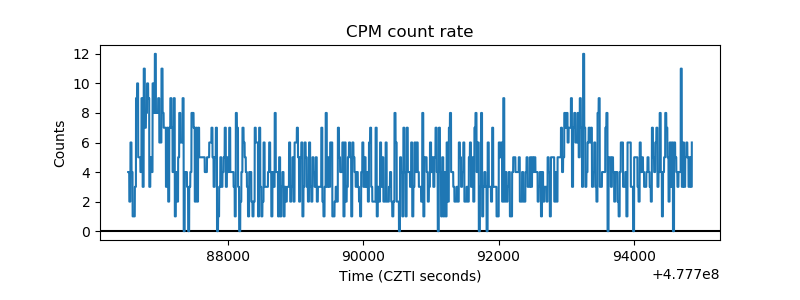 |
| CZT Counter | 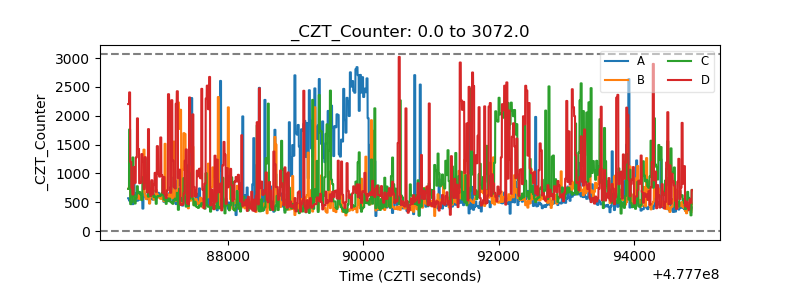 |
| +2.5 Volts monitor | 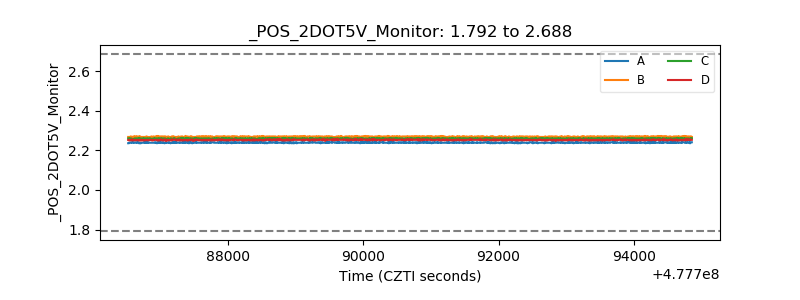 |
| +5 Volts monitor | 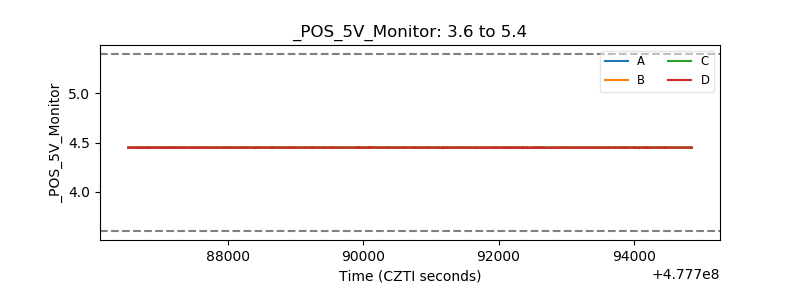 |
| _ROLL_ROT | 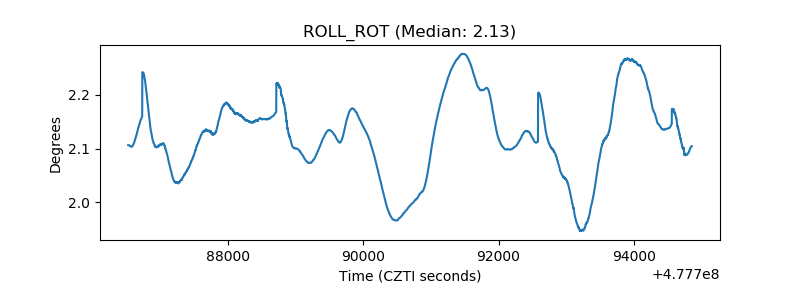 |
| _Roll_DEC | 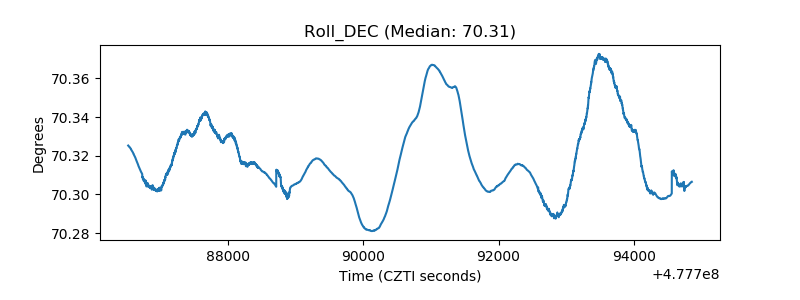 |
| _Roll_RA | 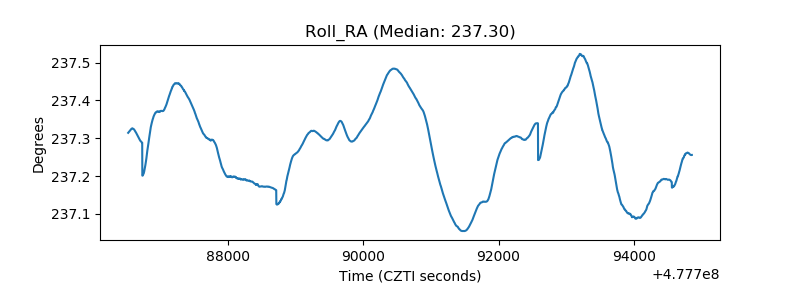 |
| Veto Counter | 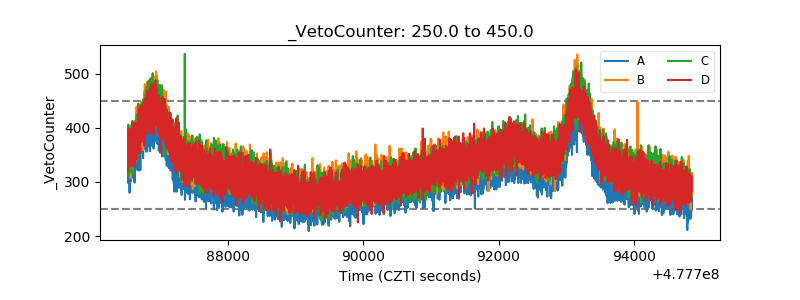 |