| Param | Original file | Final file |
|---|---|---|
| Filename | modeM0/AS1C07_001T01_9000006450_50851cztM0_level2.fits | modeM0/AS1C07_001T01_9000006450_50851cztM0_level2_quad_clean.evt |
| Size (bytes) | 523,100,160 | 96,989,760 |
| Size | 498.9 MB | 92.5 MB |
| Events in quadrant A | 5,018,129 | 626,887 |
| Events in quadrant B | 4,831,478 | 672,522 |
| Events in quadrant C | 4,768,999 | 599,112 |
| Events in quadrant D | 4,208,846 | 556,592 |
| Mode SS | |||
|---|---|---|---|
| Quadrant | BADHDUFLAG | Total packets | Discarded packets |
| A | 0 | 140 | 0 |
| B | 0 | 140 | 0 |
| C | 0 | 140 | 0 |
| D | 0 | 140 | 0 |
| Mode M0 | |||
|---|---|---|---|
| Quadrant | BADHDUFLAG | Total packets | Discarded packets |
| A | 0 | 19747 | 1 |
| B | 0 | 19160 | 1 |
| C | 0 | 18876 | 1 |
| D | 0 | 17463 | 1 |
| Mode M9 | |||
|---|---|---|---|
| Quadrant | BADHDUFLAG | Total packets | Discarded packets |
| A | 0 | 8 | 0 |
| B | 0 | 8 | 0 |
| C | 0 | 8 | 0 |
| D | 0 | 8 | 0 |
| Quadrant | Total seconds | Saturated seconds | Saturation percentage |
|---|---|---|---|
| A | 6911 | 234 | 3.385907% |
| B | 6912 | 277 | 4.007523% |
| C | 6912 | 255 | 3.689236% |
| D | 6912 | 267 | 3.862847% |
Noise dominated data is calculated using 1-second bins in cleaned event files. If a bin has >2000 counts, and if more than 50% of those come from <1% of pixels, then it is considered to be noise-dominated and hence unusable.
| Quadrant | # 1 sec bins | Bins with >0 counts | Bins with >2000 counts | High rate bins dominated by noise | Noise dominated (total time) | Noise dominated (detector-on time) | Marked lightcurve |
|---|---|---|---|---|---|---|---|
| A | 7696 | 6912 | 151 | 151 | 1.96% | 2.18% | 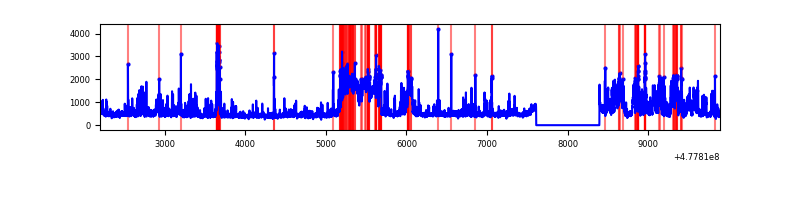 |
| B | 7697 | 6912 | 145 | 145 | 1.88% | 2.10% | 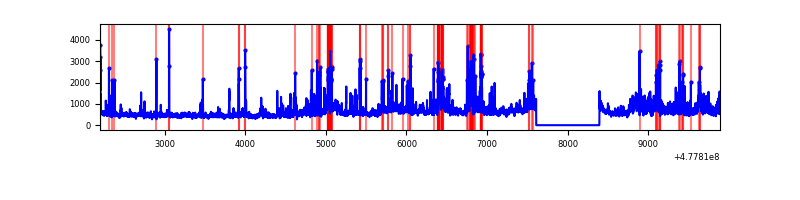 |
| C | 7697 | 6913 | 208 | 208 | 2.70% | 3.01% | 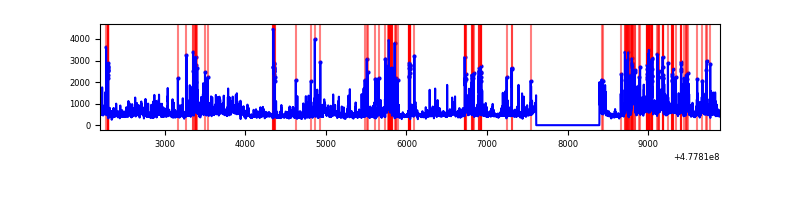 |
| D | 7697 | 6913 | 212 | 212 | 2.75% | 3.07% | 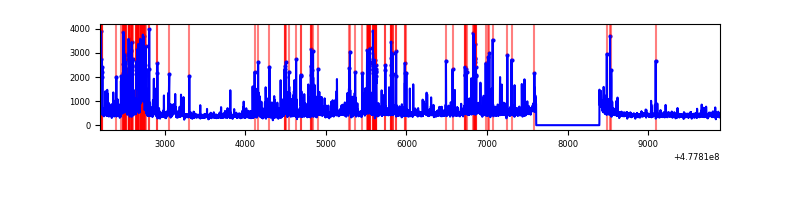 |
Top three noisy pixels from each quadrant. If the there are fewer than three noisy pixels in the level2.evt file, extra rows are filled as -1
| Pixel properties | Quadrant properties | ||||||
|---|---|---|---|---|---|---|---|
| Quadrant | DetID | PixID | Counts | Sigma | Mean | Median | Sigma |
| A | 12 | 80 | 1400144 | 7973.68 | 717 | 696 | 175.5 |
| A | 4 | 191 | 152092 | 862.61 | 717 | 696 | 175.5 |
| A | 8 | 249 | 149065 | 845.37 | 717 | 696 | 175.5 |
| B | 5 | 172 | 1027886 | 6799.32 | 707 | 682 | 151.1 |
| B | 8 | 128 | 285858 | 1887.65 | 707 | 682 | 151.1 |
| B | 10 | 44 | 215261 | 1420.35 | 707 | 682 | 151.1 |
| C | 4 | 5 | 381482 | 2025.54 | 686 | 680 | 188.0 |
| C | 1 | 60 | 249239 | 1322.12 | 686 | 680 | 188.0 |
| C | 10 | 171 | 227424 | 1206.08 | 686 | 680 | 188.0 |
| D | 2 | 216 | 458764 | 2421.15 | 679 | 656 | 189.2 |
| D | 2 | 153 | 259631 | 1368.71 | 679 | 656 | 189.2 |
| D | 2 | 249 | 233538 | 1230.81 | 679 | 656 | 189.2 |
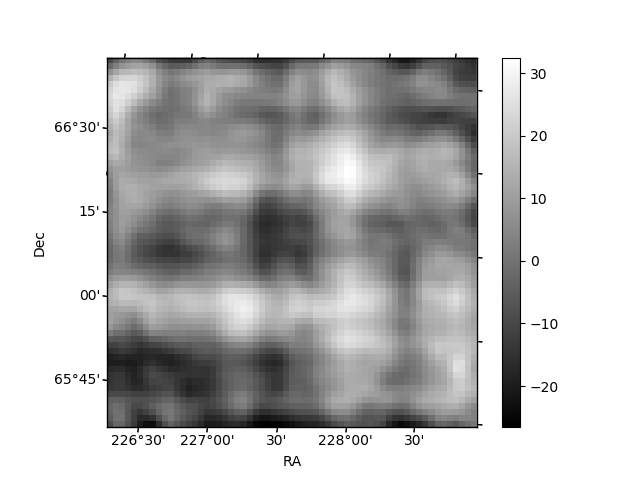
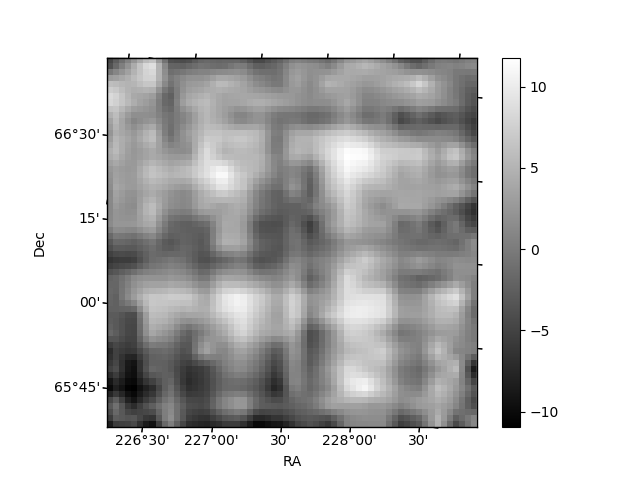
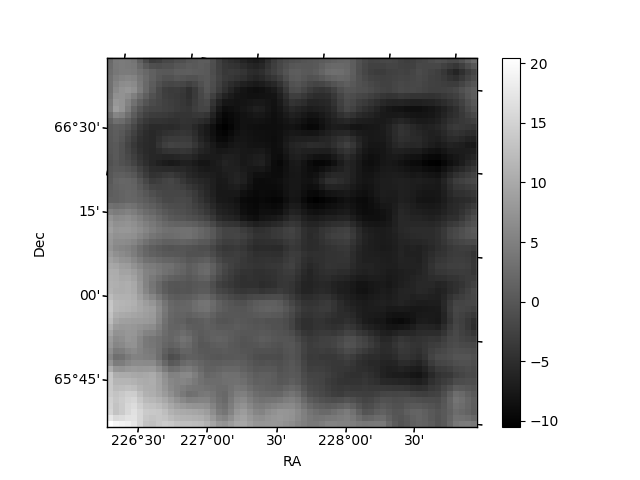
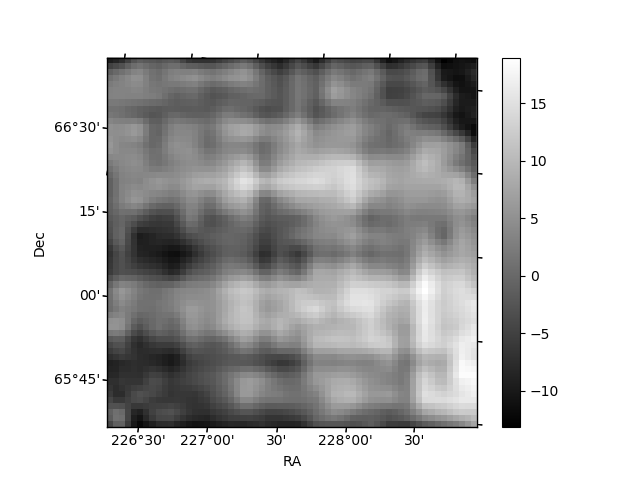
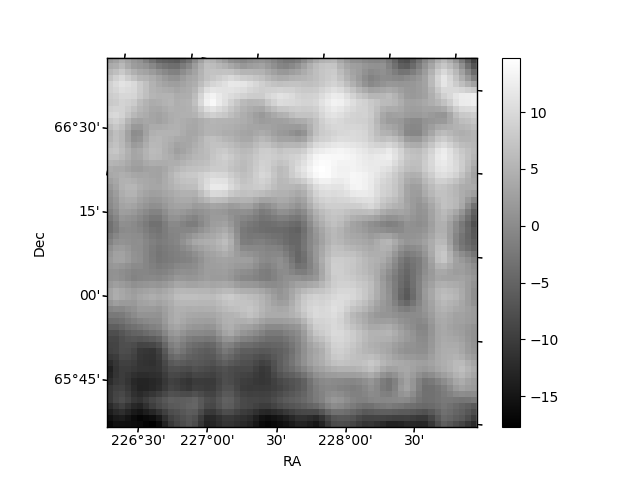
Histogram calculated using DETX and DETY for each event in the final _common_clean file
| Quadrant A | 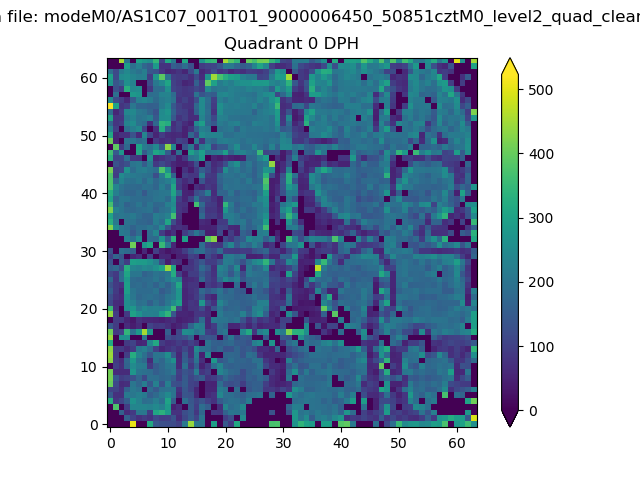 |
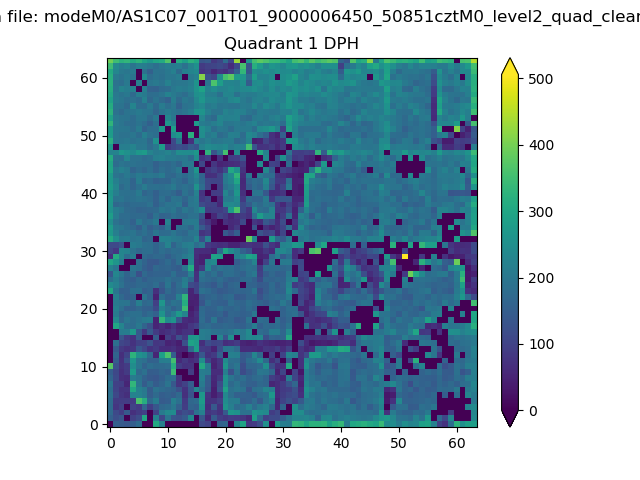 |
Quadrant B |
|---|---|---|---|
| Quadrant D | 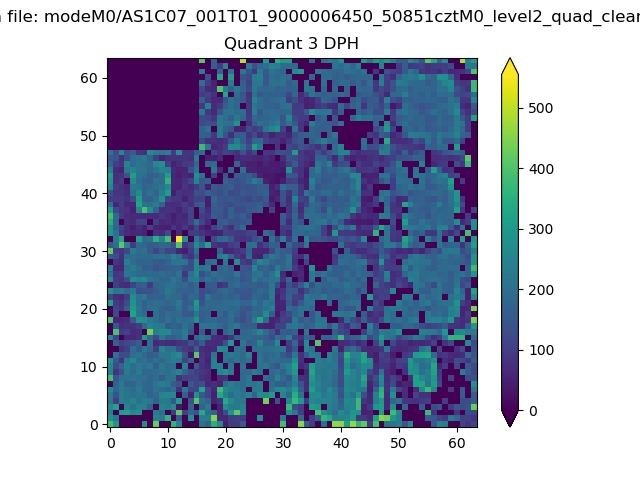 |
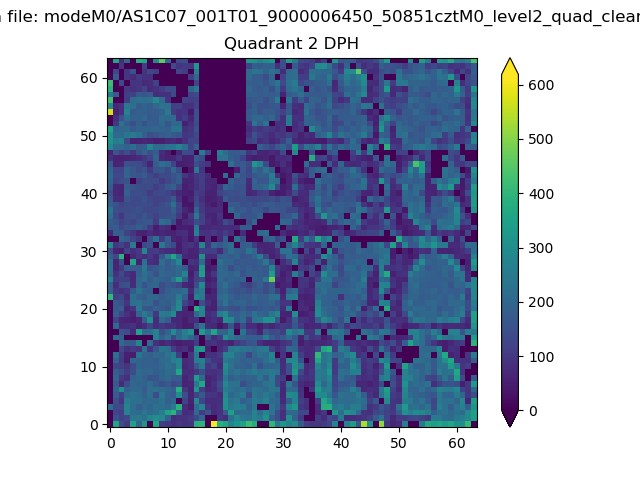 |
Quadrant C |
| Plot type | Count rate plots | Images |
|---|---|---|
| Comparison with Poisson distribution Blue bars denote a histogram of data divided into 1 sec bins. Red curve is a Poisson curve with rate = median count rate of data. |
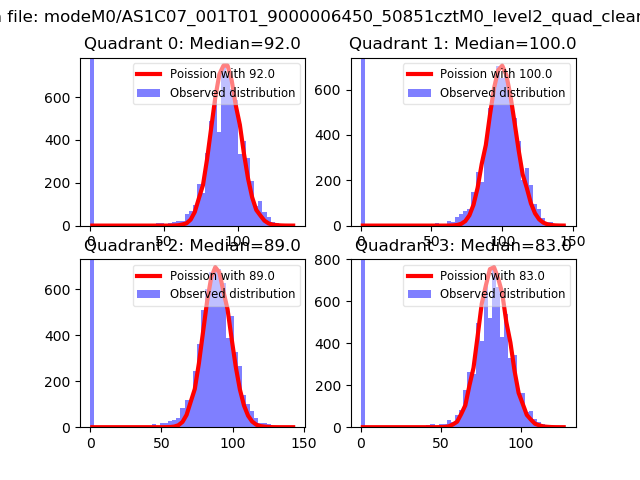 |
 |
| Quadrant-wise count rates Data is divided into 100 sec bins |
 |
|
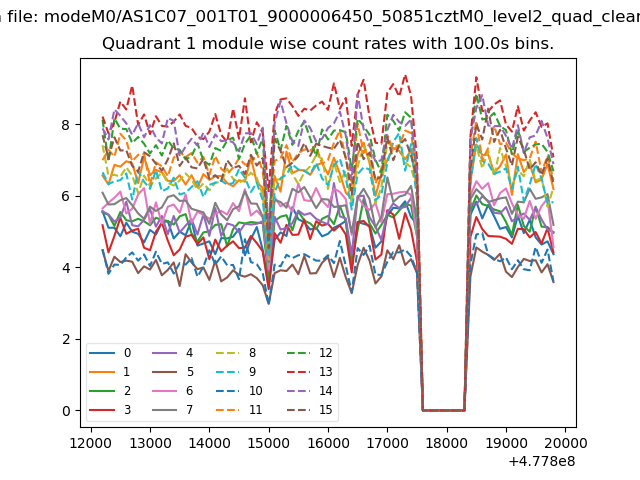
| Module-wise count rates for Quadrant A Data is divided into 100 sec bins |
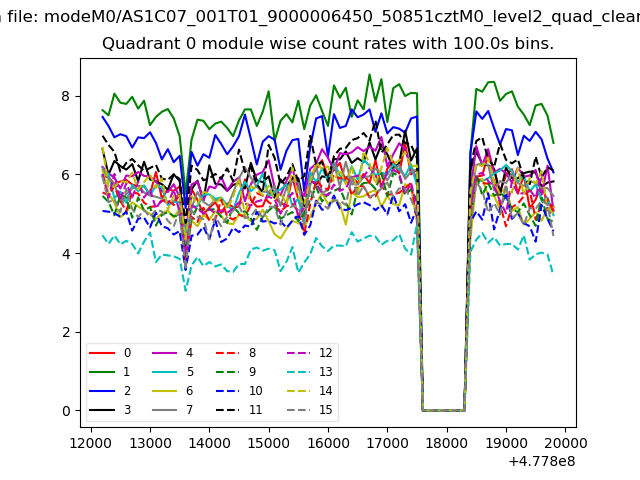 |
 |
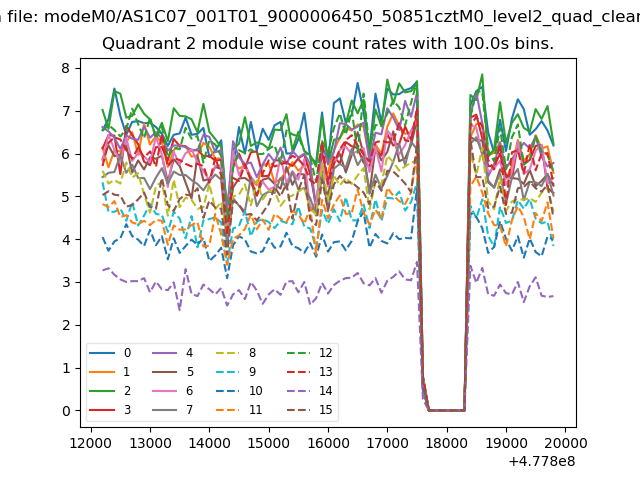
| Module-wise count rates for Quadrant B Data is divided into 100 sec bins |
 |
 |
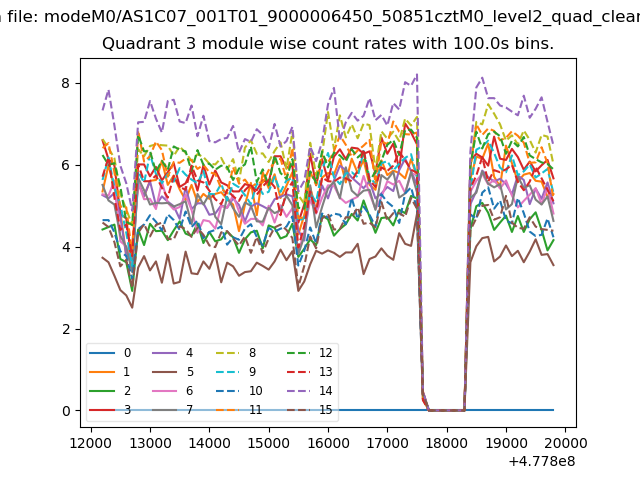
| Module-wise count rates for Quadrant C Data is divided into 100 sec bins |
 |
 |
| Module-wise count rates for Quadrant D Data is divided into 100 sec bins |
 |
 |
| Parameter | Plot |
|---|---|
| CZT HV Monitor | 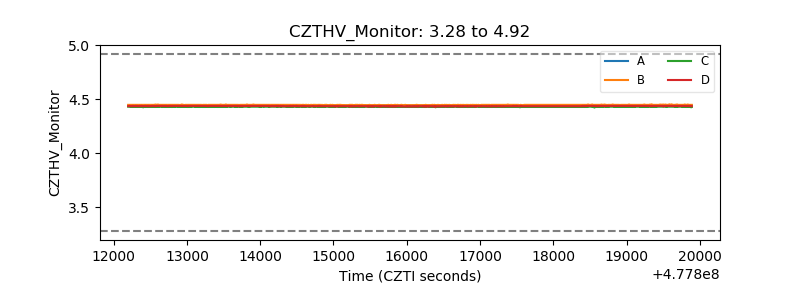 |
| D_VDD | 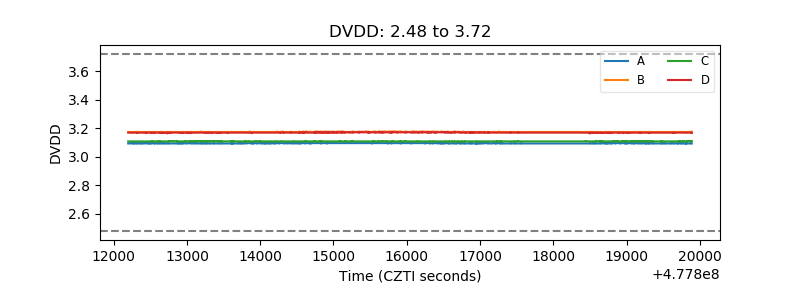 |
| Temperature 1 | 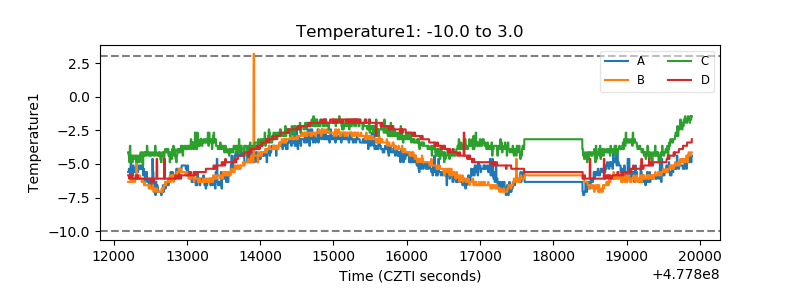 |
| Veto HV Monitor | 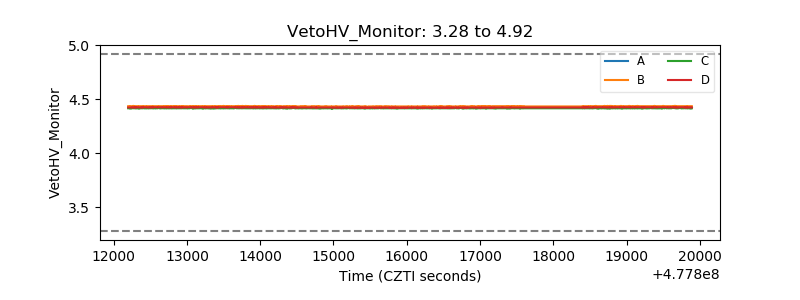 |
| Veto LLD | 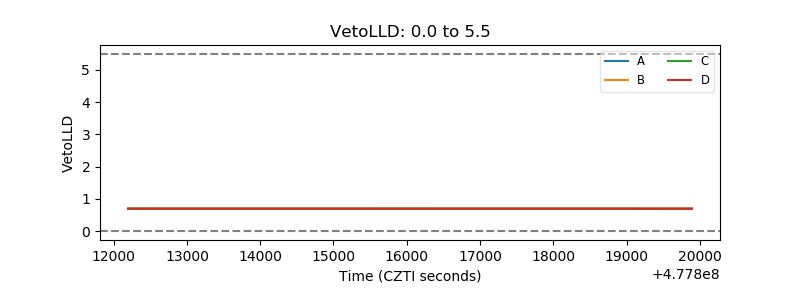 |
| Alpha Counter | 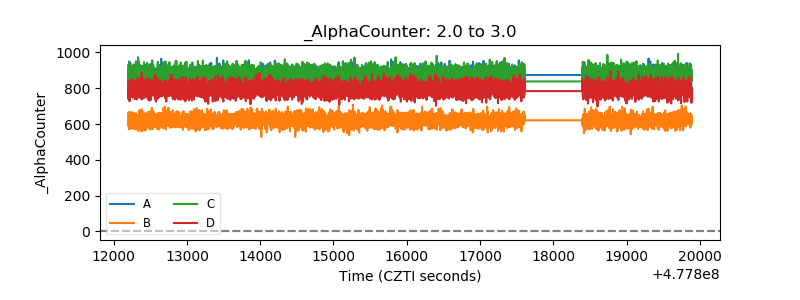 |
| _CPM_Rate | 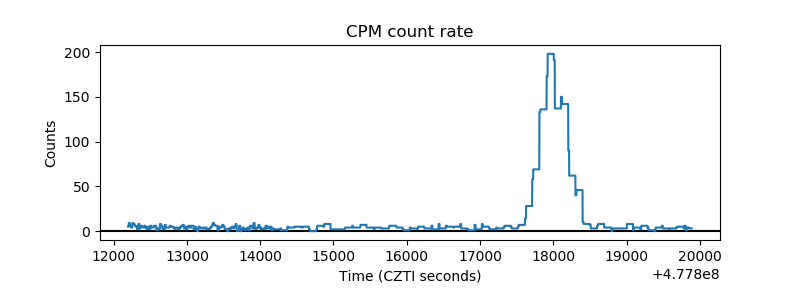 |
| CZT Counter | 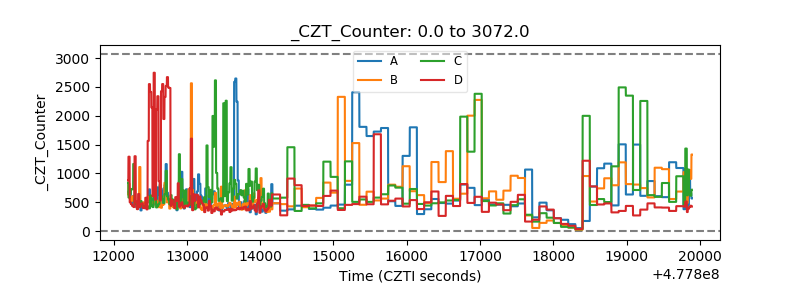 |
| +2.5 Volts monitor | 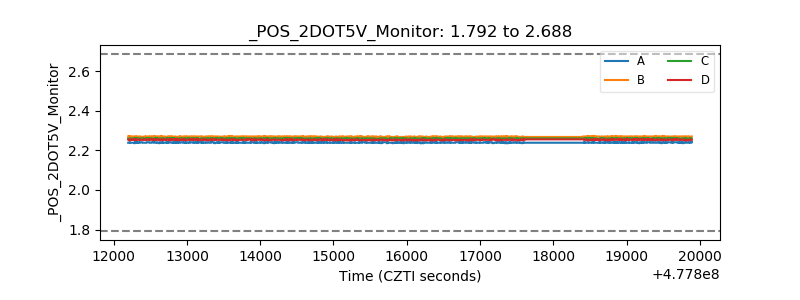 |
| +5 Volts monitor |  |
| _ROLL_ROT | 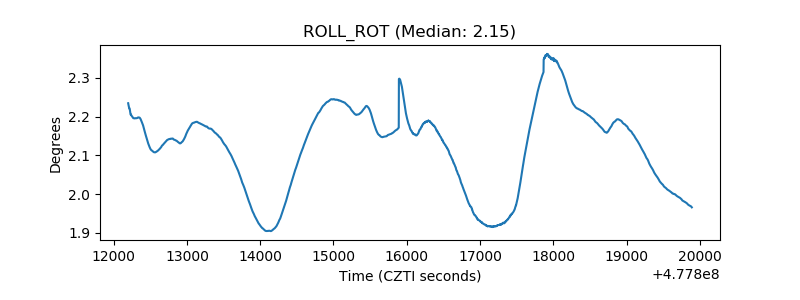 |
| _Roll_DEC | 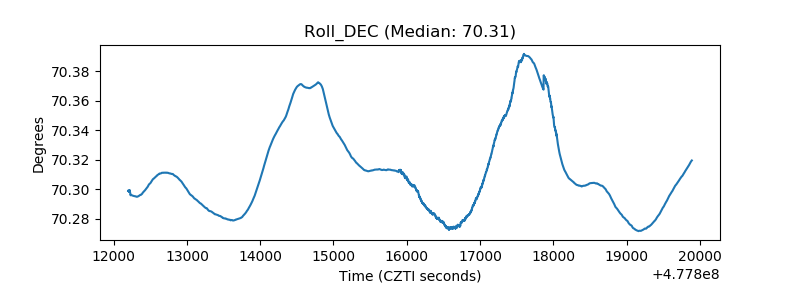 |
| _Roll_RA | 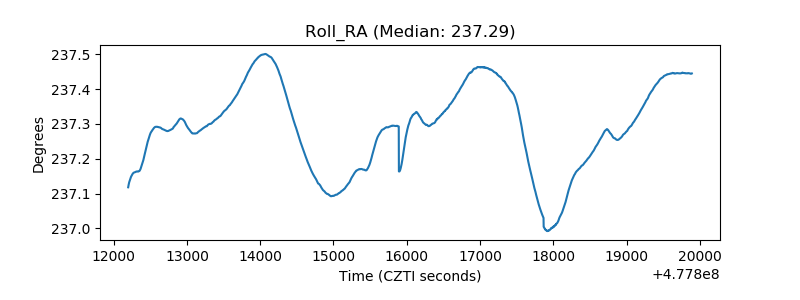 |
| Veto Counter | 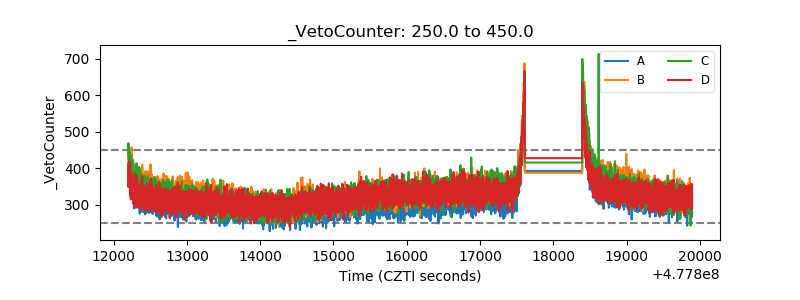 |