| Param | Original file | Final file |
|---|---|---|
| Filename | modeM0/AS1C07_001T01_9000006450_50853cztM0_level2.fits | modeM0/AS1C07_001T01_9000006450_50853cztM0_level2_quad_clean.evt |
| Size (bytes) | 586,134,720 | 92,920,320 |
| Size | 559.0 MB | 88.6 MB |
| Events in quadrant A | 6,680,610 | 570,863 |
| Events in quadrant B | 4,240,381 | 676,892 |
| Events in quadrant C | 5,940,431 | 555,969 |
| Events in quadrant D | 4,317,486 | 544,128 |
| Mode SS | |||
|---|---|---|---|
| Quadrant | BADHDUFLAG | Total packets | Discarded packets |
| A | 0 | 134 | 0 |
| B | 0 | 134 | 0 |
| C | 0 | 134 | 0 |
| D | 0 | 134 | 0 |
| Mode M0 | |||
|---|---|---|---|
| Quadrant | BADHDUFLAG | Total packets | Discarded packets |
| A | 0 | 24513 | 1 |
| B | 0 | 17102 | 1 |
| C | 0 | 22220 | 1 |
| D | 0 | 17546 | 1 |
| Mode M9 | |||
|---|---|---|---|
| Quadrant | BADHDUFLAG | Total packets | Discarded packets |
| A | 0 | 10 | 0 |
| B | 0 | 10 | 0 |
| C | 0 | 10 | 0 |
| D | 0 | 10 | 0 |
| Quadrant | Total seconds | Saturated seconds | Saturation percentage |
|---|---|---|---|
| A | 6681 | 860 | 12.872325% |
| B | 6682 | 117 | 1.750973% |
| C | 6681 | 668 | 9.998503% |
| D | 6681 | 298 | 4.460410% |
Noise dominated data is calculated using 1-second bins in cleaned event files. If a bin has >2000 counts, and if more than 50% of those come from <1% of pixels, then it is considered to be noise-dominated and hence unusable.
| Quadrant | # 1 sec bins | Bins with >0 counts | Bins with >2000 counts | High rate bins dominated by noise | Noise dominated (total time) | Noise dominated (detector-on time) | Marked lightcurve |
|---|---|---|---|---|---|---|---|
| A | 7641 | 6681 | 843 | 843 | 11.03% | 12.62% | 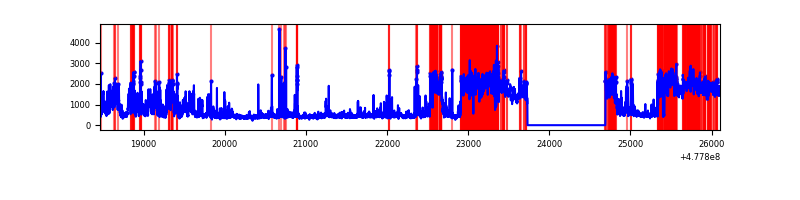 |
| B | 7642 | 6682 | 37 | 37 | 0.48% | 0.55% | 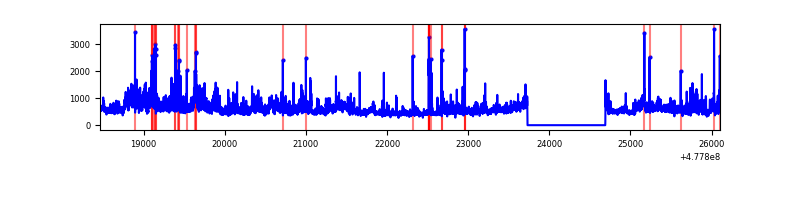 |
| C | 7641 | 6682 | 562 | 562 | 7.36% | 8.41% | 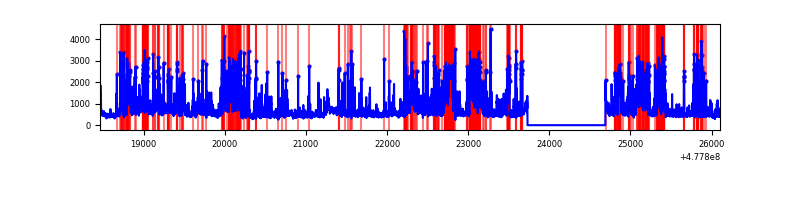 |
| D | 7641 | 6681 | 242 | 242 | 3.17% | 3.62% | 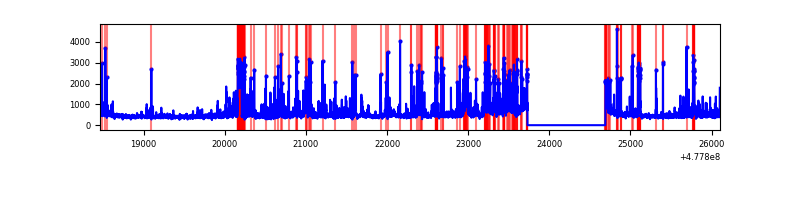 |
Top three noisy pixels from each quadrant. If the there are fewer than three noisy pixels in the level2.evt file, extra rows are filled as -1
| Pixel properties | Quadrant properties | ||||||
|---|---|---|---|---|---|---|---|
| Quadrant | DetID | PixID | Counts | Sigma | Mean | Median | Sigma |
| A | 12 | 80 | 3374674 | 20084.13 | 687 | 671 | 168.0 |
| A | 7 | 221 | 93657 | 553.51 | 687 | 671 | 168.0 |
| A | 5 | 240 | 71391 | 420.97 | 687 | 671 | 168.0 |
| B | 5 | 172 | 878235 | 5891.95 | 699 | 673 | 148.9 |
| B | 8 | 128 | 277867 | 1861.08 | 699 | 673 | 148.9 |
| B | 10 | 247 | 42709 | 282.23 | 699 | 673 | 148.9 |
| C | 4 | 5 | 1089957 | 6096.7 | 653 | 647 | 178.7 |
| C | 1 | 29 | 573689 | 3207.23 | 653 | 647 | 178.7 |
| C | 1 | 60 | 210491 | 1174.47 | 653 | 647 | 178.7 |
| D | 2 | 216 | 304889 | 1617.32 | 667 | 644 | 188.1 |
| D | 6 | 191 | 269506 | 1429.23 | 667 | 644 | 188.1 |
| D | 2 | 249 | 259829 | 1377.79 | 667 | 644 | 188.1 |
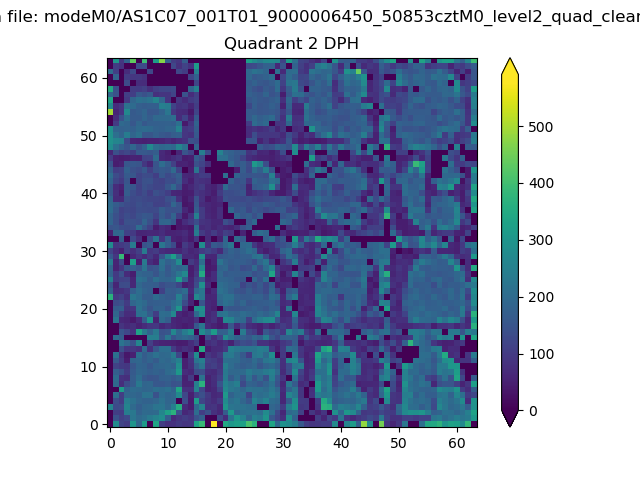
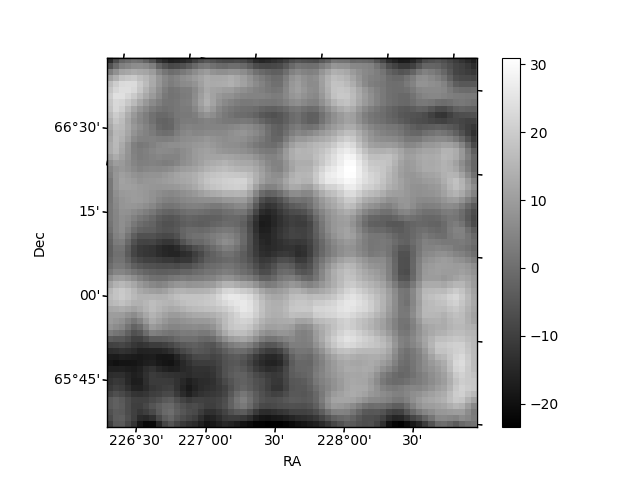
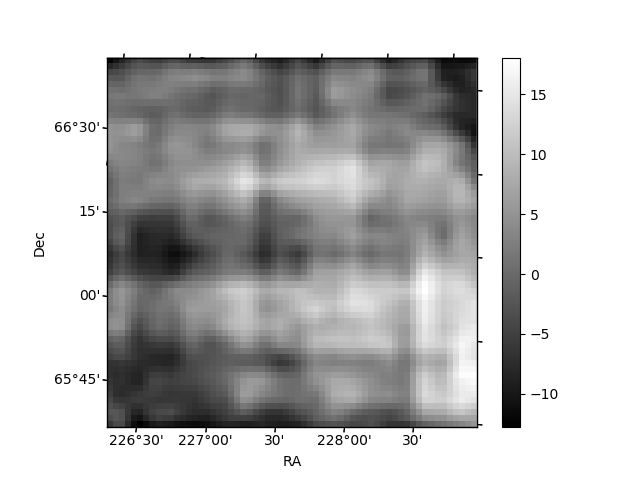
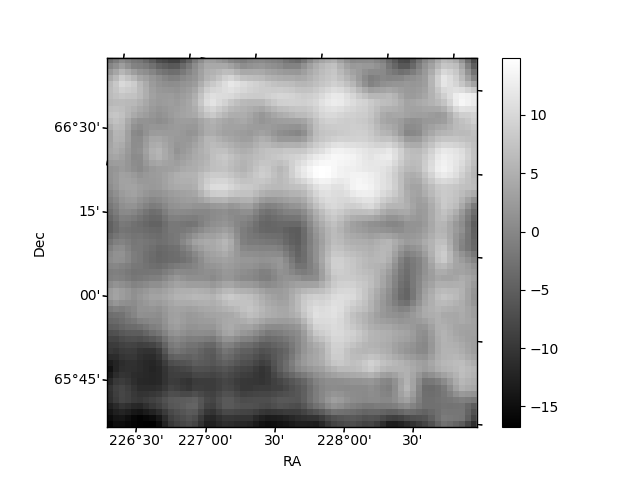
Histogram calculated using DETX and DETY for each event in the final _common_clean file
| Quadrant A | 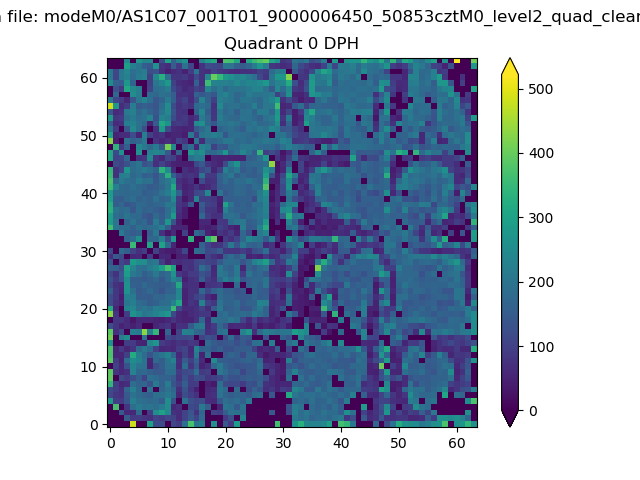 |
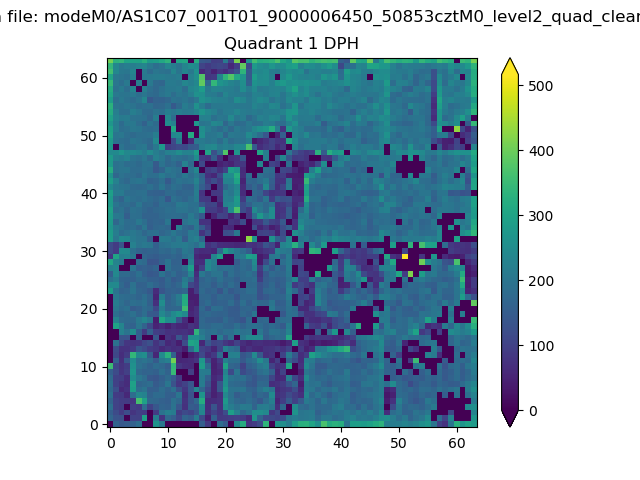 |
Quadrant B |
|---|---|---|---|
| Quadrant D | 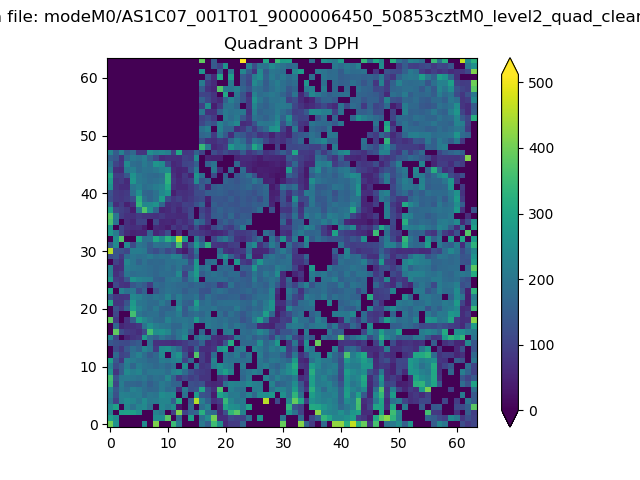 |
 |
Quadrant C |
| Plot type | Count rate plots | Images |
|---|---|---|
| Comparison with Poisson distribution Blue bars denote a histogram of data divided into 1 sec bins. Red curve is a Poisson curve with rate = median count rate of data. |
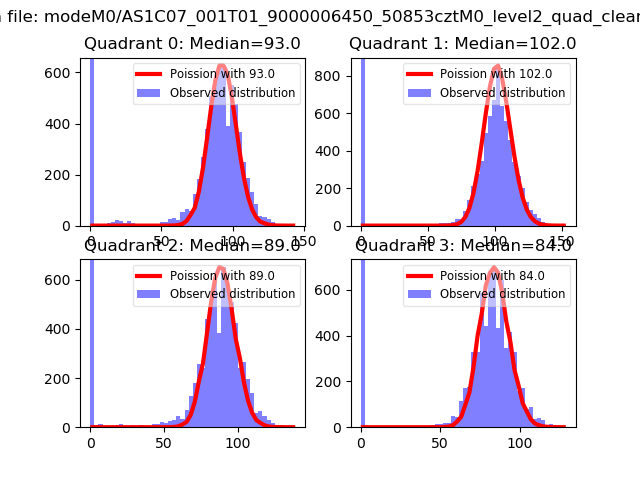 |
 |
| Quadrant-wise count rates Data is divided into 100 sec bins |
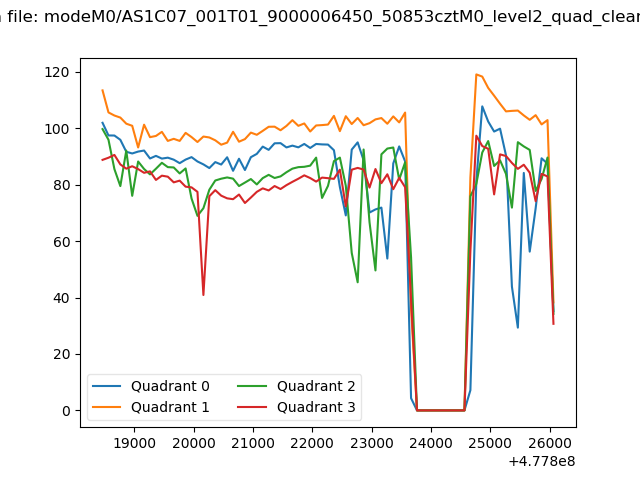 |
|
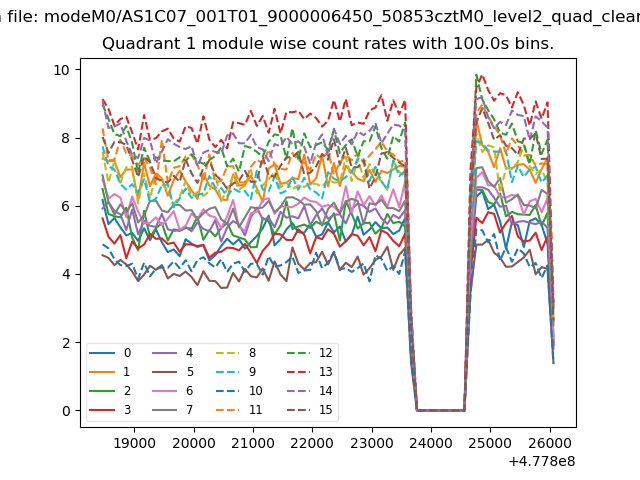
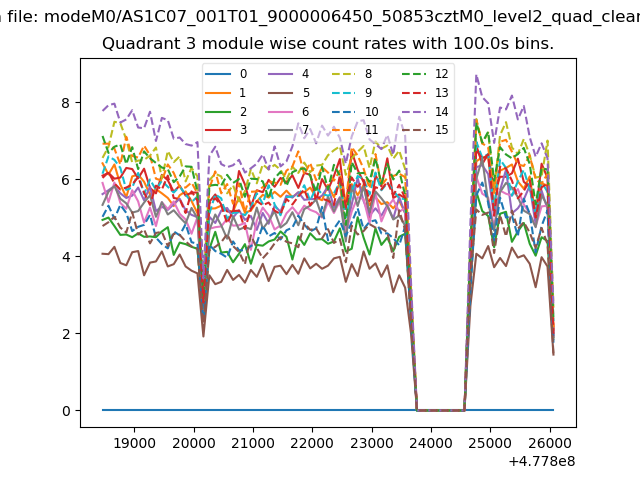
| Module-wise count rates for Quadrant A Data is divided into 100 sec bins |
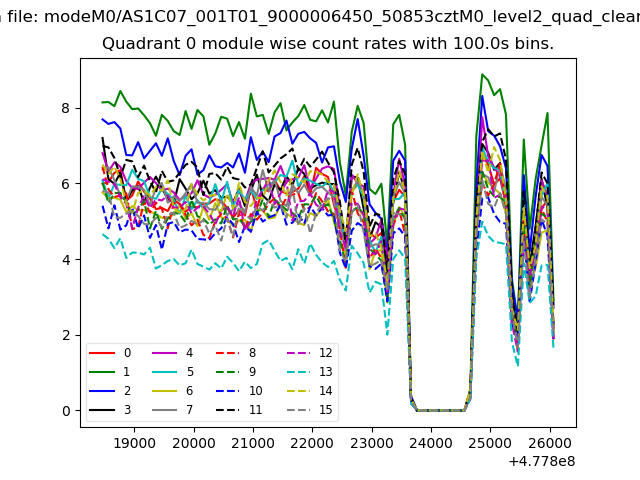 |
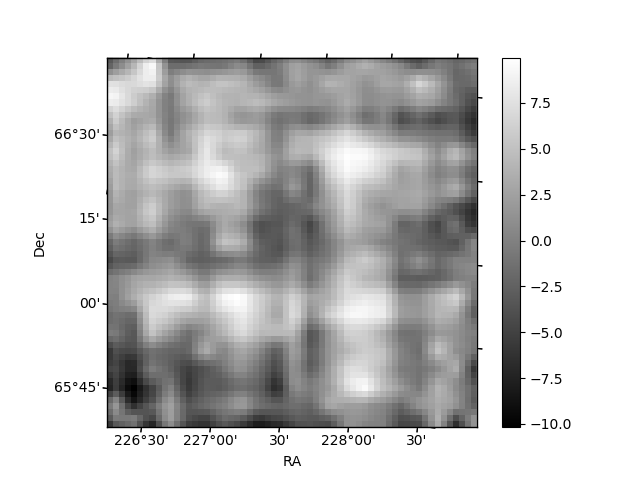 |
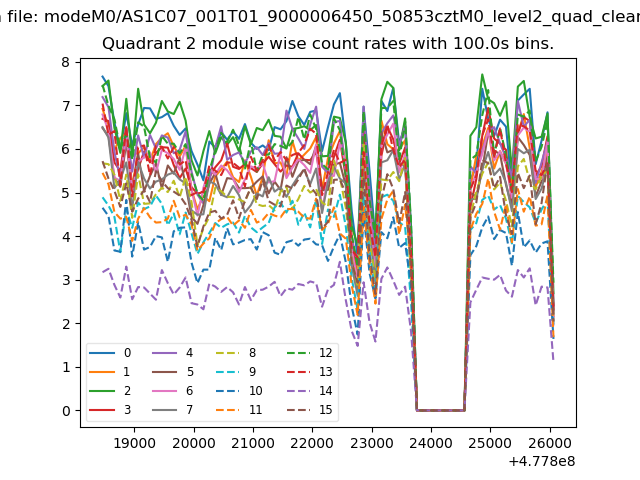
| Module-wise count rates for Quadrant B Data is divided into 100 sec bins |
 |
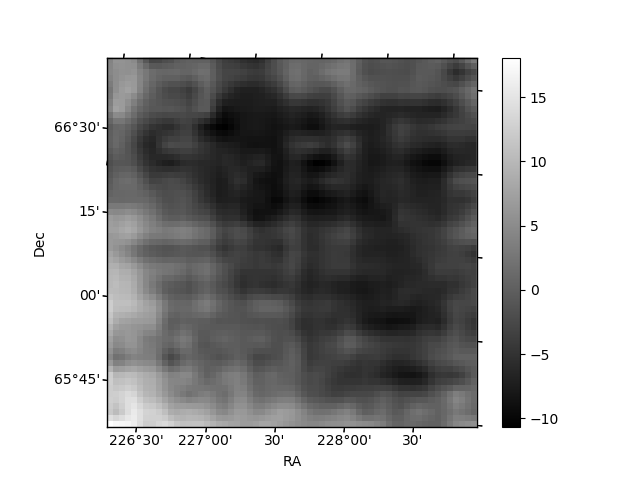 |
| Module-wise count rates for Quadrant C Data is divided into 100 sec bins |
 |
 |
| Module-wise count rates for Quadrant D Data is divided into 100 sec bins |
 |
 |
| Parameter | Plot |
|---|---|
| CZT HV Monitor | 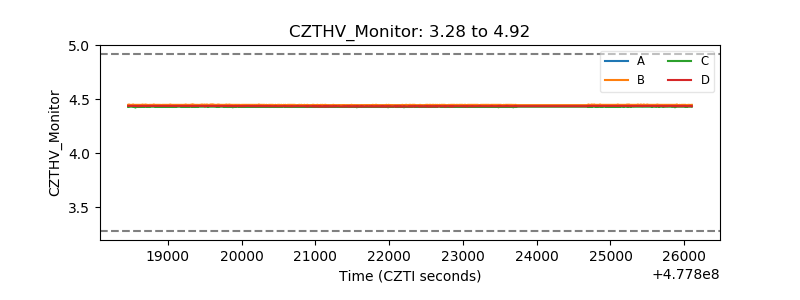 |
| D_VDD | 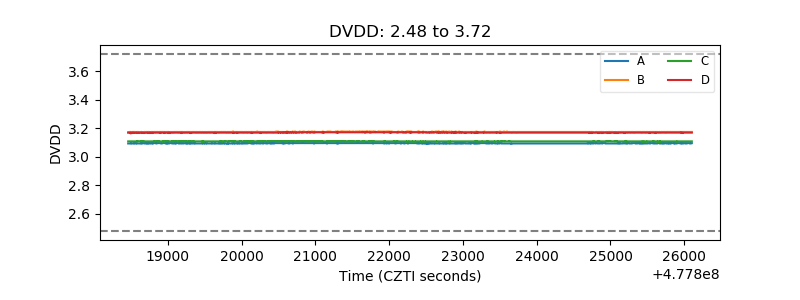 |
| Temperature 1 | 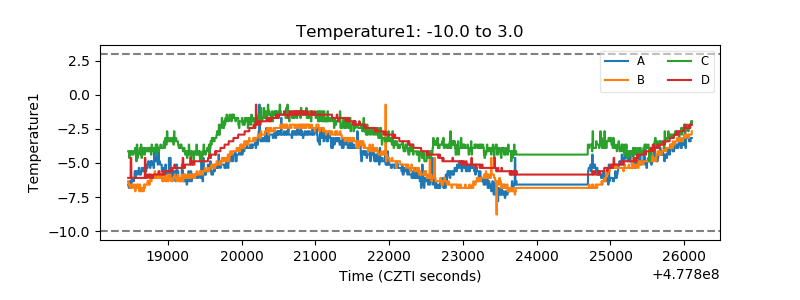 |
| Veto HV Monitor | 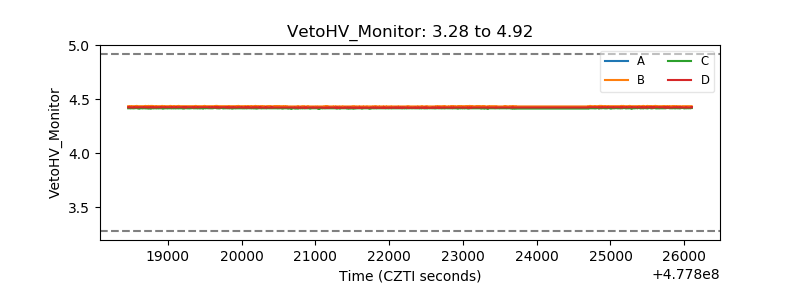 |
| Veto LLD | 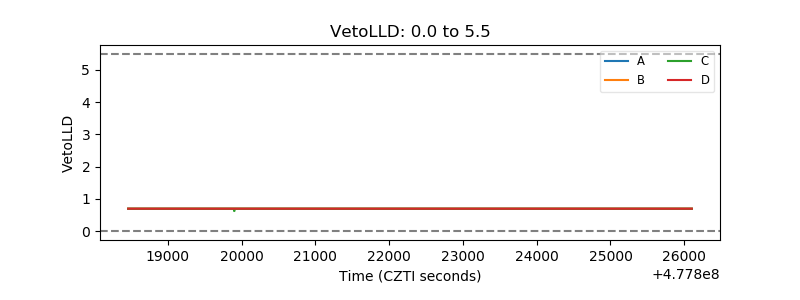 |
| Alpha Counter | 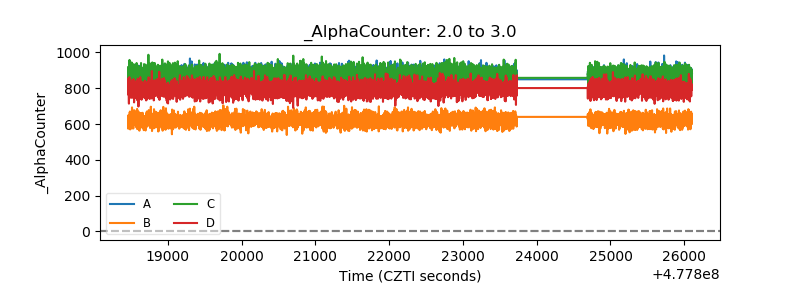 |
| _CPM_Rate | 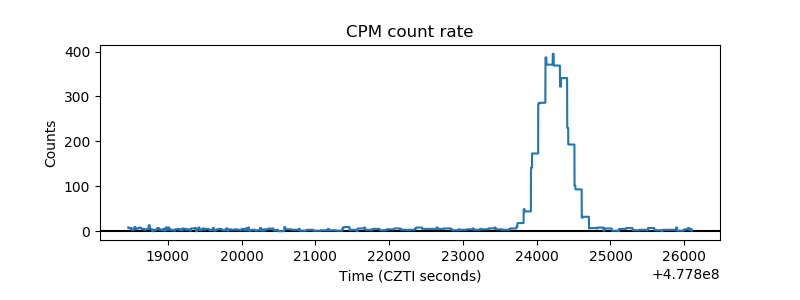 |
| CZT Counter | 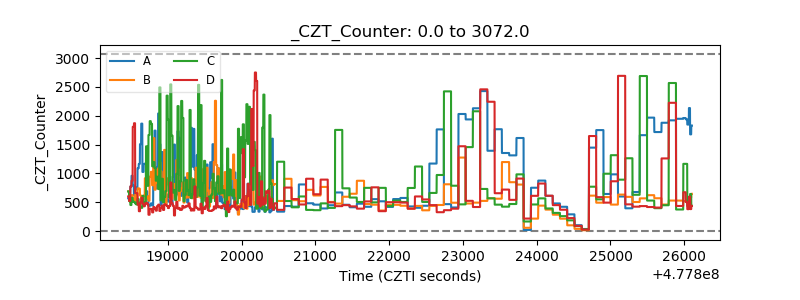 |
| +2.5 Volts monitor | 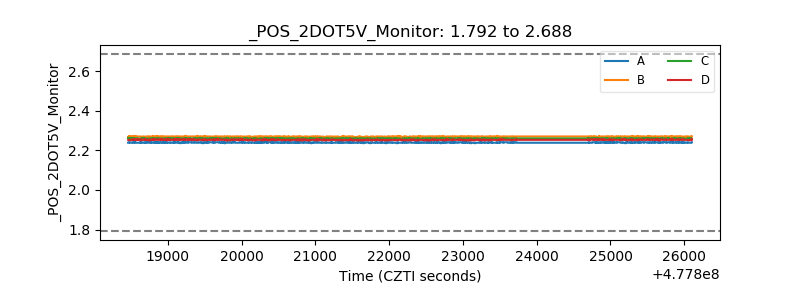 |
| +5 Volts monitor | 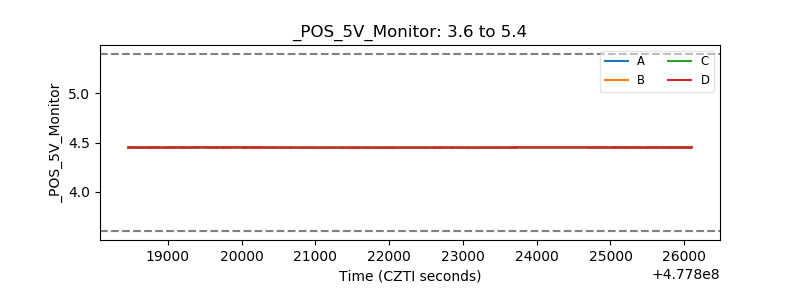 |
| _ROLL_ROT | 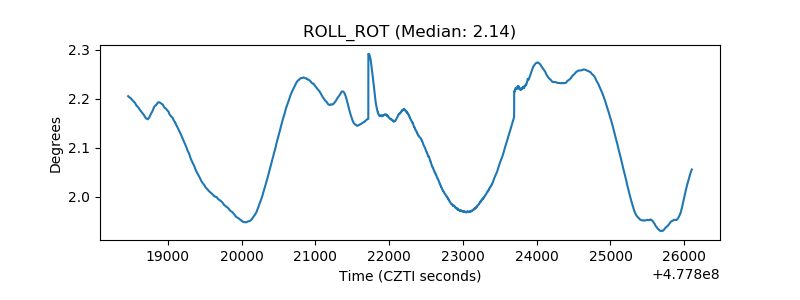 |
| _Roll_DEC | 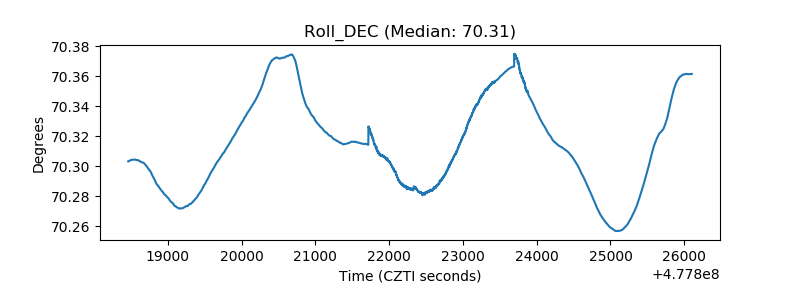 |
| _Roll_RA | 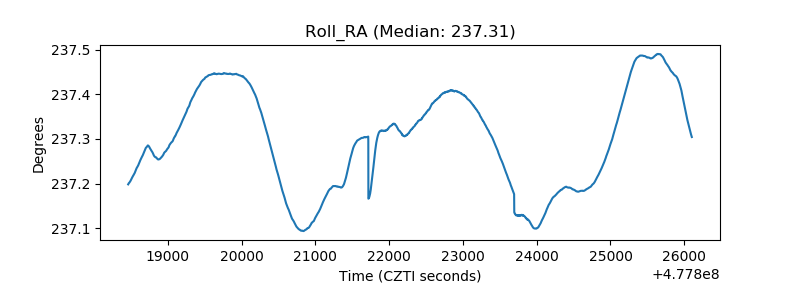 |
| Veto Counter | 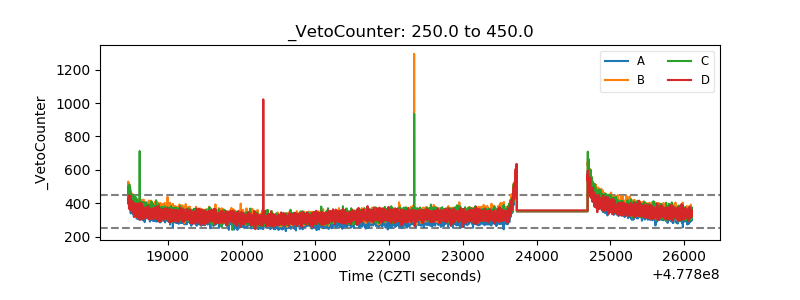 |