| Param | Original file | Final file |
|---|---|---|
| Filename | modeM0/AS1C07_001T01_9000006450_50854cztM0_level2.fits | modeM0/AS1C07_001T01_9000006450_50854cztM0_level2_quad_clean.evt |
| Size (bytes) | 510,042,240 | 85,095,360 |
| Size | 486.4 MB | 81.2 MB |
| Events in quadrant A | 4,796,723 | 546,648 |
| Events in quadrant B | 3,570,083 | 616,617 |
| Events in quadrant C | 5,090,446 | 513,929 |
| Events in quadrant D | 4,958,202 | 480,974 |
| Mode SS | |||
|---|---|---|---|
| Quadrant | BADHDUFLAG | Total packets | Discarded packets |
| A | 0 | 122 | 0 |
| B | 0 | 122 | 0 |
| C | 0 | 124 | 2 |
| D | 0 | 124 | 2 |
| Mode M0 | |||
|---|---|---|---|
| Quadrant | BADHDUFLAG | Total packets | Discarded packets |
| A | 0 | 18282 | 74 |
| B | 0 | 14657 | 29 |
| C | 0 | 19334 | 60 |
| D | 0 | 18875 | 13 |
| Mode M9 | |||
|---|---|---|---|
| Quadrant | BADHDUFLAG | Total packets | Discarded packets |
| A | 0 | 10 | 0 |
| B | 0 | 10 | 0 |
| C | 0 | 10 | 0 |
| D | 0 | 10 | 0 |
| Quadrant | Total seconds | Saturated seconds | Saturation percentage |
|---|---|---|---|
| A | 5983 | 480 | 8.022731% |
| B | 5987 | 176 | 2.939703% |
| C | 5985 | 540 | 9.022556% |
| D | 5989 | 560 | 9.350476% |
Noise dominated data is calculated using 1-second bins in cleaned event files. If a bin has >2000 counts, and if more than 50% of those come from <1% of pixels, then it is considered to be noise-dominated and hence unusable.
| Quadrant | # 1 sec bins | Bins with >0 counts | Bins with >2000 counts | High rate bins dominated by noise | Noise dominated (total time) | Noise dominated (detector-on time) | Marked lightcurve |
|---|---|---|---|---|---|---|---|
| A | 7017 | 5986 | 410 | 410 | 5.84% | 6.85% | 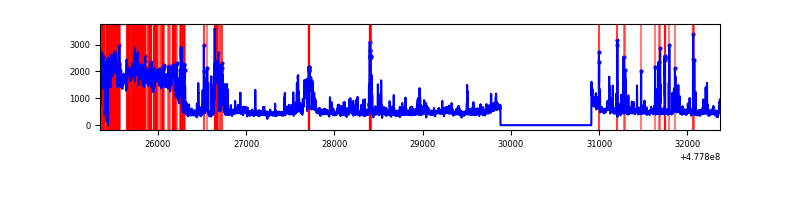 |
| B | 7020 | 5990 | 50 | 50 | 0.71% | 0.83% | 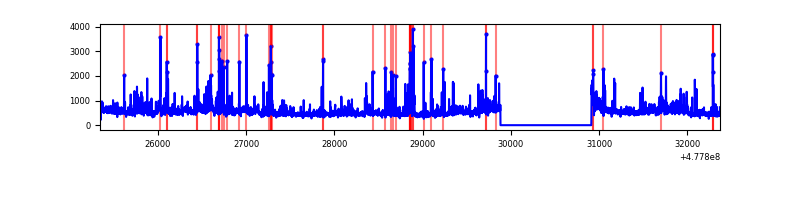 |
| C | 7016 | 5987 | 453 | 453 | 6.46% | 7.57% | 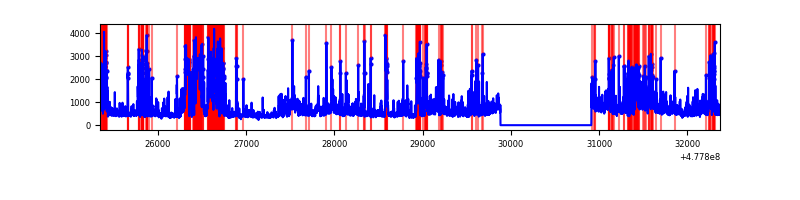 |
| D | 7023 | 5991 | 440 | 440 | 6.27% | 7.34% | 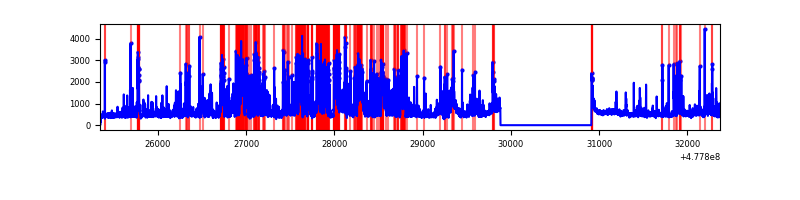 |
Top three noisy pixels from each quadrant. If the there are fewer than three noisy pixels in the level2.evt file, extra rows are filled as -1
| Pixel properties | Quadrant properties | ||||||
|---|---|---|---|---|---|---|---|
| Quadrant | DetID | PixID | Counts | Sigma | Mean | Median | Sigma |
| A | 12 | 80 | 1622003 | 10227.96 | 636 | 621 | 158.5 |
| A | 7 | 221 | 118062 | 740.84 | 636 | 621 | 158.5 |
| A | 4 | 3 | 103943 | 651.77 | 636 | 621 | 158.5 |
| B | 5 | 172 | 408069 | 3013.49 | 633 | 610 | 135.2 |
| B | 8 | 128 | 174065 | 1282.84 | 633 | 610 | 135.2 |
| B | 0 | 216 | 103097 | 757.97 | 633 | 610 | 135.2 |
| C | 1 | 60 | 766641 | 4706.97 | 595 | 590 | 162.7 |
| C | 5 | 10 | 403453 | 2475.38 | 595 | 590 | 162.7 |
| C | 1 | 29 | 380066 | 2331.67 | 595 | 590 | 162.7 |
| D | 2 | 216 | 1345538 | 8031.96 | 599 | 577 | 167.5 |
| D | 6 | 191 | 282304 | 1682.44 | 599 | 577 | 167.5 |
| D | 1 | 47 | 136963 | 814.48 | 599 | 577 | 167.5 |
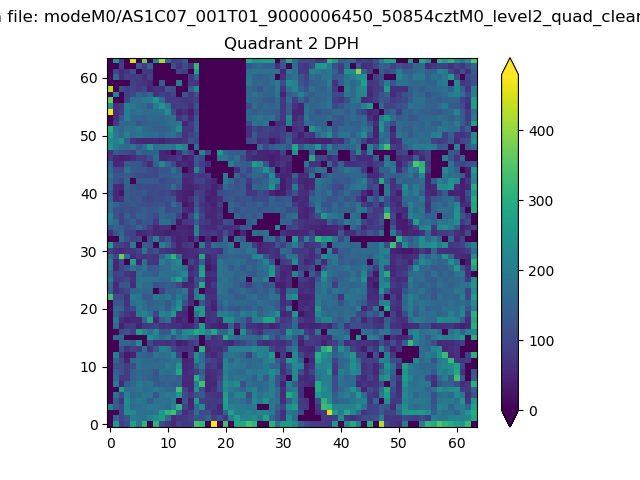
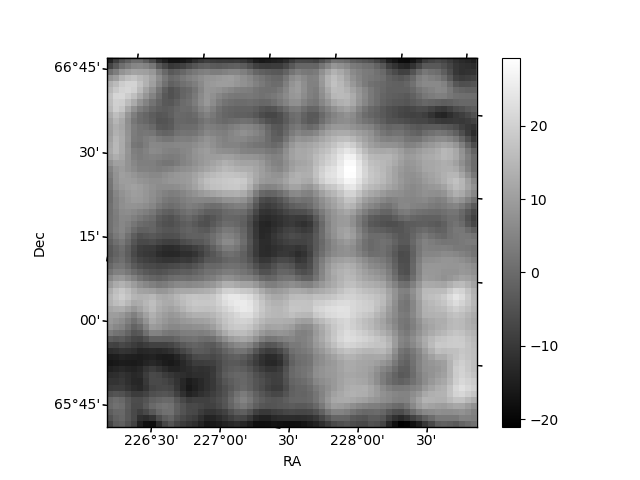
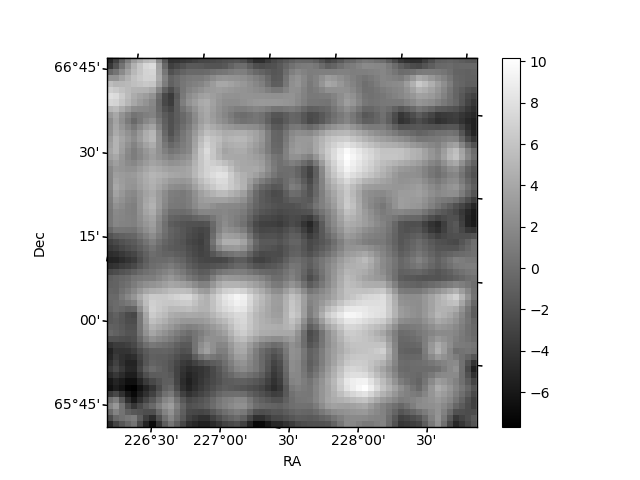
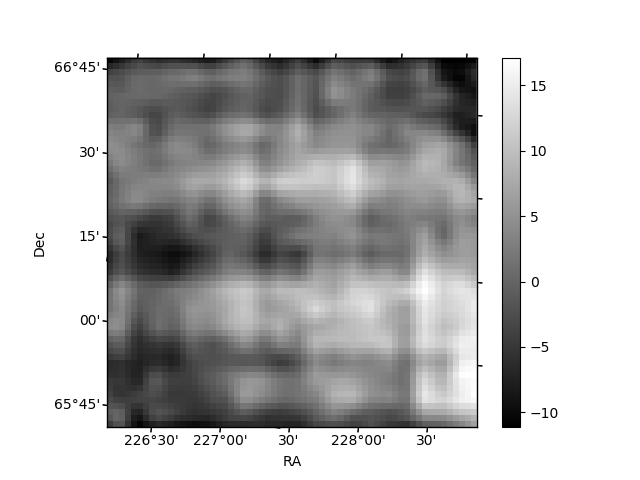
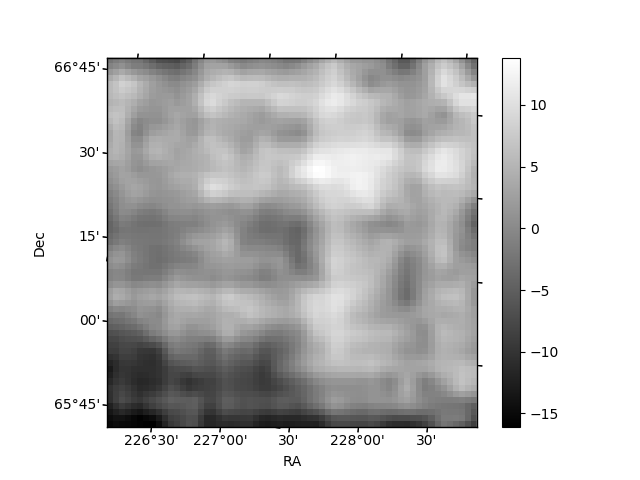
Histogram calculated using DETX and DETY for each event in the final _common_clean file
| Quadrant A | 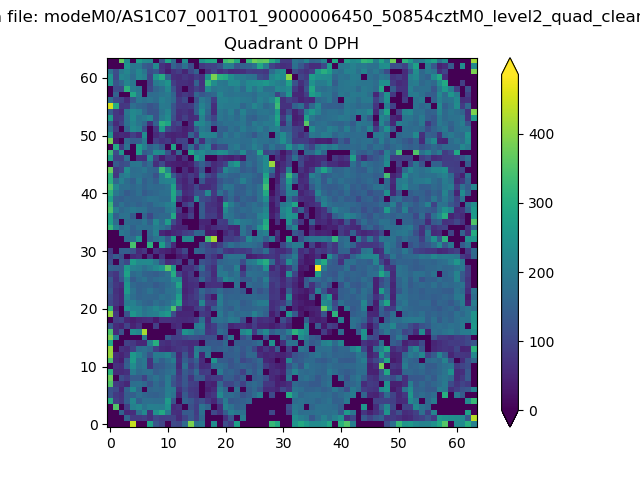 |
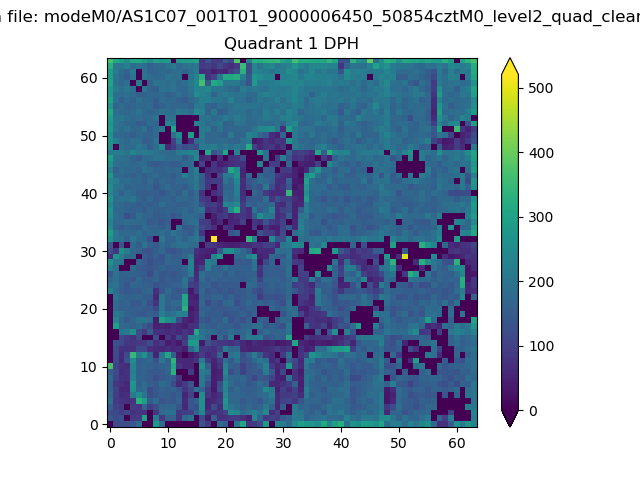 |
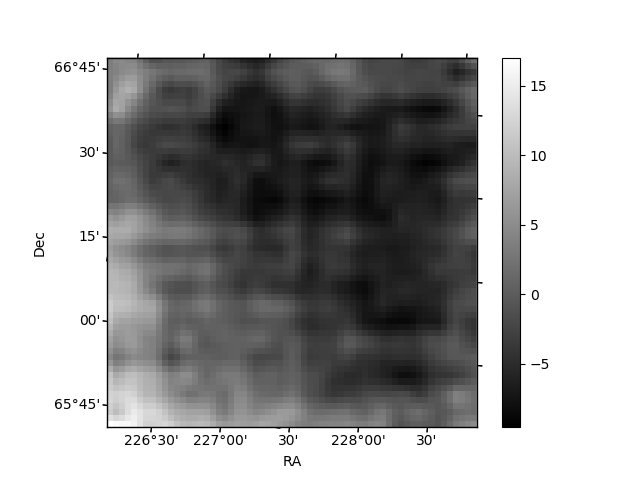
Quadrant B |
|---|---|---|---|
| Quadrant D | 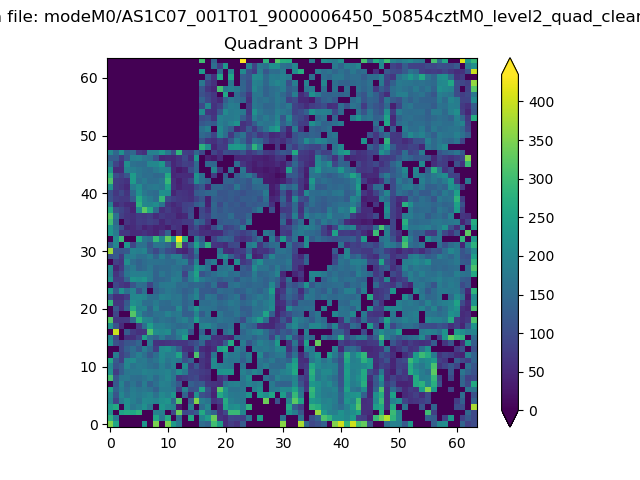 |
 |
Quadrant C |
| Plot type | Count rate plots | Images |
|---|---|---|
| Comparison with Poisson distribution Blue bars denote a histogram of data divided into 1 sec bins. Red curve is a Poisson curve with rate = median count rate of data. |
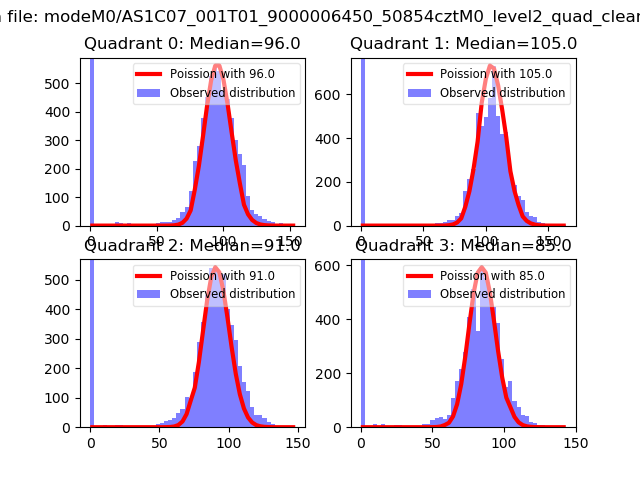 |
 |
| Quadrant-wise count rates Data is divided into 100 sec bins |
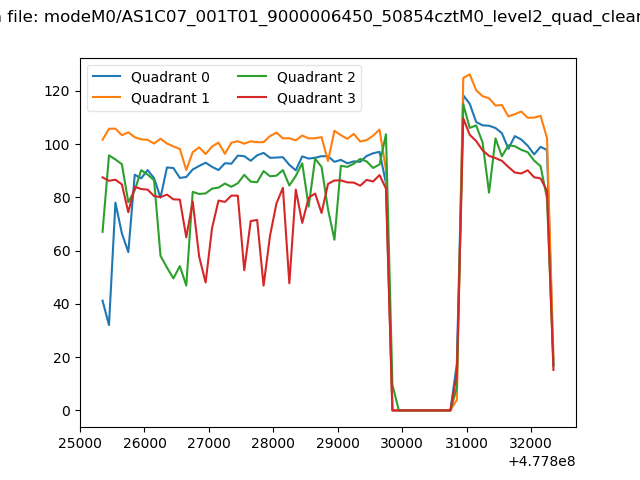 |
|
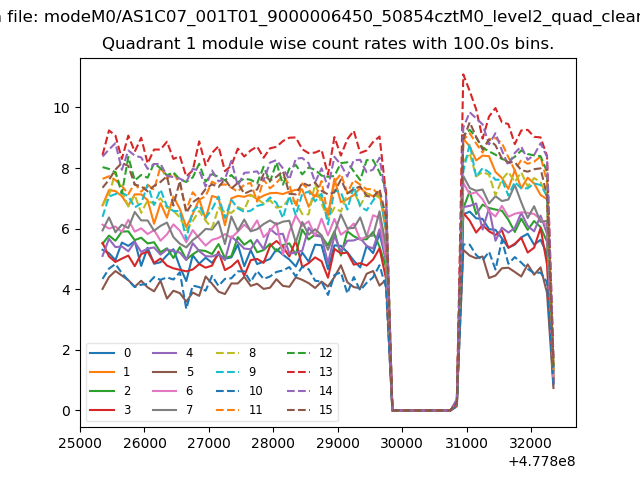
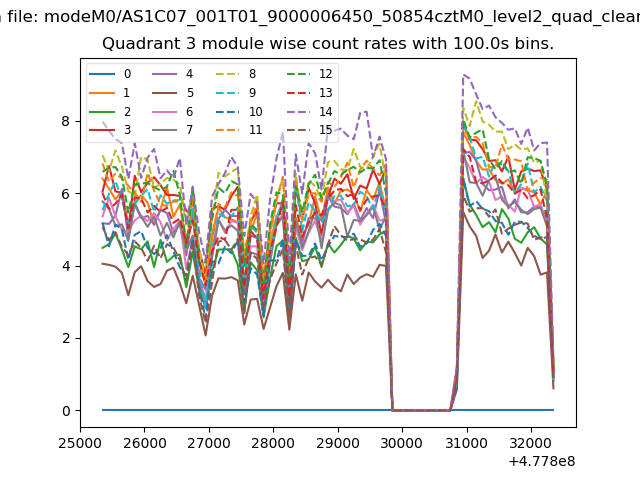
| Module-wise count rates for Quadrant A Data is divided into 100 sec bins |
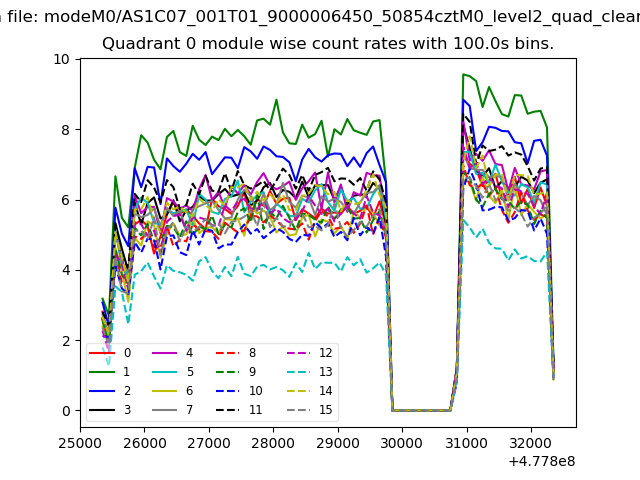 |
 |
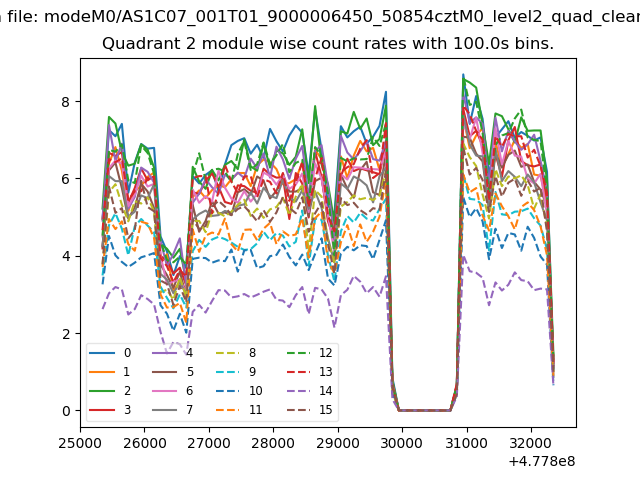
| Module-wise count rates for Quadrant B Data is divided into 100 sec bins |
 |
 |
| Module-wise count rates for Quadrant C Data is divided into 100 sec bins |
 |
 |
| Module-wise count rates for Quadrant D Data is divided into 100 sec bins |
 |
 |
| Parameter | Plot |
|---|---|
| CZT HV Monitor | 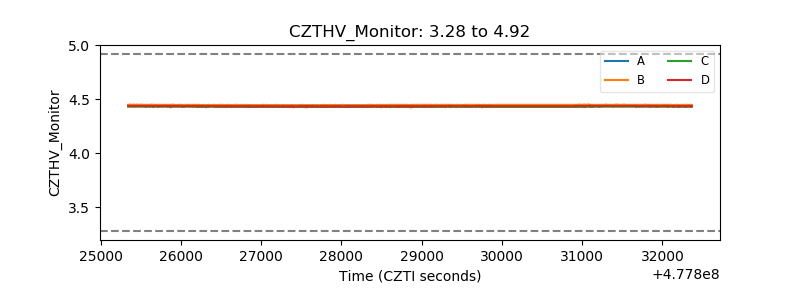 |
| D_VDD | 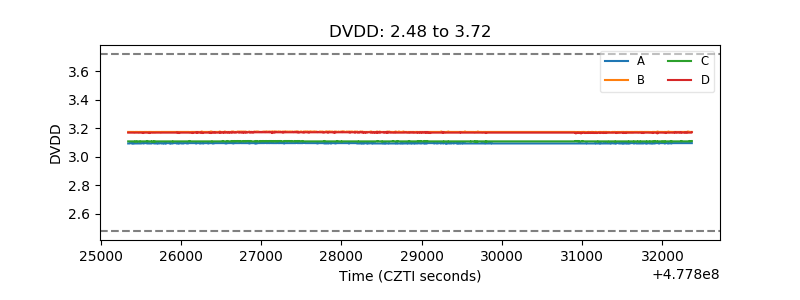 |
| Temperature 1 | 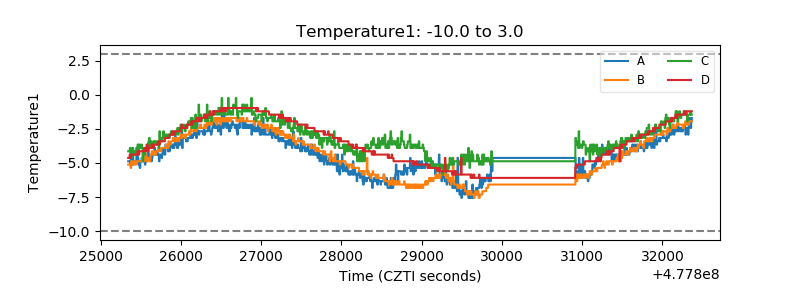 |
| Veto HV Monitor | 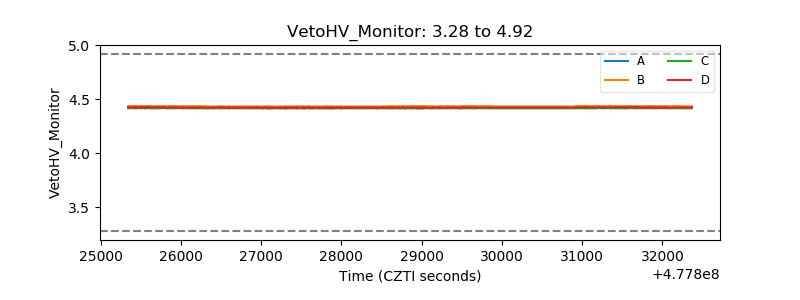 |
| Veto LLD | 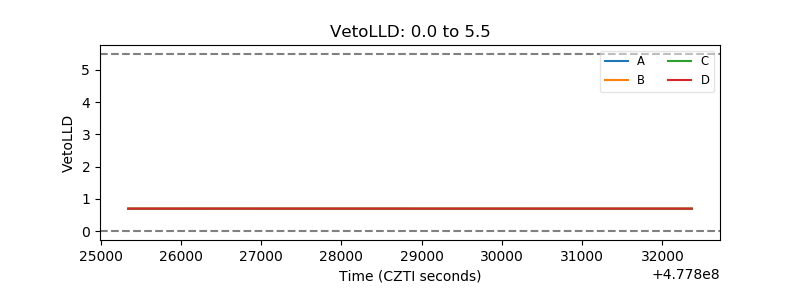 |
| Alpha Counter | 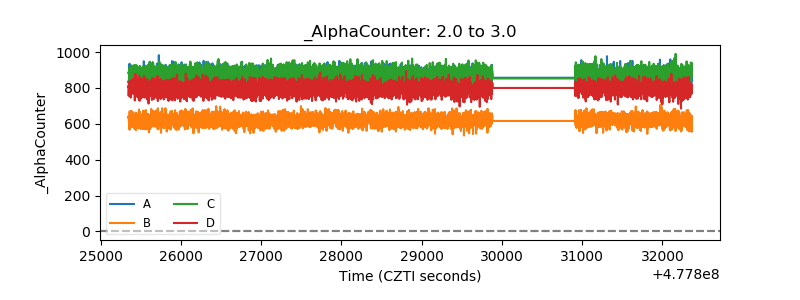 |
| _CPM_Rate | 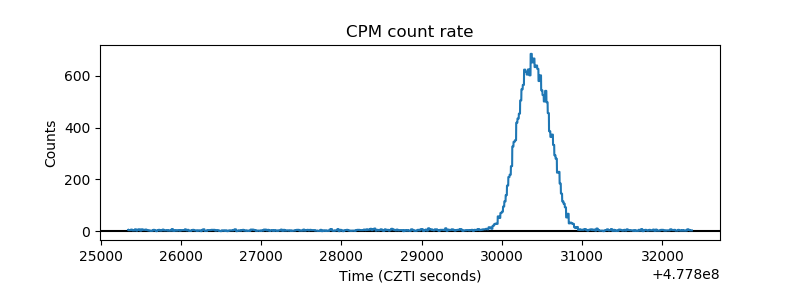 |
| CZT Counter | 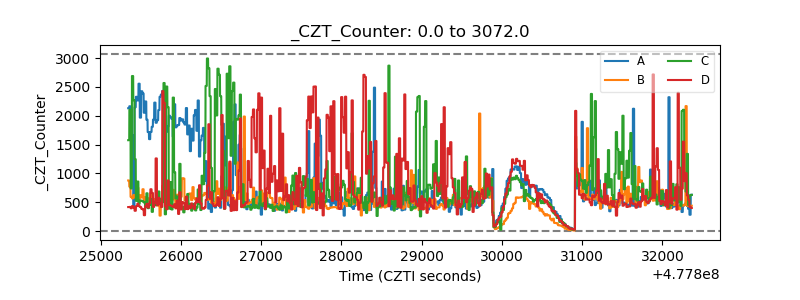 |
| +2.5 Volts monitor | 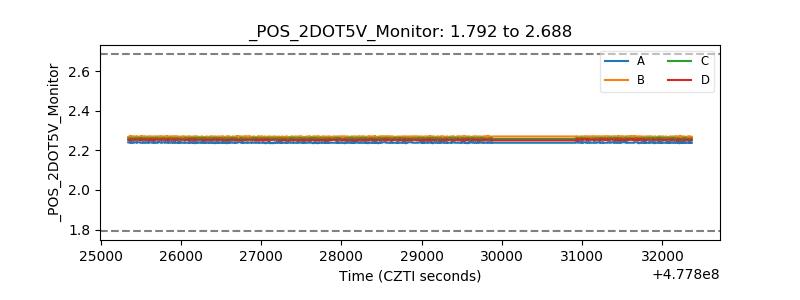 |
| +5 Volts monitor | 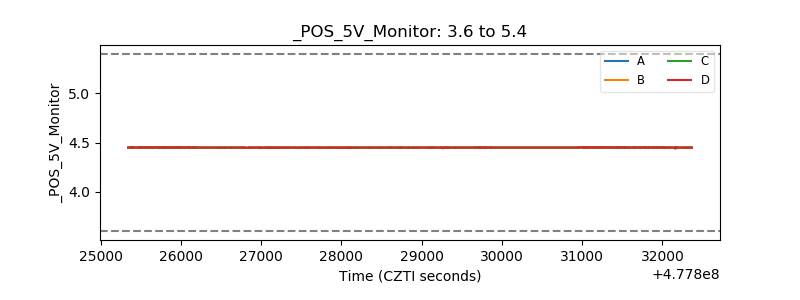 |
| _ROLL_ROT | 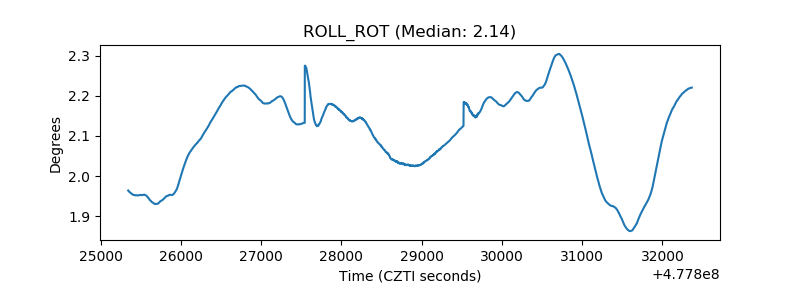 |
| _Roll_DEC | 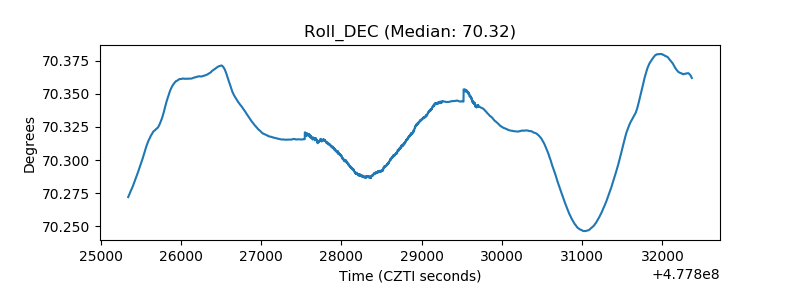 |
| _Roll_RA | 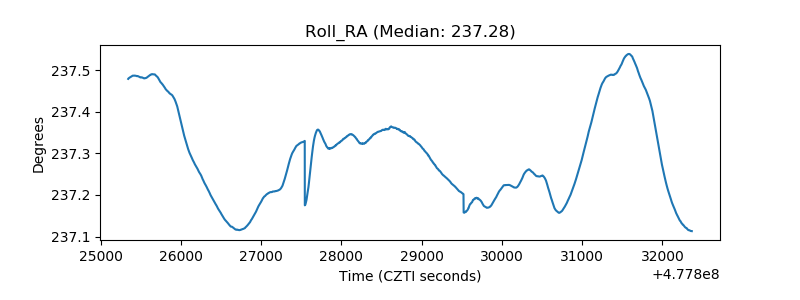 |
| Veto Counter | 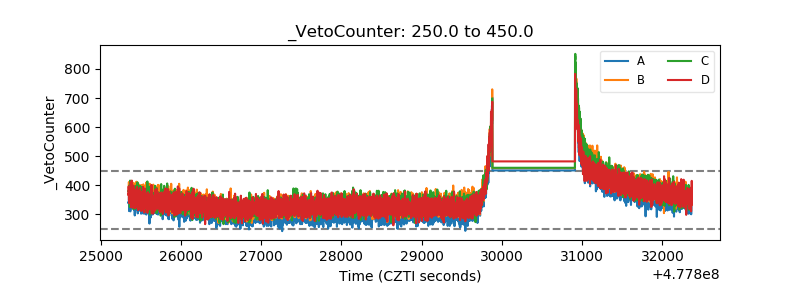 |