| Param | Original file | Final file |
|---|---|---|
| Filename | modeM0/AS1C07_001T01_9000006450_50855cztM0_level2.fits | modeM0/AS1C07_001T01_9000006450_50855cztM0_level2_quad_clean.evt |
| Size (bytes) | 490,040,640 | 92,960,640 |
| Size | 467.3 MB | 88.7 MB |
| Events in quadrant A | 3,779,476 | 619,936 |
| Events in quadrant B | 3,627,747 | 671,190 |
| Events in quadrant C | 5,558,327 | 541,519 |
| Events in quadrant D | 4,683,436 | 541,962 |
| Mode SS | |||
|---|---|---|---|
| Quadrant | BADHDUFLAG | Total packets | Discarded packets |
| A | 0 | 126 | 0 |
| B | 0 | 126 | 0 |
| C | 0 | 126 | 0 |
| D | 0 | 126 | 0 |
| Mode M0 | |||
|---|---|---|---|
| Quadrant | BADHDUFLAG | Total packets | Discarded packets |
| A | 0 | 15389 | 1 |
| B | 0 | 15109 | 1 |
| C | 0 | 20758 | 1 |
| D | 0 | 18193 | 1 |
| Mode M9 | |||
|---|---|---|---|
| Quadrant | BADHDUFLAG | Total packets | Discarded packets |
| A | 0 | 12 | 0 |
| B | 0 | 12 | 0 |
| C | 0 | 12 | 0 |
| D | 0 | 12 | 0 |
| Quadrant | Total seconds | Saturated seconds | Saturation percentage |
|---|---|---|---|
| A | 6316 | 180 | 2.849905% |
| B | 6317 | 194 | 3.071078% |
| C | 6317 | 713 | 11.287003% |
| D | 6317 | 342 | 5.413962% |
Noise dominated data is calculated using 1-second bins in cleaned event files. If a bin has >2000 counts, and if more than 50% of those come from <1% of pixels, then it is considered to be noise-dominated and hence unusable.
| Quadrant | # 1 sec bins | Bins with >0 counts | Bins with >2000 counts | High rate bins dominated by noise | Noise dominated (total time) | Noise dominated (detector-on time) | Marked lightcurve |
|---|---|---|---|---|---|---|---|
| A | 7426 | 6316 | 88 | 88 | 1.19% | 1.39% | 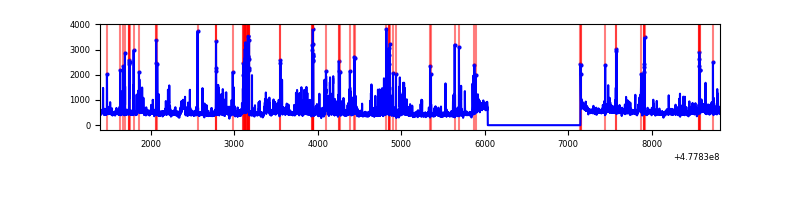 |
| B | 7427 | 6317 | 60 | 60 | 0.81% | 0.95% | 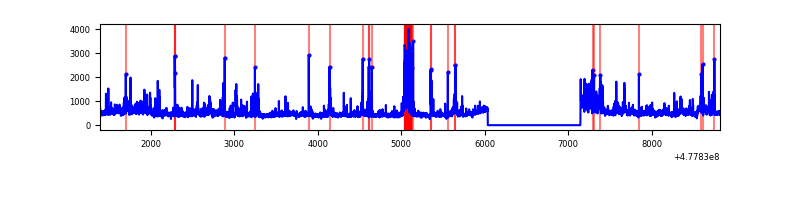 |
| C | 7427 | 6317 | 562 | 562 | 7.57% | 8.90% | 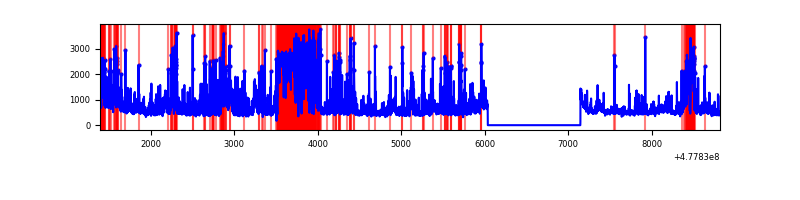 |
| D | 7427 | 6317 | 237 | 237 | 3.19% | 3.75% | 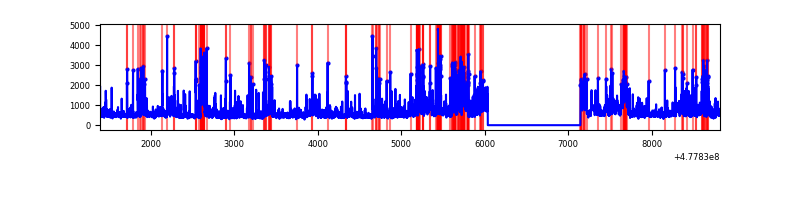 |
Top three noisy pixels from each quadrant. If the there are fewer than three noisy pixels in the level2.evt file, extra rows are filled as -1
| Pixel properties | Quadrant properties | ||||||
|---|---|---|---|---|---|---|---|
| Quadrant | DetID | PixID | Counts | Sigma | Mean | Median | Sigma |
| A | 7 | 221 | 175455 | 1011.5 | 687 | 672 | 172.8 |
| A | 4 | 191 | 121024 | 696.49 | 687 | 672 | 172.8 |
| A | 4 | 3 | 111961 | 644.05 | 687 | 672 | 172.8 |
| B | 5 | 172 | 292803 | 1996.06 | 681 | 653 | 146.4 |
| B | 8 | 128 | 254646 | 1735.36 | 681 | 653 | 146.4 |
| B | 0 | 172 | 84173 | 570.64 | 681 | 653 | 146.4 |
| C | 4 | 5 | 884282 | 5134.62 | 634 | 628 | 172.1 |
| C | 1 | 29 | 633709 | 3678.63 | 634 | 628 | 172.1 |
| C | 1 | 60 | 389976 | 2262.37 | 634 | 628 | 172.1 |
| D | 2 | 216 | 565161 | 3047.74 | 655 | 629 | 185.2 |
| D | 2 | 249 | 365473 | 1969.68 | 655 | 629 | 185.2 |
| D | 11 | 245 | 166412 | 895.01 | 655 | 629 | 185.2 |
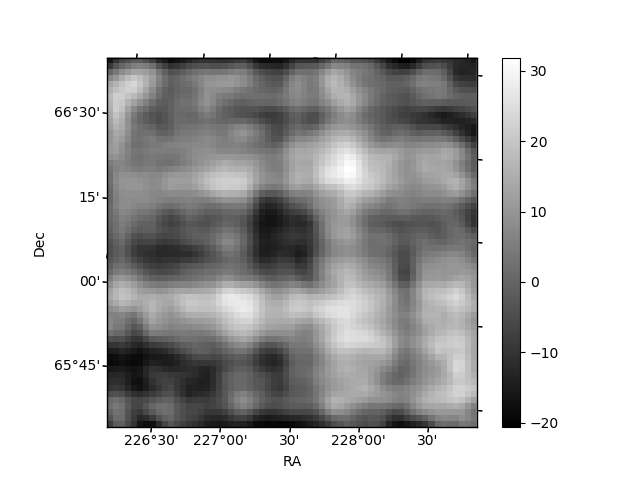
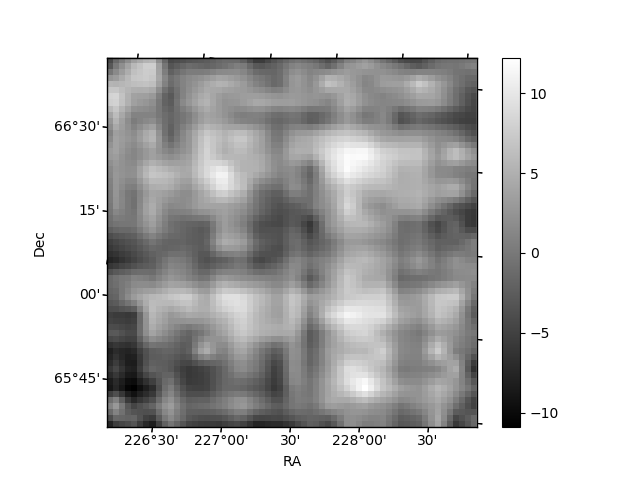
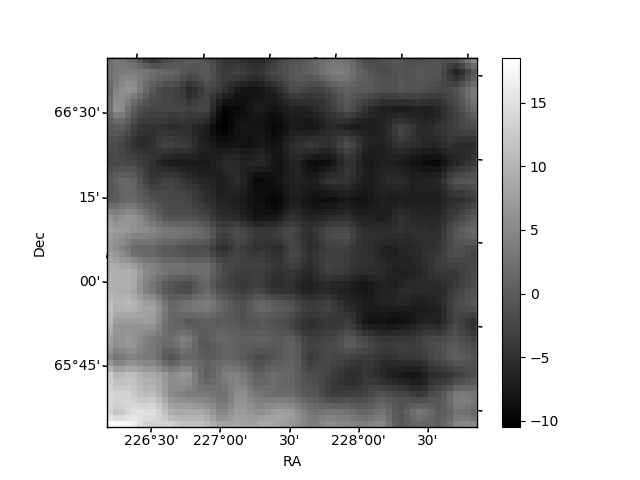
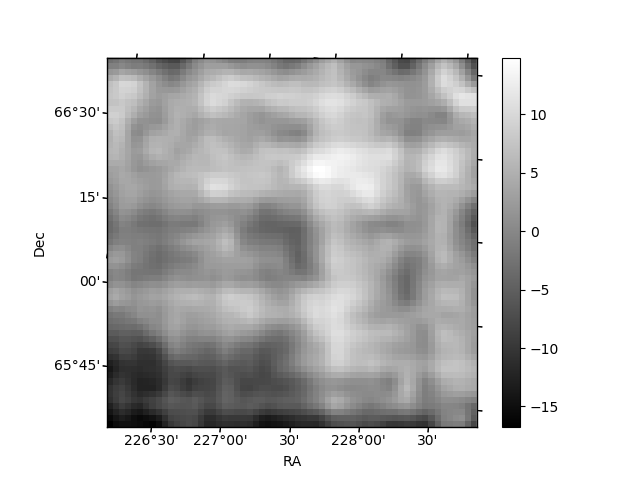
Histogram calculated using DETX and DETY for each event in the final _common_clean file
| Quadrant A | 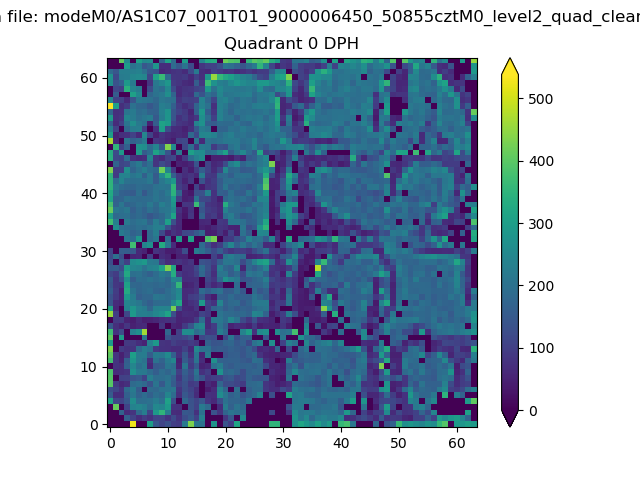 |
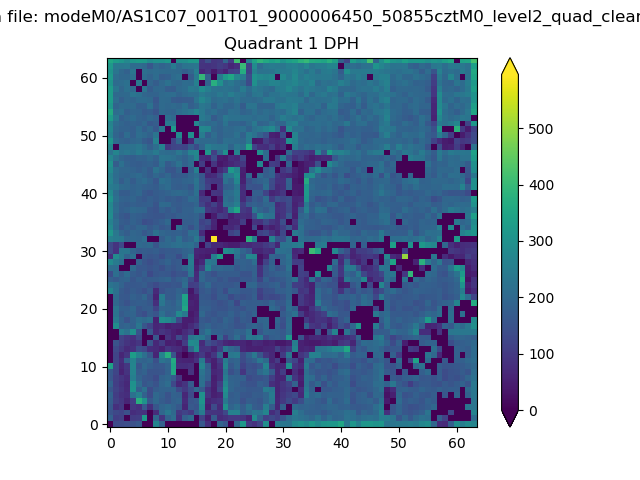 |
Quadrant B |
|---|---|---|---|
| Quadrant D | 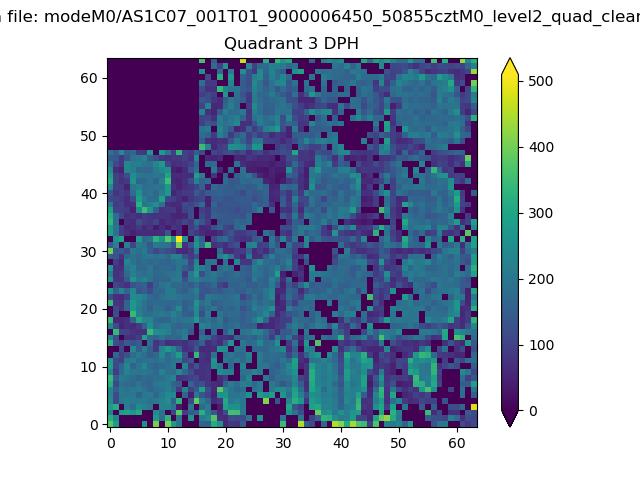 |
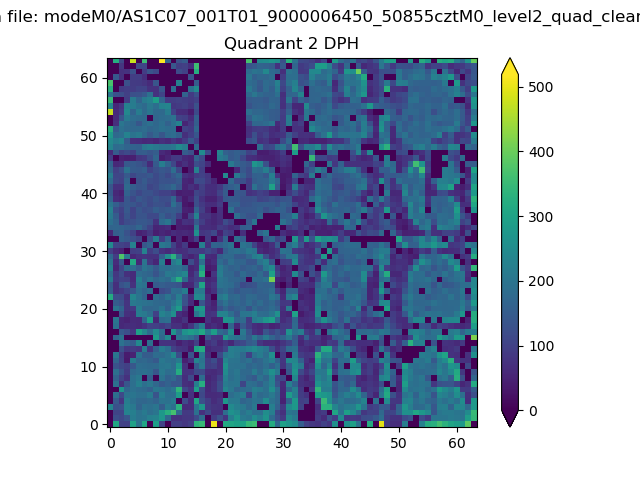 |
Quadrant C |
| Plot type | Count rate plots | Images |
|---|---|---|
| Comparison with Poisson distribution Blue bars denote a histogram of data divided into 1 sec bins. Red curve is a Poisson curve with rate = median count rate of data. |
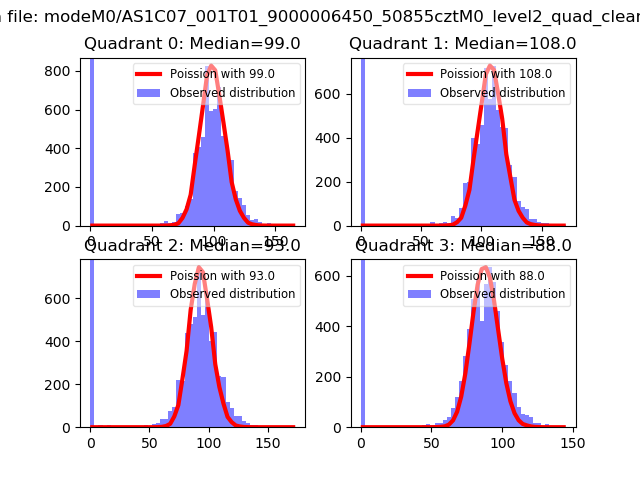 |
 |
| Quadrant-wise count rates Data is divided into 100 sec bins |
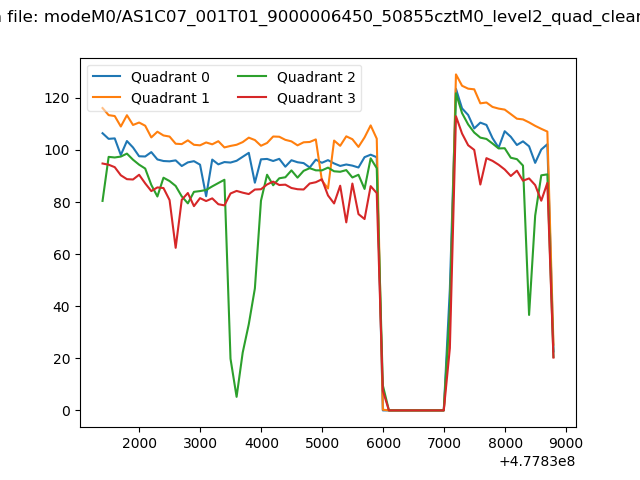 |
|
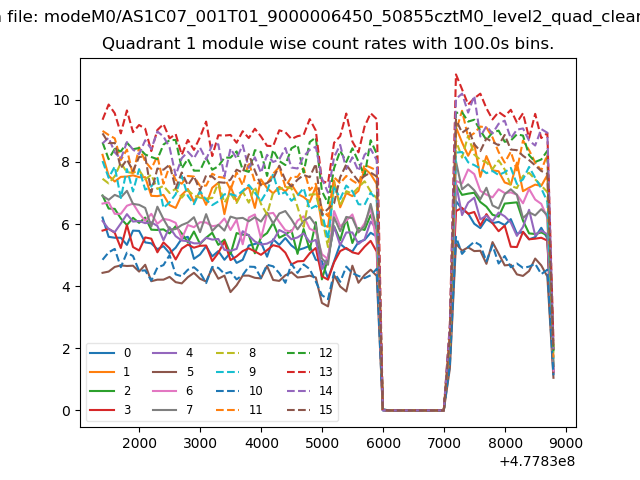
| Module-wise count rates for Quadrant A Data is divided into 100 sec bins |
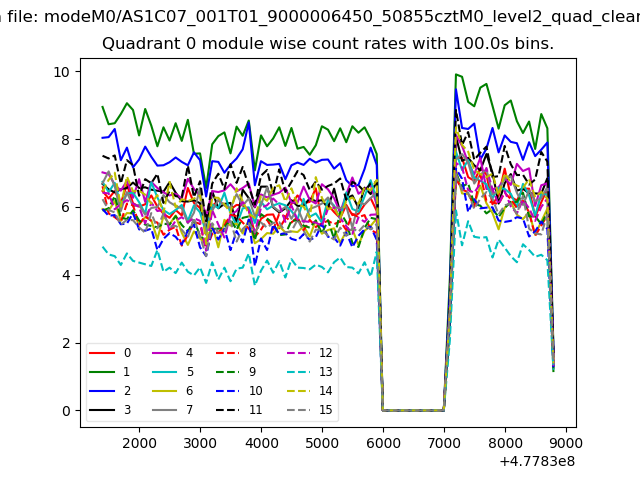 |
 |
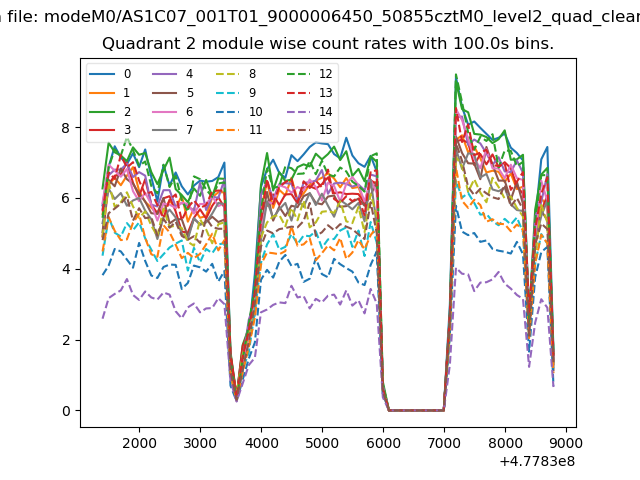
| Module-wise count rates for Quadrant B Data is divided into 100 sec bins |
 |
 |
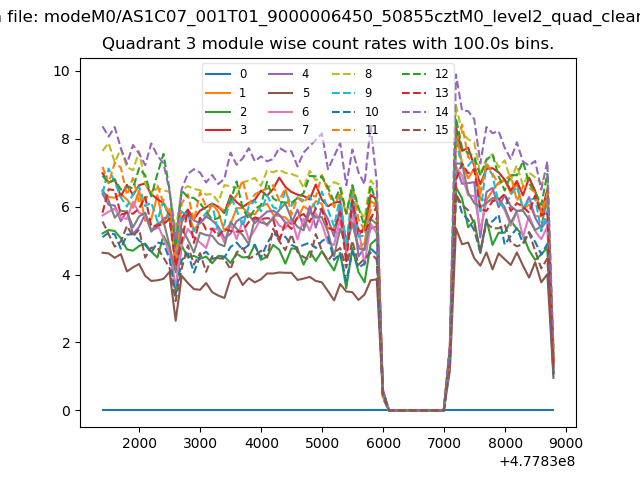
| Module-wise count rates for Quadrant C Data is divided into 100 sec bins |
 |
 |
| Module-wise count rates for Quadrant D Data is divided into 100 sec bins |
 |
 |
| Parameter | Plot |
|---|---|
| CZT HV Monitor | 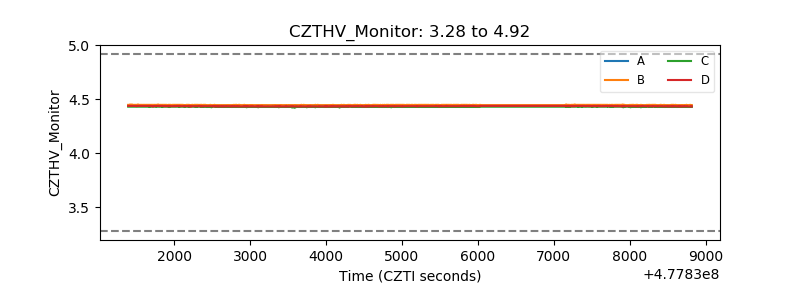 |
| D_VDD | 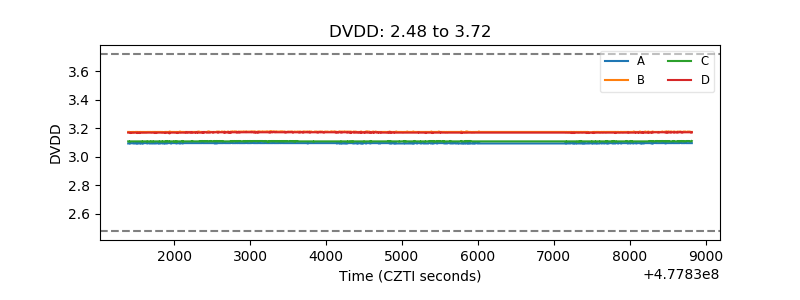 |
| Temperature 1 | 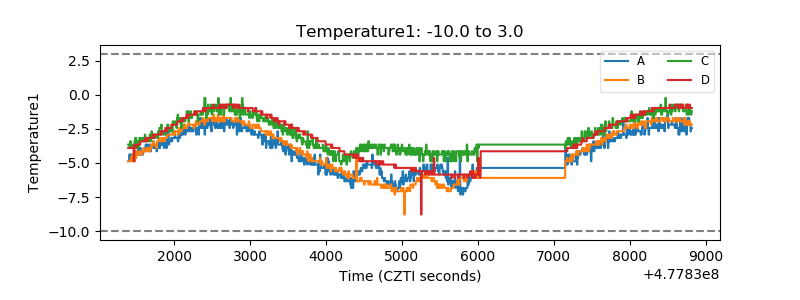 |
| Veto HV Monitor | 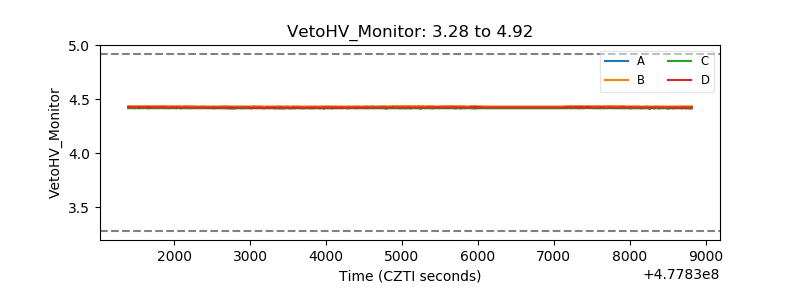 |
| Veto LLD | 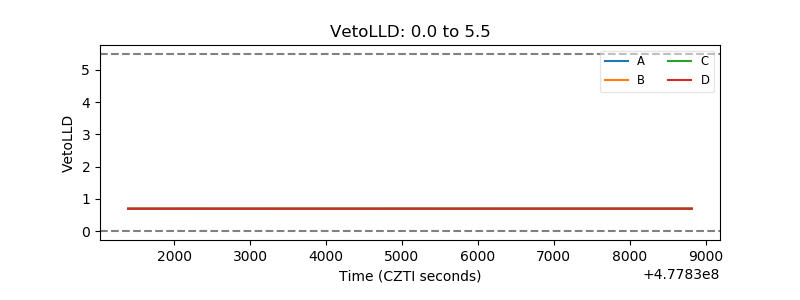 |
| Alpha Counter | 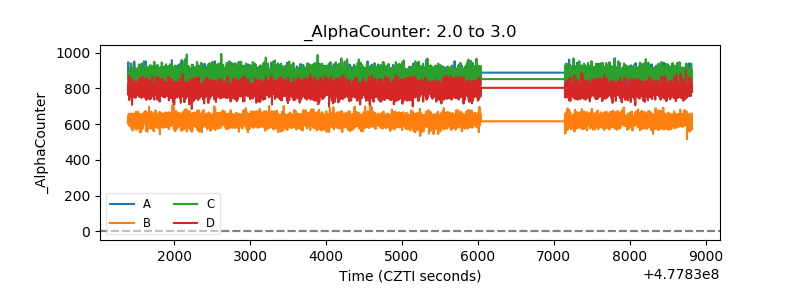 |
| _CPM_Rate | 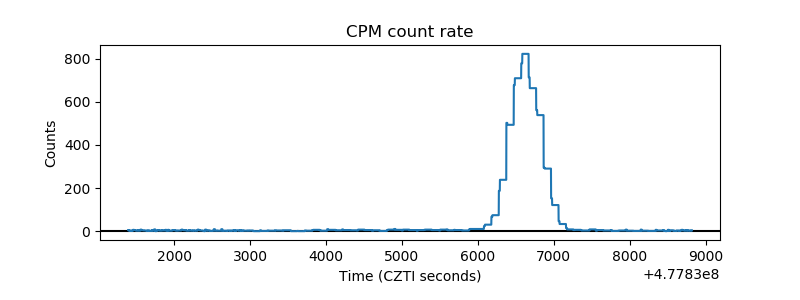 |
| CZT Counter | 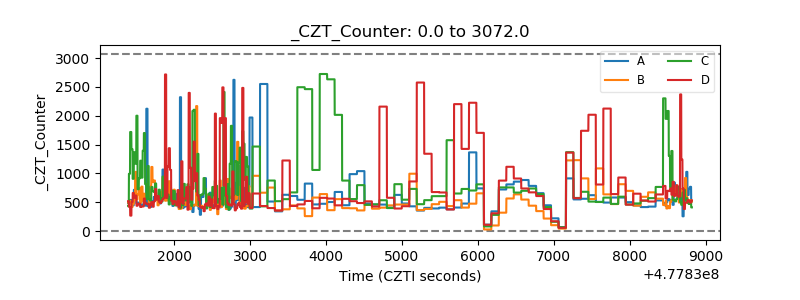 |
| +2.5 Volts monitor | 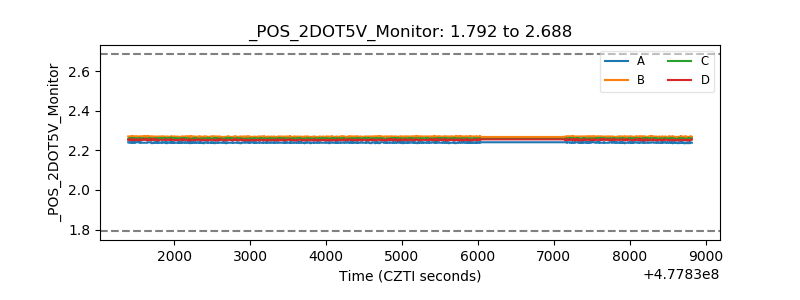 |
| +5 Volts monitor | 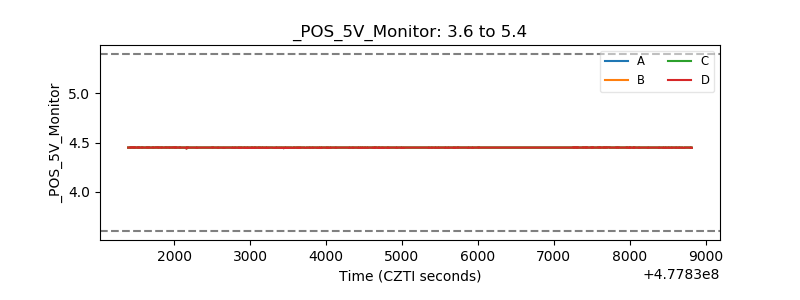 |
| _ROLL_ROT | 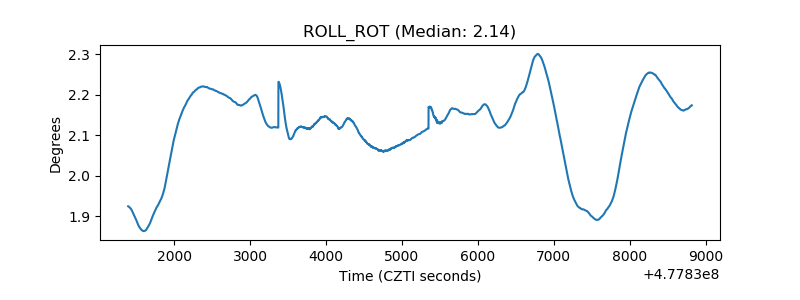 |
| _Roll_DEC | 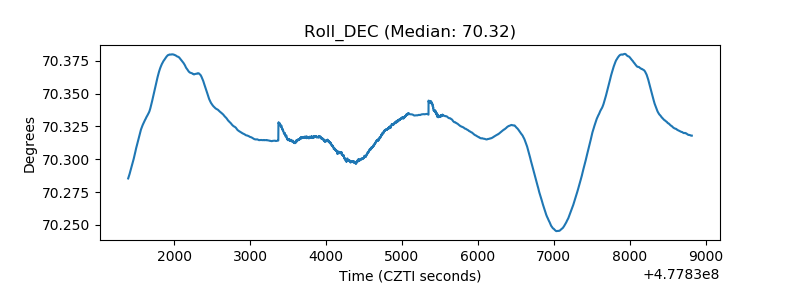 |
| _Roll_RA | 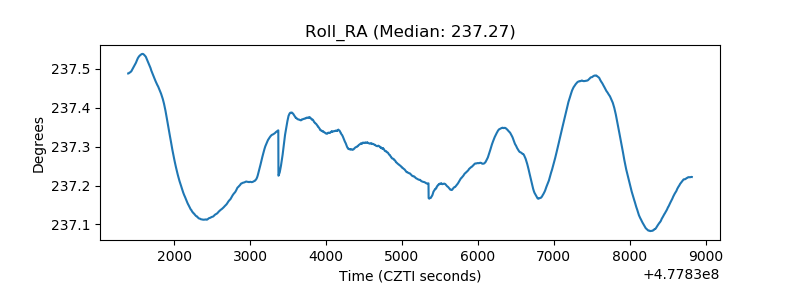 |
| Veto Counter | 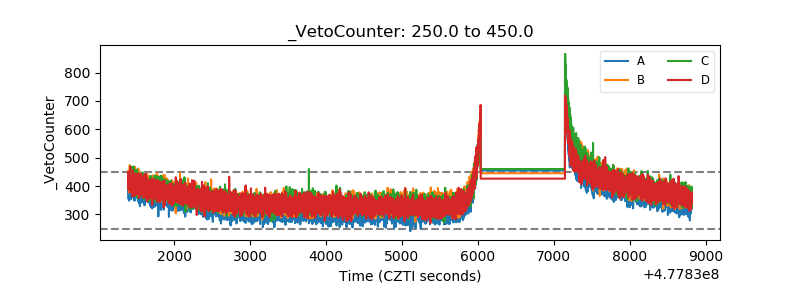 |