| Param | Original file | Final file |
|---|---|---|
| Filename | modeM0/AS1C07_001T01_9000006450_50856cztM0_level2.fits | modeM0/AS1C07_001T01_9000006450_50856cztM0_level2_quad_clean.evt |
| Size (bytes) | 597,193,920 | 89,017,920 |
| Size | 569.5 MB | 84.9 MB |
| Events in quadrant A | 6,855,363 | 557,371 |
| Events in quadrant B | 3,424,699 | 664,498 |
| Events in quadrant C | 5,124,263 | 538,639 |
| Events in quadrant D | 6,218,776 | 499,317 |
| Mode SS | |||
|---|---|---|---|
| Quadrant | BADHDUFLAG | Total packets | Discarded packets |
| A | 0 | 128 | 0 |
| B | 0 | 128 | 0 |
| C | 0 | 128 | 0 |
| D | 0 | 128 | 0 |
| Mode M0 | |||
|---|---|---|---|
| Quadrant | BADHDUFLAG | Total packets | Discarded packets |
| A | 0 | 24533 | 1 |
| B | 0 | 14434 | 1 |
| C | 0 | 19419 | 1 |
| D | 0 | 22759 | 1 |
| Mode M9 | |||
|---|---|---|---|
| Quadrant | BADHDUFLAG | Total packets | Discarded packets |
| A | 0 | 11 | 0 |
| B | 0 | 11 | 0 |
| C | 0 | 11 | 0 |
| D | 0 | 11 | 0 |
| Quadrant | Total seconds | Saturated seconds | Saturation percentage |
|---|---|---|---|
| A | 6233 | 872 | 13.990053% |
| B | 6234 | 195 | 3.128008% |
| C | 6233 | 678 | 10.877587% |
| D | 6233 | 828 | 13.284133% |
Noise dominated data is calculated using 1-second bins in cleaned event files. If a bin has >2000 counts, and if more than 50% of those come from <1% of pixels, then it is considered to be noise-dominated and hence unusable.
| Quadrant | # 1 sec bins | Bins with >0 counts | Bins with >2000 counts | High rate bins dominated by noise | Noise dominated (total time) | Noise dominated (detector-on time) | Marked lightcurve |
|---|---|---|---|---|---|---|---|
| A | 7393 | 6233 | 677 | 677 | 9.16% | 10.86% | 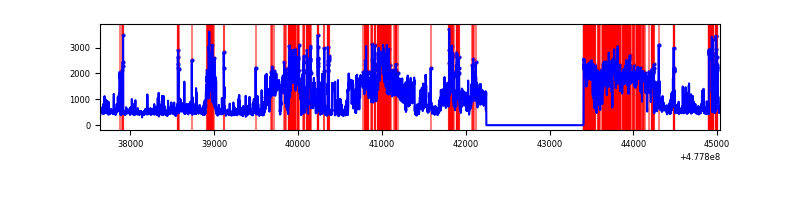 |
| B | 7394 | 6234 | 65 | 65 | 0.88% | 1.04% | 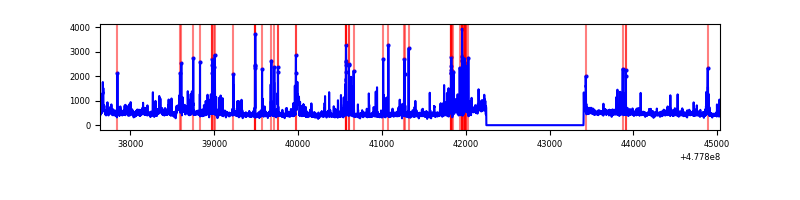 |
| C | 7393 | 6234 | 513 | 513 | 6.94% | 8.23% | 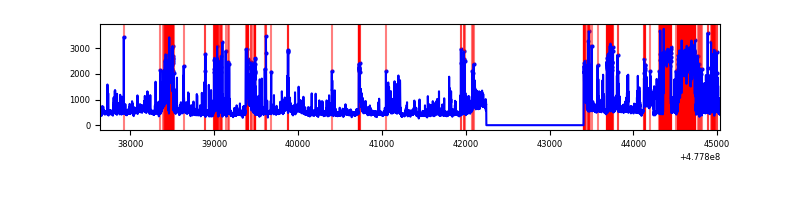 |
| D | 7393 | 6234 | 649 | 649 | 8.78% | 10.41% | 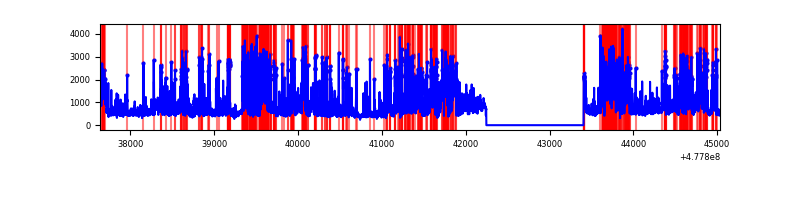 |
Top three noisy pixels from each quadrant. If the there are fewer than three noisy pixels in the level2.evt file, extra rows are filled as -1
| Pixel properties | Quadrant properties | ||||||
|---|---|---|---|---|---|---|---|
| Quadrant | DetID | PixID | Counts | Sigma | Mean | Median | Sigma |
| A | 12 | 80 | 2674817 | 16382.77 | 656 | 638 | 163.2 |
| A | 7 | 221 | 338425 | 2069.38 | 656 | 638 | 163.2 |
| A | 4 | 4 | 320878 | 1961.88 | 656 | 638 | 163.2 |
| B | 5 | 172 | 124888 | 864.34 | 672 | 648 | 143.7 |
| B | 4 | 81 | 113825 | 787.38 | 672 | 648 | 143.7 |
| B | 8 | 128 | 112549 | 778.5 | 672 | 648 | 143.7 |
| C | 12 | 2 | 766263 | 4399.58 | 635 | 630 | 174.0 |
| C | 1 | 29 | 546079 | 3134.33 | 635 | 630 | 174.0 |
| C | 4 | 5 | 188845 | 1081.55 | 635 | 630 | 174.0 |
| D | 2 | 216 | 1212242 | 6873.9 | 632 | 609 | 176.3 |
| D | 8 | 48 | 513325 | 2908.77 | 632 | 609 | 176.3 |
| D | 1 | 47 | 274460 | 1553.62 | 632 | 609 | 176.3 |
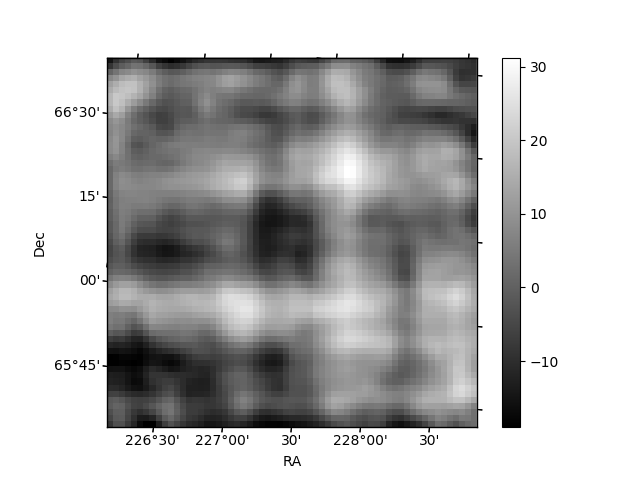
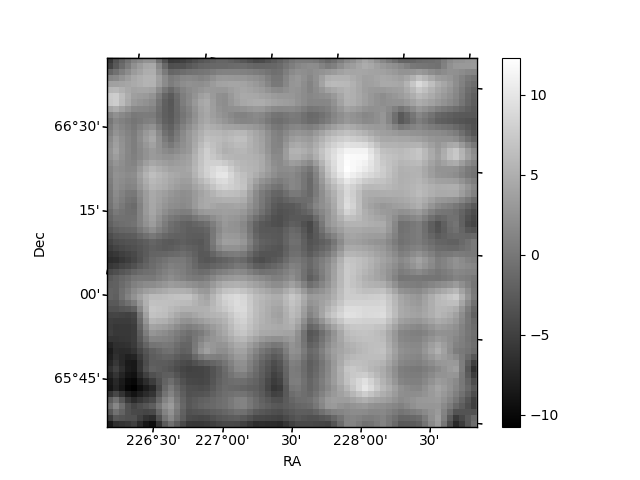
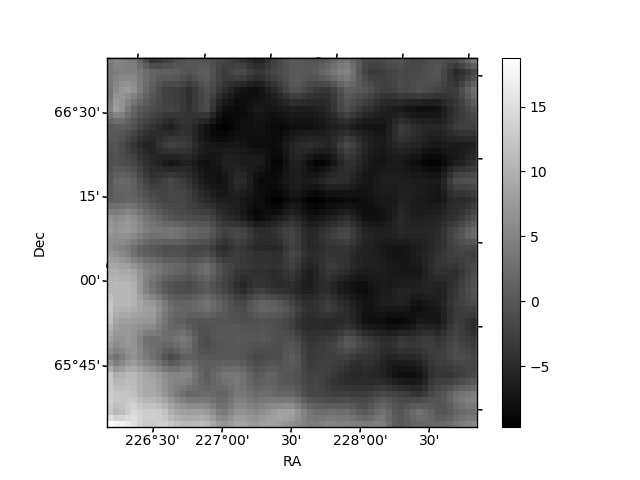
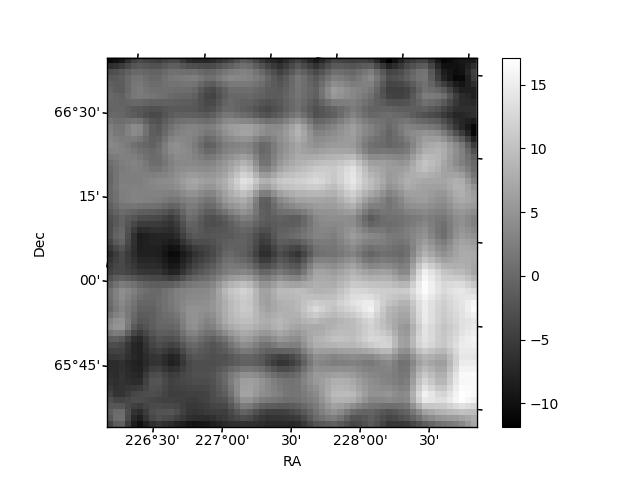
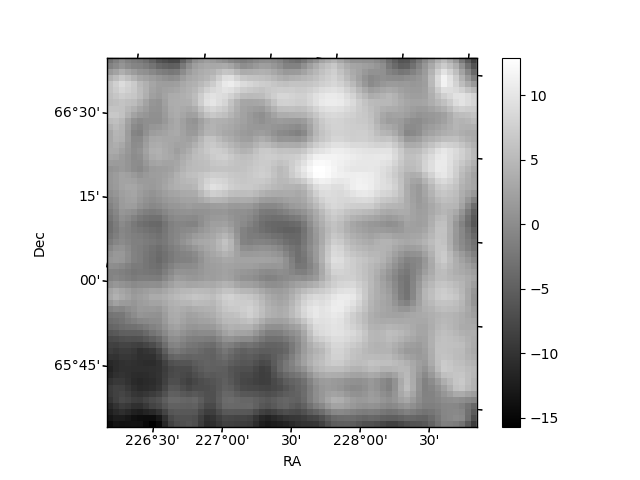
Histogram calculated using DETX and DETY for each event in the final _common_clean file
| Quadrant A | 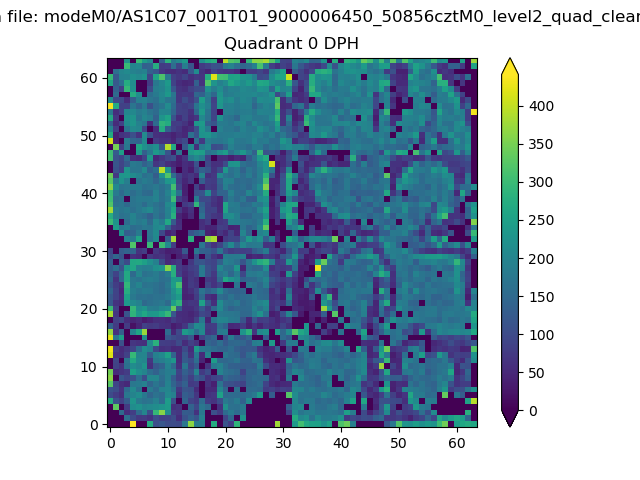 |
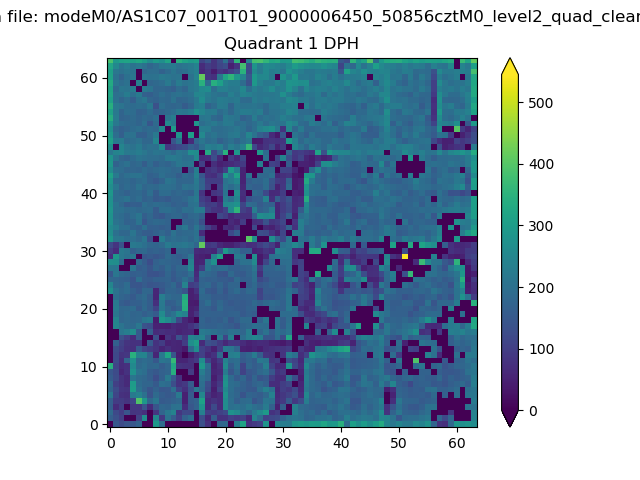 |
Quadrant B |
|---|---|---|---|
| Quadrant D | 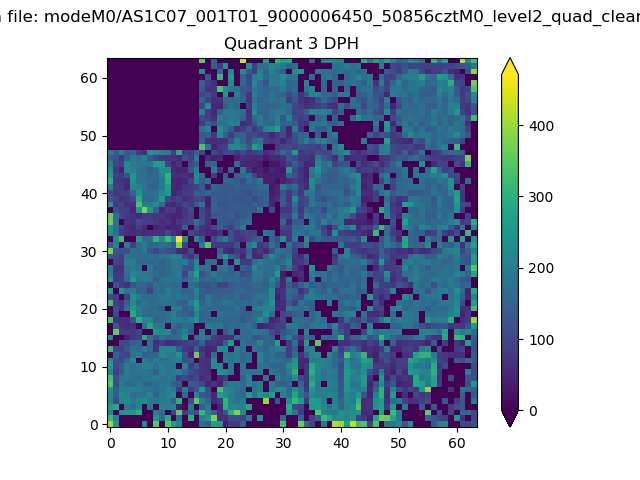 |
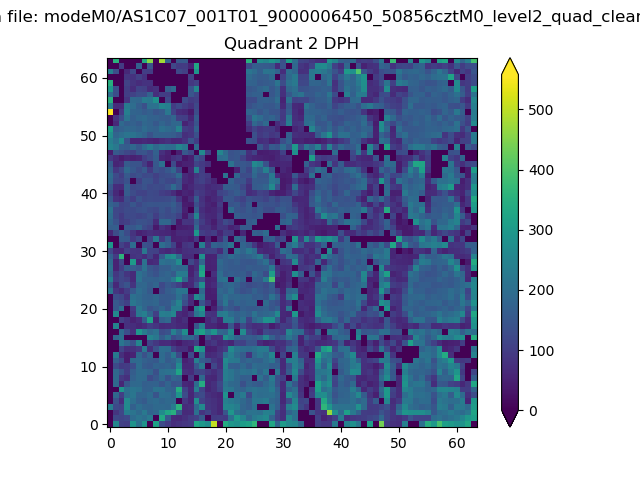 |
Quadrant C |
| Plot type | Count rate plots | Images |
|---|---|---|
| Comparison with Poisson distribution Blue bars denote a histogram of data divided into 1 sec bins. Red curve is a Poisson curve with rate = median count rate of data. |
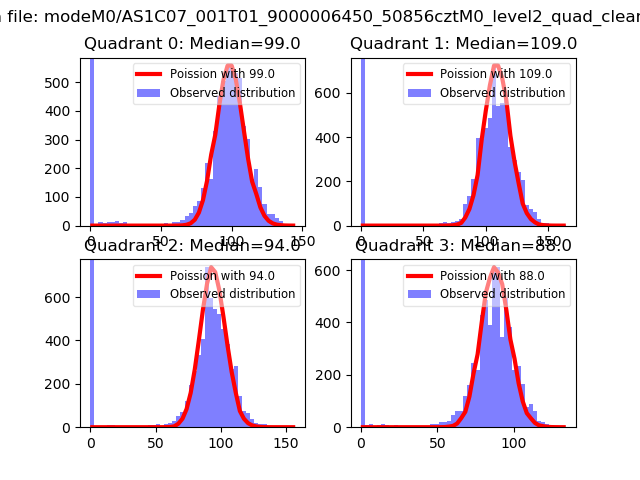 |
 |
| Quadrant-wise count rates Data is divided into 100 sec bins |
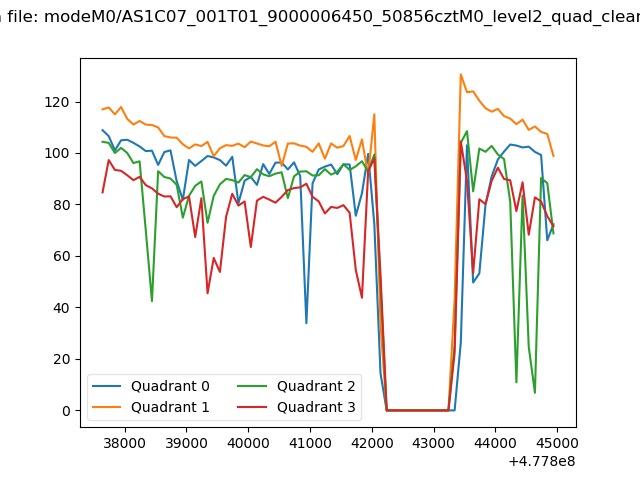 |
|
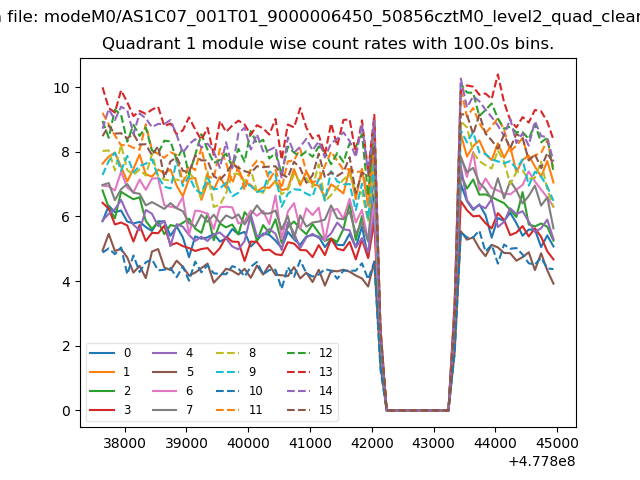
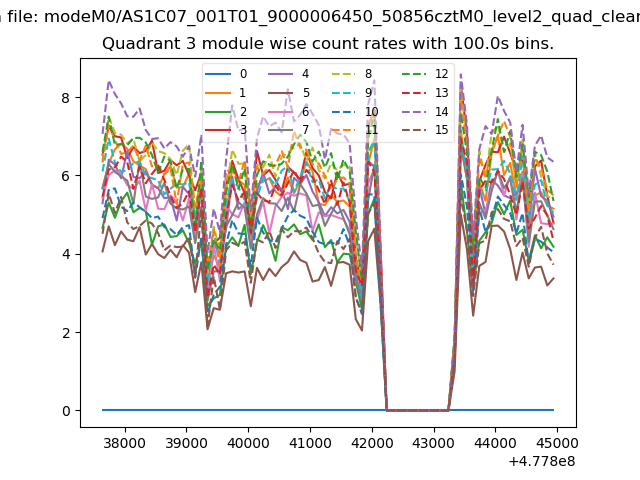
| Module-wise count rates for Quadrant A Data is divided into 100 sec bins |
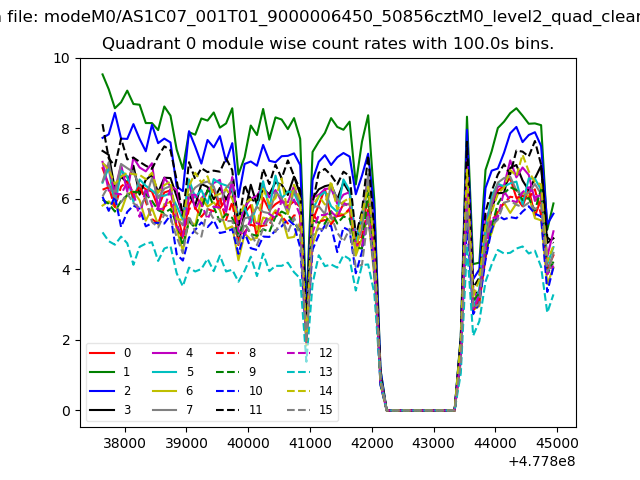 |
 |
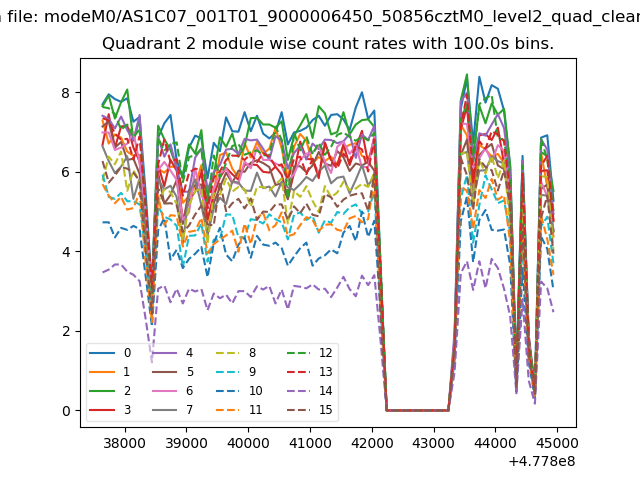
| Module-wise count rates for Quadrant B Data is divided into 100 sec bins |
 |
 |
| Module-wise count rates for Quadrant C Data is divided into 100 sec bins |
 |
 |
| Module-wise count rates for Quadrant D Data is divided into 100 sec bins |
 |
 |
| Parameter | Plot |
|---|---|
| CZT HV Monitor |  |
| D_VDD | 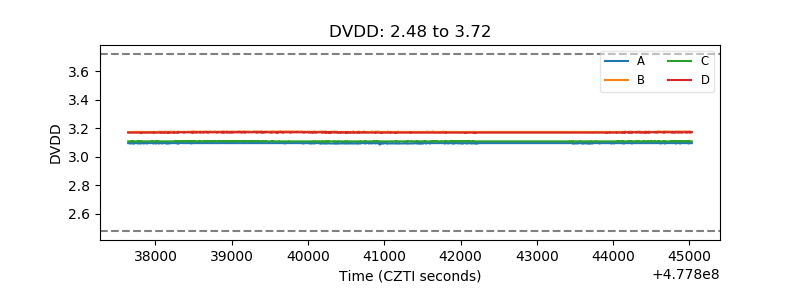 |
| Temperature 1 | 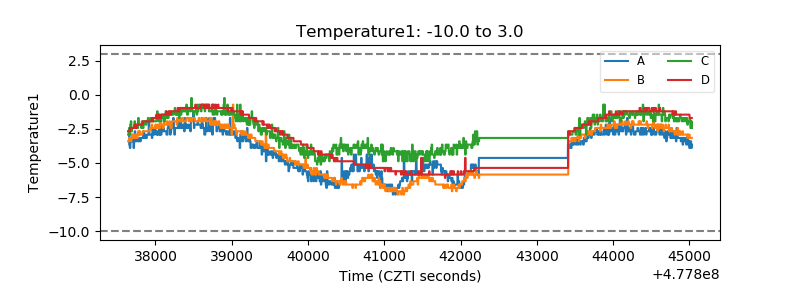 |
| Veto HV Monitor | 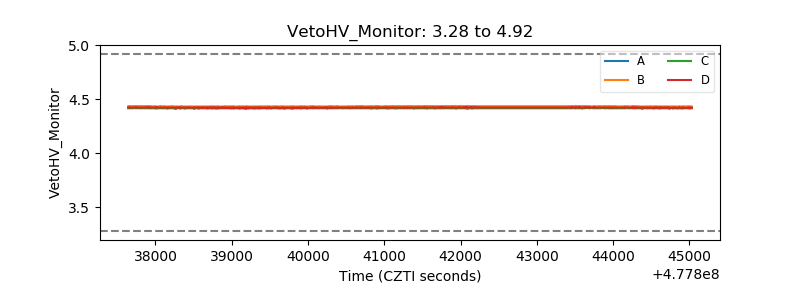 |
| Veto LLD | 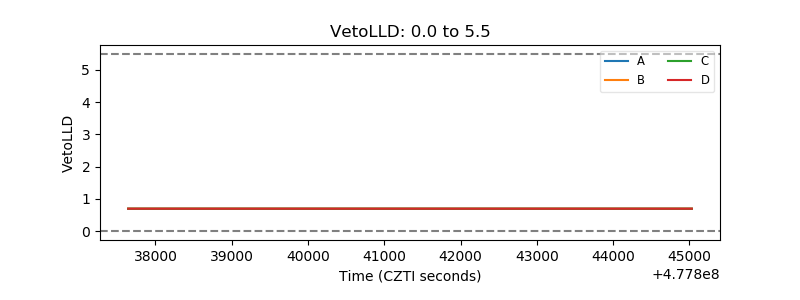 |
| Alpha Counter | 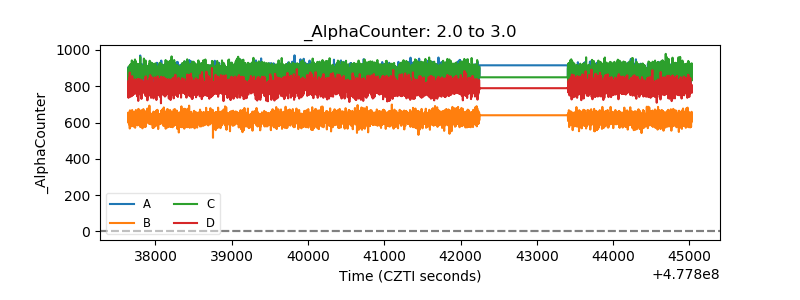 |
| _CPM_Rate | 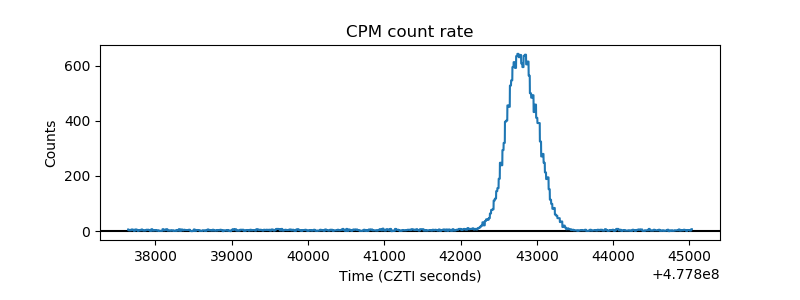 |
| CZT Counter |  |
| +2.5 Volts monitor | 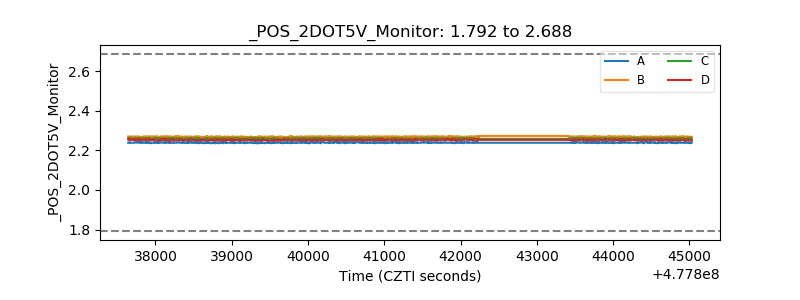 |
| +5 Volts monitor | 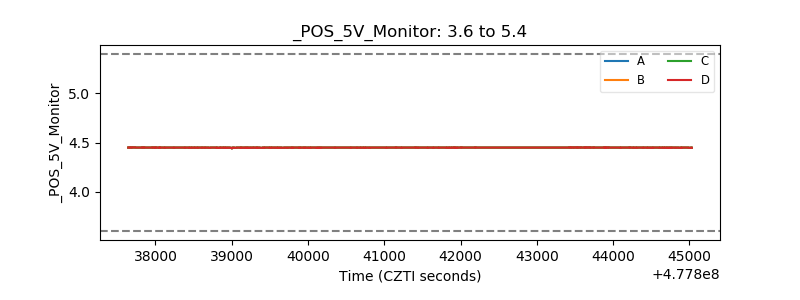 |
| _ROLL_ROT | 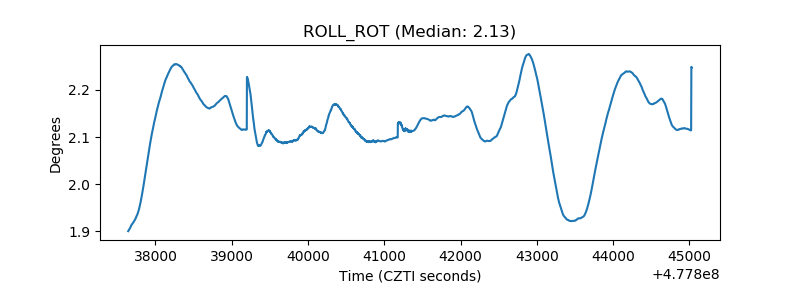 |
| _Roll_DEC | 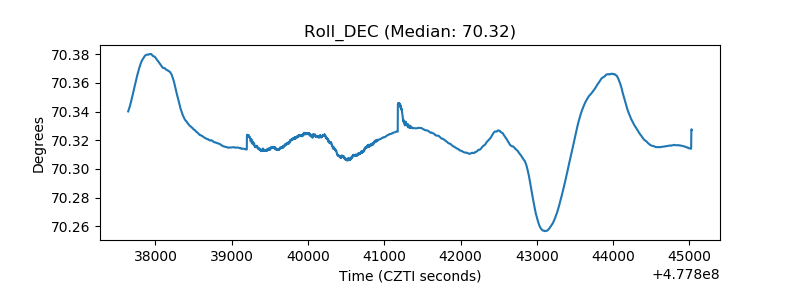 |
| _Roll_RA | 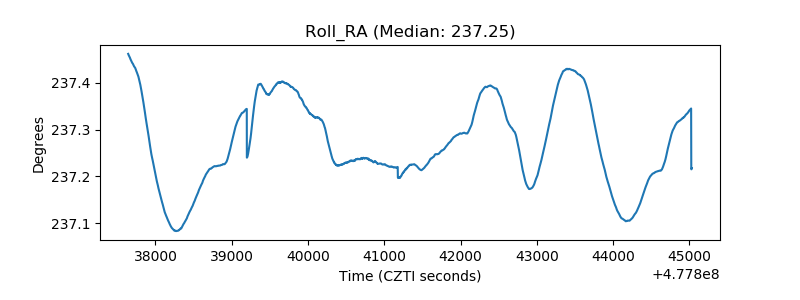 |
| Veto Counter | 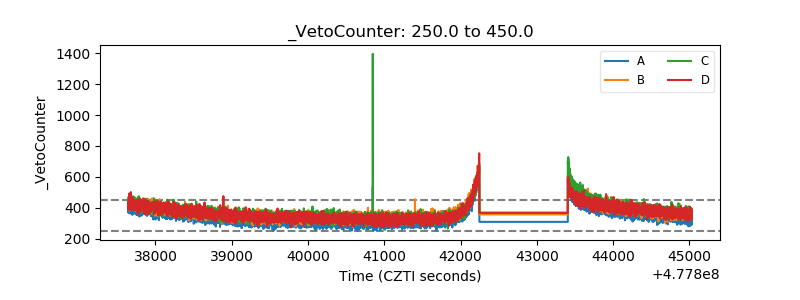 |