| Param | Original file | Final file |
|---|---|---|
| Filename | modeM0/AS1C07_001T01_9000006450_50857cztM0_level2.fits | modeM0/AS1C07_001T01_9000006450_50857cztM0_level2_quad_clean.evt |
| Size (bytes) | 605,122,560 | 86,901,120 |
| Size | 577.1 MB | 82.9 MB |
| Events in quadrant A | 4,579,509 | 600,423 |
| Events in quadrant B | 3,726,411 | 659,877 |
| Events in quadrant C | 7,508,129 | 429,041 |
| Events in quadrant D | 6,096,331 | 501,469 |
| Mode SS | |||
|---|---|---|---|
| Quadrant | BADHDUFLAG | Total packets | Discarded packets |
| A | 0 | 130 | 0 |
| B | 0 | 130 | 0 |
| C | 0 | 130 | 0 |
| D | 0 | 130 | 0 |
| Mode M0 | |||
|---|---|---|---|
| Quadrant | BADHDUFLAG | Total packets | Discarded packets |
| A | 0 | 17797 | 1 |
| B | 0 | 15517 | 1 |
| C | 0 | 26675 | 1 |
| D | 0 | 22456 | 7 |
| Mode M9 | |||
|---|---|---|---|
| Quadrant | BADHDUFLAG | Total packets | Discarded packets |
| A | 0 | 11 | 0 |
| B | 0 | 11 | 0 |
| C | 0 | 11 | 0 |
| D | 0 | 11 | 0 |
| Quadrant | Total seconds | Saturated seconds | Saturation percentage |
|---|---|---|---|
| A | 6304 | 369 | 5.853426% |
| B | 6304 | 275 | 4.362310% |
| C | 6304 | 1943 | 30.821701% |
| D | 6303 | 813 | 12.898620% |
Noise dominated data is calculated using 1-second bins in cleaned event files. If a bin has >2000 counts, and if more than 50% of those come from <1% of pixels, then it is considered to be noise-dominated and hence unusable.
| Quadrant | # 1 sec bins | Bins with >0 counts | Bins with >2000 counts | High rate bins dominated by noise | Noise dominated (total time) | Noise dominated (detector-on time) | Marked lightcurve |
|---|---|---|---|---|---|---|---|
| A | 7429 | 6304 | 274 | 274 | 3.69% | 4.35% | 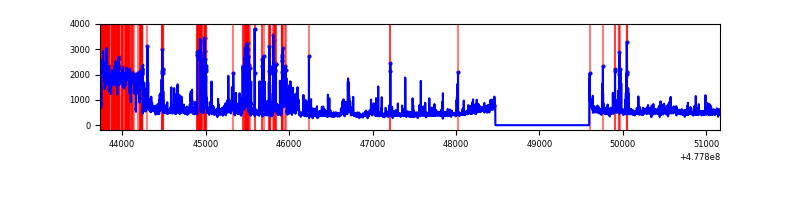 |
| B | 7429 | 6304 | 137 | 137 | 1.84% | 2.17% | 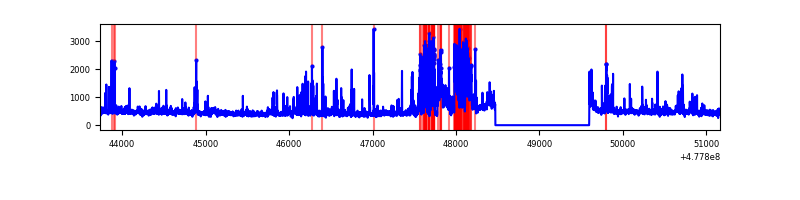 |
| C | 7429 | 6304 | 1321 | 1321 | 17.78% | 20.95% | 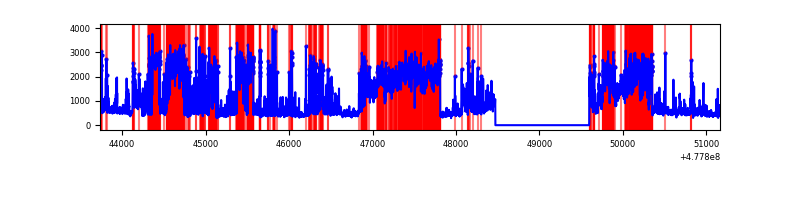 |
| D | 7428 | 6304 | 755 | 755 | 10.16% | 11.98% |  |
Top three noisy pixels from each quadrant. If the there are fewer than three noisy pixels in the level2.evt file, extra rows are filled as -1
| Pixel properties | Quadrant properties | ||||||
|---|---|---|---|---|---|---|---|
| Quadrant | DetID | PixID | Counts | Sigma | Mean | Median | Sigma |
| A | 12 | 80 | 762370 | 4555.76 | 677 | 662 | 167.2 |
| A | 7 | 221 | 343362 | 2049.68 | 677 | 662 | 167.2 |
| A | 8 | 38 | 148095 | 881.79 | 677 | 662 | 167.2 |
| B | 8 | 128 | 685563 | 4757.98 | 675 | 651 | 144.0 |
| B | 0 | 216 | 50970 | 349.56 | 675 | 651 | 144.0 |
| B | 0 | 172 | 46829 | 320.79 | 675 | 651 | 144.0 |
| C | 1 | 29 | 2261857 | 15032.94 | 555 | 550 | 150.4 |
| C | 7 | 220 | 995549 | 6614.65 | 555 | 550 | 150.4 |
| C | 12 | 2 | 781367 | 5190.79 | 555 | 550 | 150.4 |
| D | 15 | 108 | 649496 | 3674.33 | 625 | 601 | 176.6 |
| D | 2 | 153 | 535383 | 3028.17 | 625 | 601 | 176.6 |
| D | 1 | 47 | 390646 | 2208.61 | 625 | 601 | 176.6 |
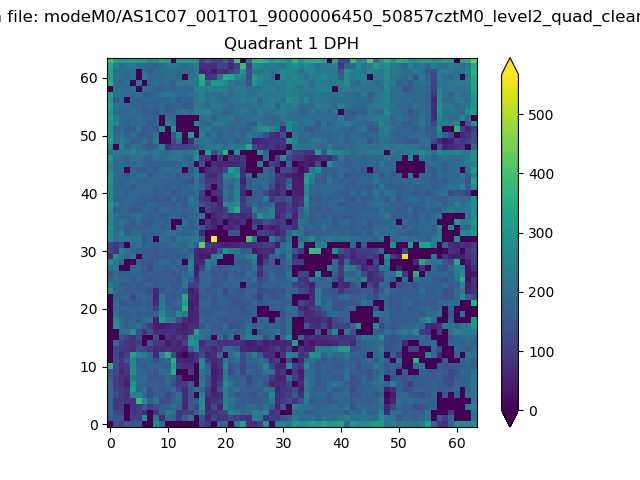
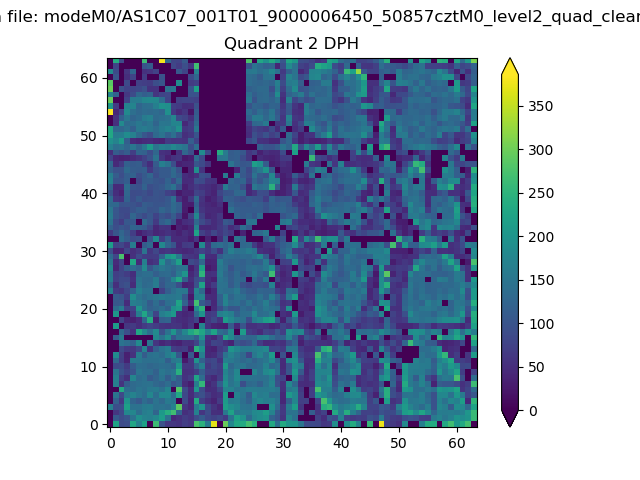
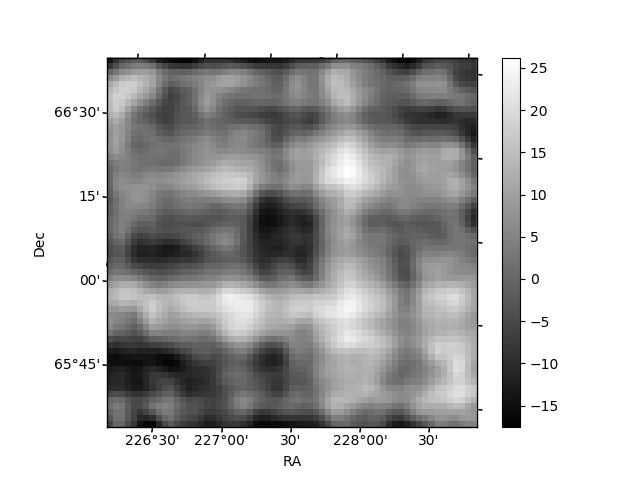
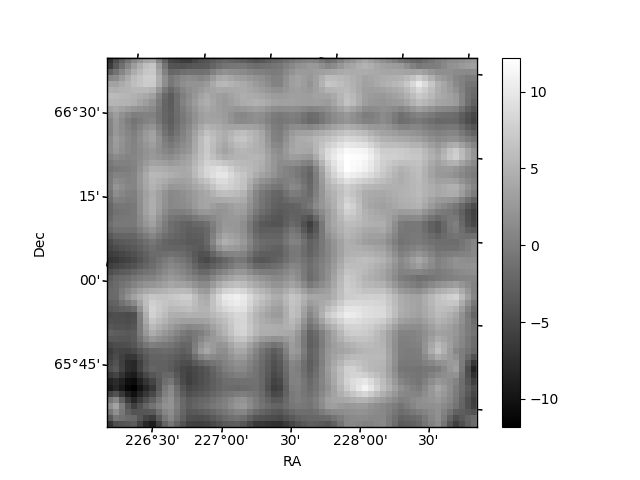
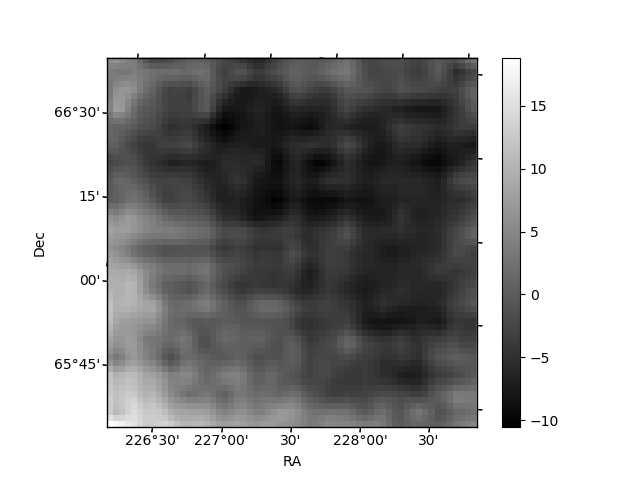
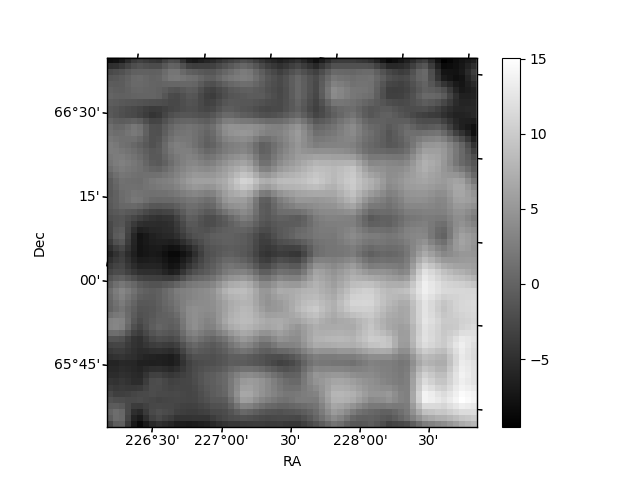
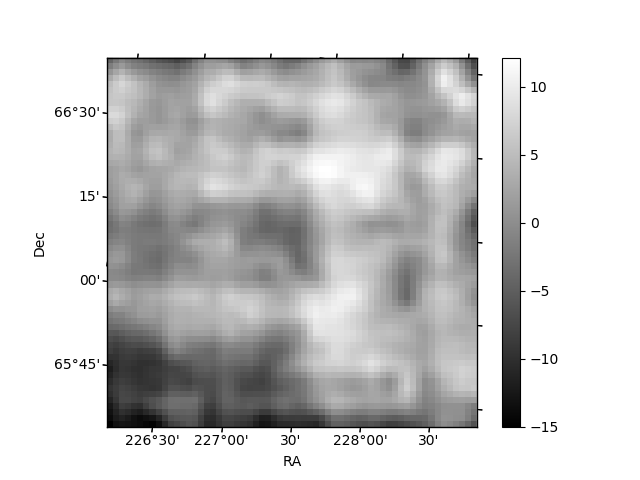
Histogram calculated using DETX and DETY for each event in the final _common_clean file
| Quadrant A | 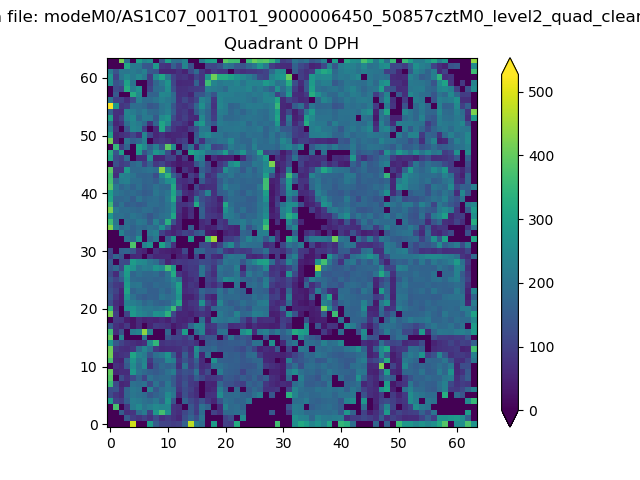 |
 |
Quadrant B |
|---|---|---|---|
| Quadrant D | 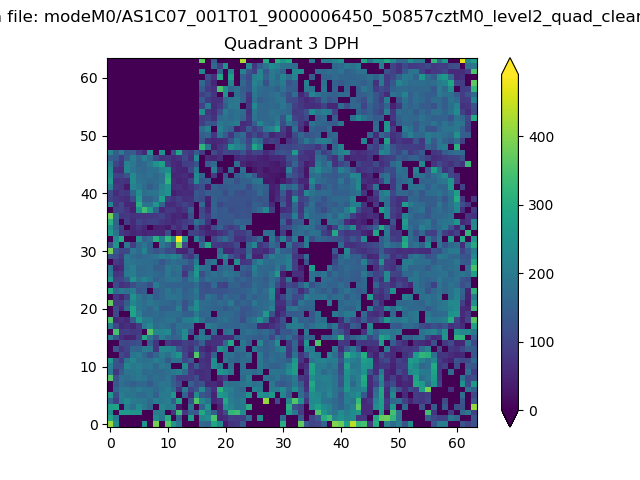 |
 |
Quadrant C |
| Plot type | Count rate plots | Images |
|---|---|---|
| Comparison with Poisson distribution Blue bars denote a histogram of data divided into 1 sec bins. Red curve is a Poisson curve with rate = median count rate of data. |
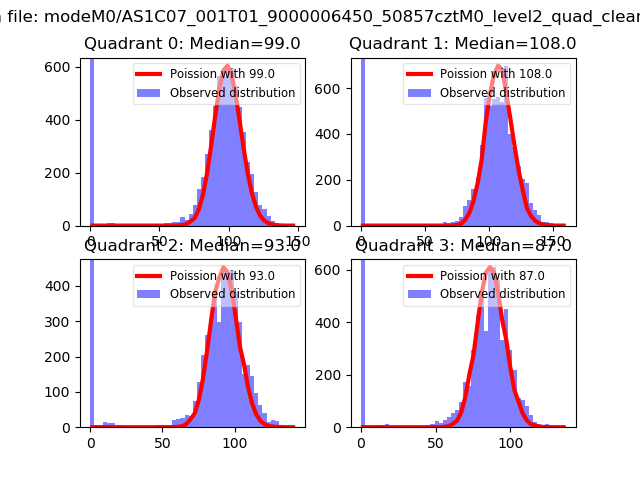 |
 |
| Quadrant-wise count rates Data is divided into 100 sec bins |
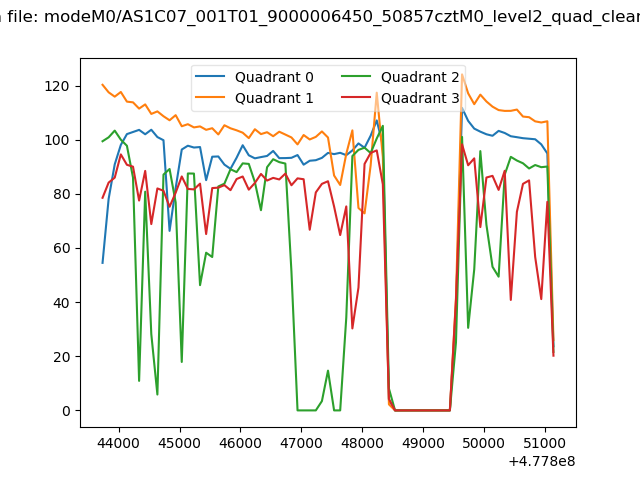 |
|
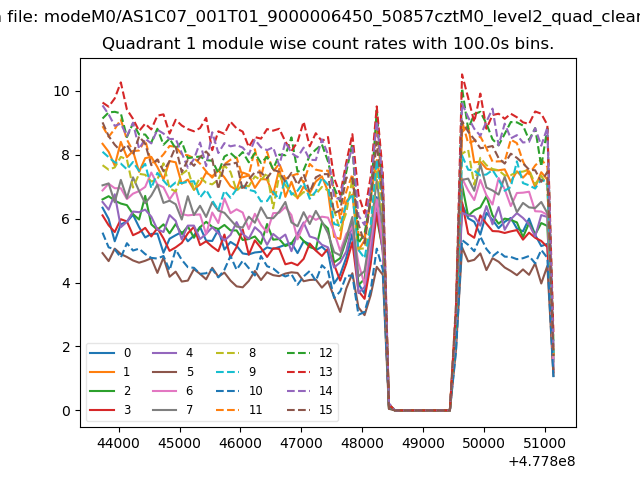
| Module-wise count rates for Quadrant A Data is divided into 100 sec bins |
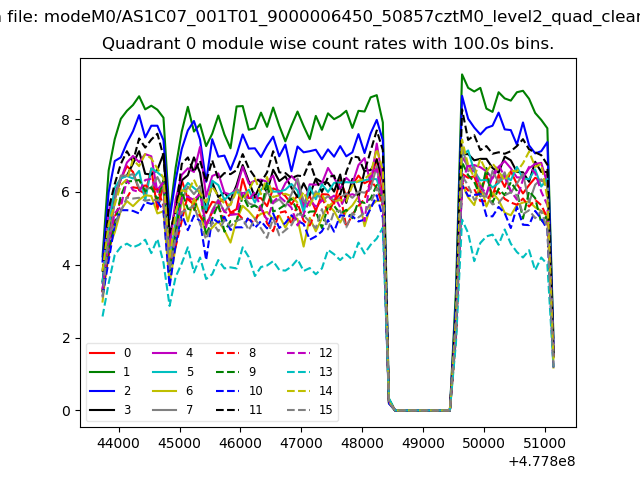 |
 |
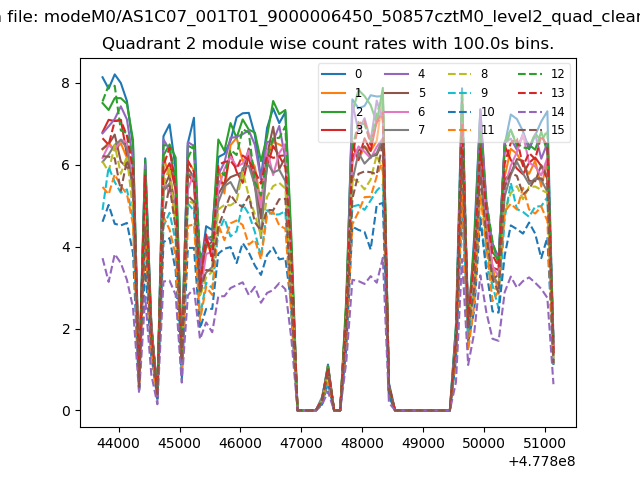
| Module-wise count rates for Quadrant B Data is divided into 100 sec bins |
 |
 |
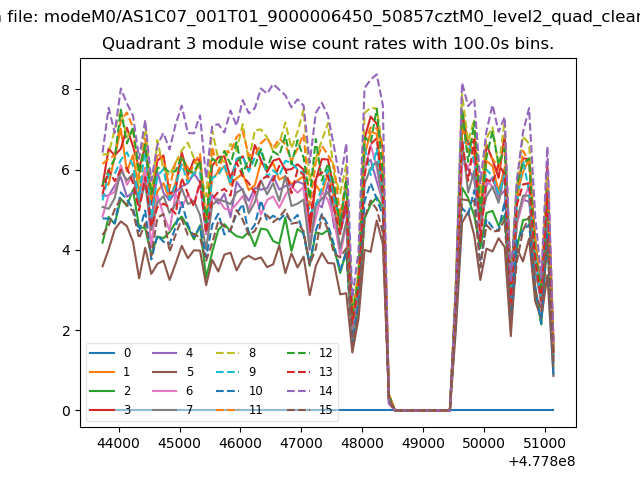
| Module-wise count rates for Quadrant C Data is divided into 100 sec bins |
 |
 |
| Module-wise count rates for Quadrant D Data is divided into 100 sec bins |
 |
 |
| Parameter | Plot |
|---|---|
| CZT HV Monitor | 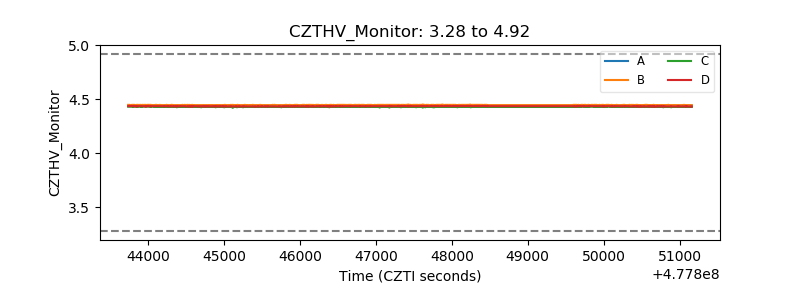 |
| D_VDD | 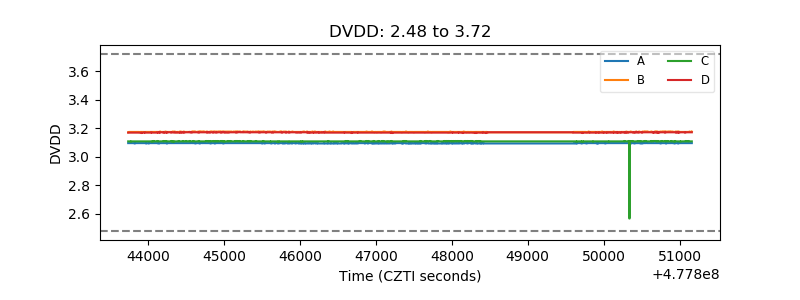 |
| Temperature 1 | 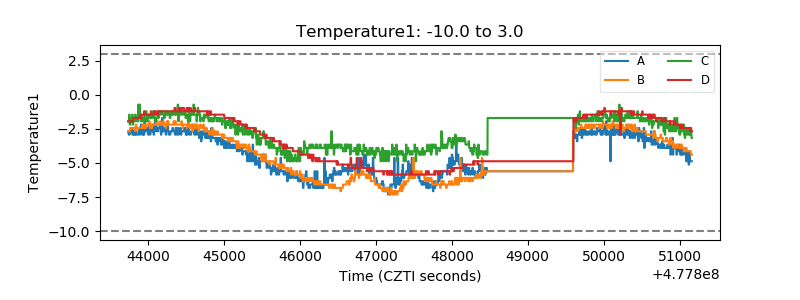 |
| Veto HV Monitor | 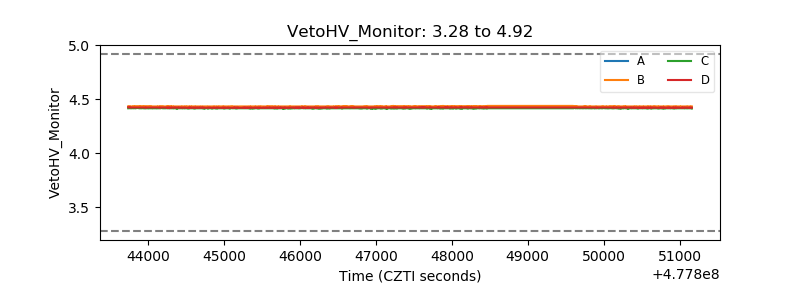 |
| Veto LLD | 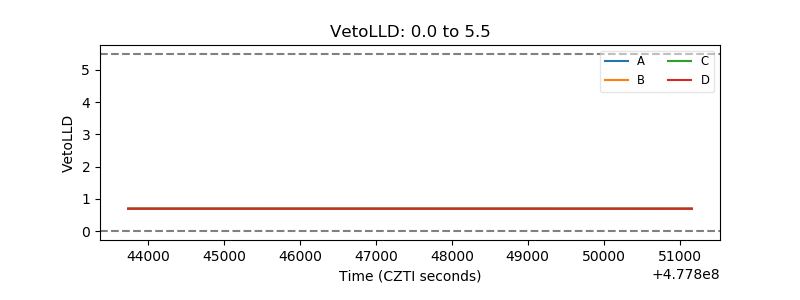 |
| Alpha Counter | 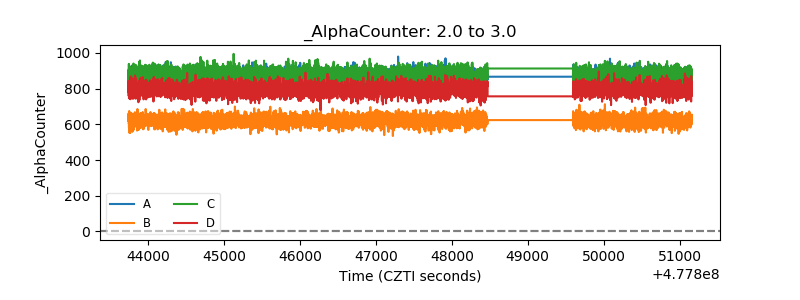 |
| _CPM_Rate | 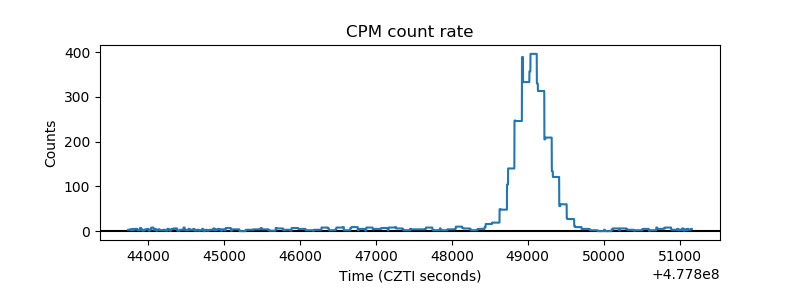 |
| CZT Counter | 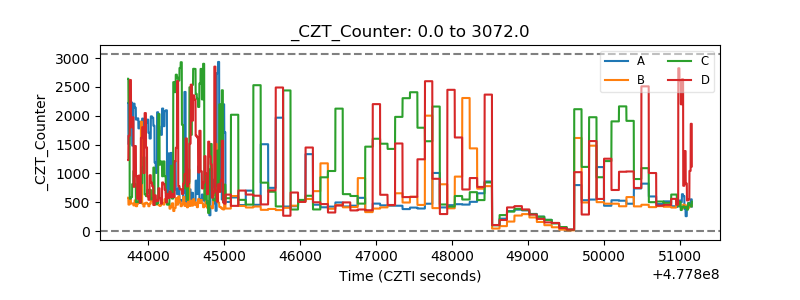 |
| +2.5 Volts monitor | 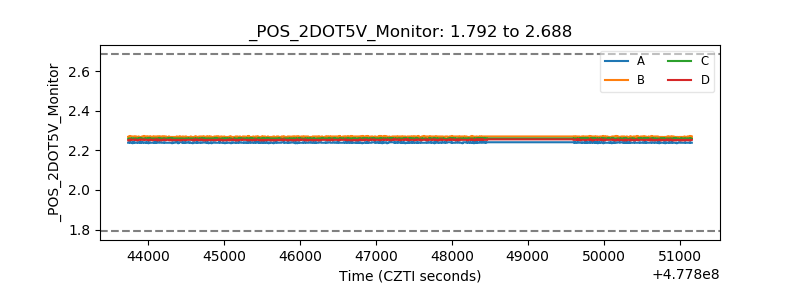 |
| +5 Volts monitor | 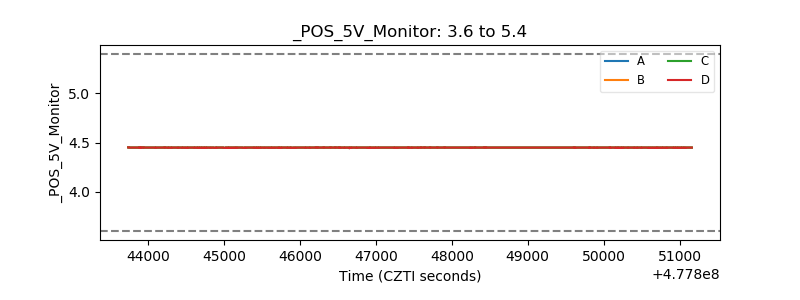 |
| _ROLL_ROT | 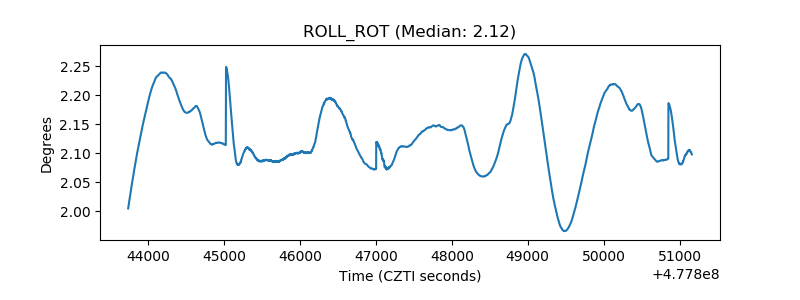 |
| _Roll_DEC | 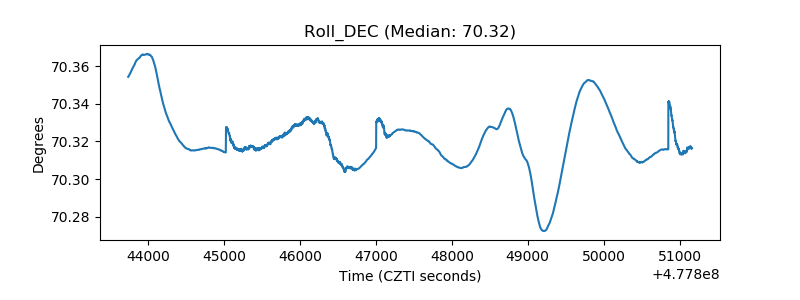 |
| _Roll_RA | 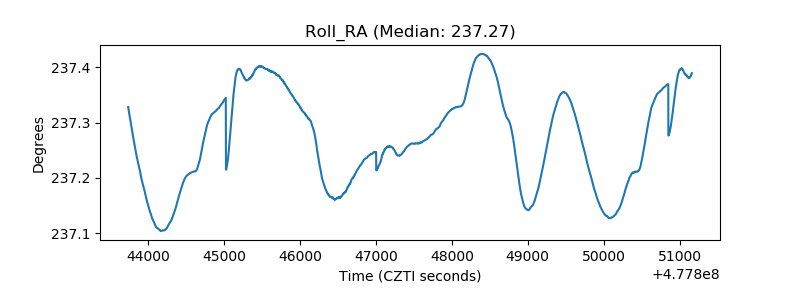 |
| Veto Counter | 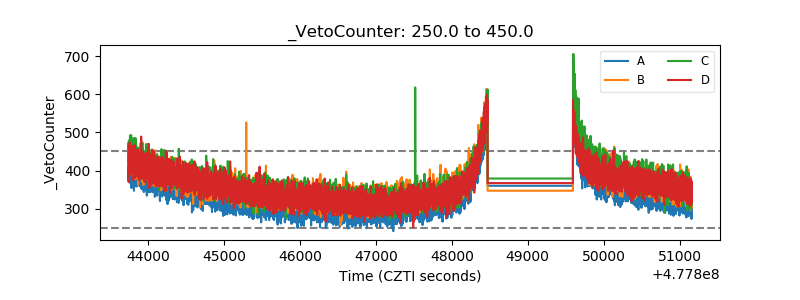 |