| Param | Original file | Final file |
|---|---|---|
| Filename | modeM0/AS1C07_001T01_9000006450_50858cztM0_level2.fits | modeM0/AS1C07_001T01_9000006450_50858cztM0_level2_quad_clean.evt |
| Size (bytes) | 547,464,960 | 93,329,280 |
| Size | 522.1 MB | 89.0 MB |
| Events in quadrant A | 4,362,257 | 616,444 |
| Events in quadrant B | 3,739,929 | 682,809 |
| Events in quadrant C | 5,743,490 | 548,201 |
| Events in quadrant D | 5,905,985 | 516,660 |
| Mode SS | |||
|---|---|---|---|
| Quadrant | BADHDUFLAG | Total packets | Discarded packets |
| A | 0 | 136 | 0 |
| B | 0 | 136 | 0 |
| C | 0 | 136 | 0 |
| D | 0 | 136 | 0 |
| Mode M0 | |||
|---|---|---|---|
| Quadrant | BADHDUFLAG | Total packets | Discarded packets |
| A | 0 | 17439 | 1 |
| B | 0 | 15716 | 1 |
| C | 0 | 21677 | 3 |
| D | 0 | 21992 | 1 |
| Mode M9 | |||
|---|---|---|---|
| Quadrant | BADHDUFLAG | Total packets | Discarded packets |
| A | 0 | 9 | 0 |
| B | 0 | 9 | 0 |
| C | 0 | 9 | 0 |
| D | 0 | 9 | 0 |
| Quadrant | Total seconds | Saturated seconds | Saturation percentage |
|---|---|---|---|
| A | 6615 | 340 | 5.139834% |
| B | 6616 | 206 | 3.113664% |
| C | 6615 | 802 | 12.123961% |
| D | 6615 | 842 | 12.728647% |
Noise dominated data is calculated using 1-second bins in cleaned event files. If a bin has >2000 counts, and if more than 50% of those come from <1% of pixels, then it is considered to be noise-dominated and hence unusable.
| Quadrant | # 1 sec bins | Bins with >0 counts | Bins with >2000 counts | High rate bins dominated by noise | Noise dominated (total time) | Noise dominated (detector-on time) | Marked lightcurve |
|---|---|---|---|---|---|---|---|
| A | 7550 | 6615 | 198 | 198 | 2.62% | 2.99% | 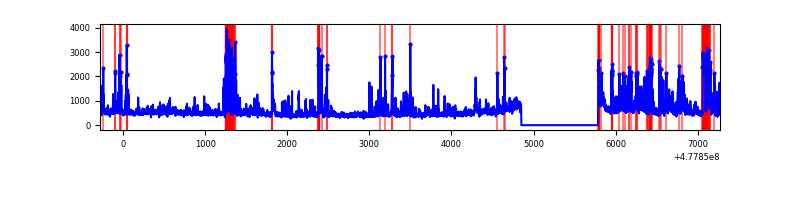 |
| B | 7551 | 6616 | 56 | 56 | 0.74% | 0.85% | 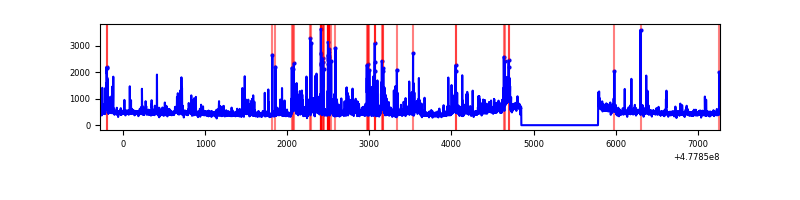 |
| C | 7550 | 6615 | 560 | 560 | 7.42% | 8.47% | 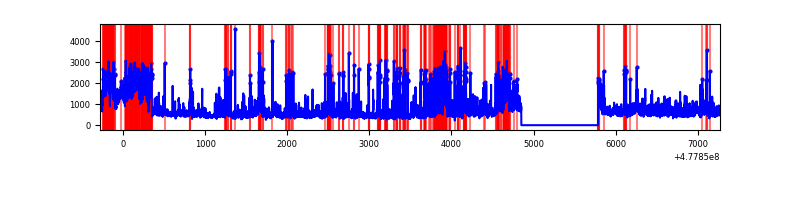 |
| D | 7550 | 6615 | 699 | 699 | 9.26% | 10.57% | 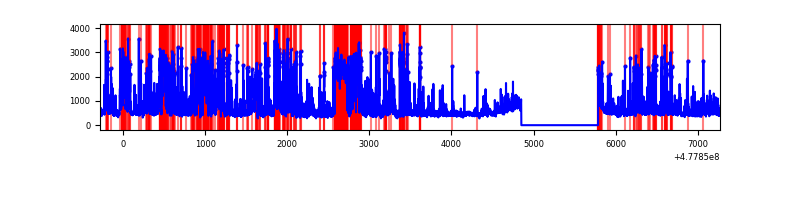 |
Top three noisy pixels from each quadrant. If the there are fewer than three noisy pixels in the level2.evt file, extra rows are filled as -1
| Pixel properties | Quadrant properties | ||||||
|---|---|---|---|---|---|---|---|
| Quadrant | DetID | PixID | Counts | Sigma | Mean | Median | Sigma |
| A | 8 | 38 | 349214 | 2020.79 | 701 | 685 | 172.5 |
| A | 10 | 253 | 296096 | 1712.81 | 701 | 685 | 172.5 |
| A | 4 | 3 | 162296 | 937.03 | 701 | 685 | 172.5 |
| B | 10 | 251 | 157689 | 1055.3 | 705 | 680 | 148.8 |
| B | 8 | 128 | 121124 | 809.54 | 705 | 680 | 148.8 |
| B | 0 | 229 | 112513 | 751.66 | 705 | 680 | 148.8 |
| C | 1 | 29 | 1053019 | 5747.04 | 668 | 664 | 183.1 |
| C | 7 | 220 | 525125 | 2864.15 | 668 | 664 | 183.1 |
| C | 13 | 96 | 459443 | 2505.45 | 668 | 664 | 183.1 |
| D | 2 | 153 | 1023807 | 5603.02 | 656 | 630 | 182.6 |
| D | 15 | 108 | 735410 | 4023.73 | 656 | 630 | 182.6 |
| D | 10 | 181 | 435797 | 2383.02 | 656 | 630 | 182.6 |
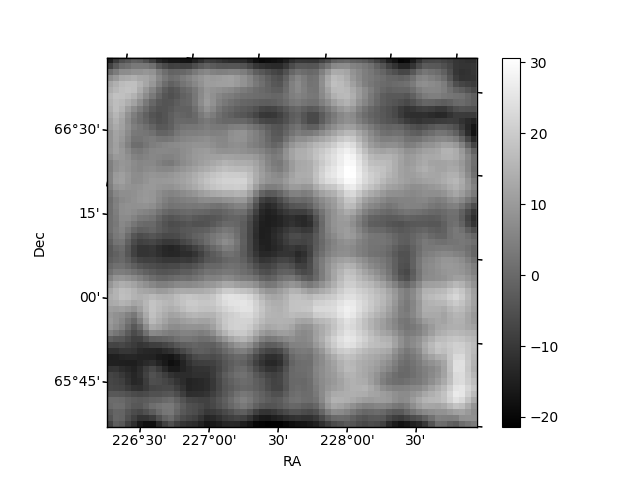
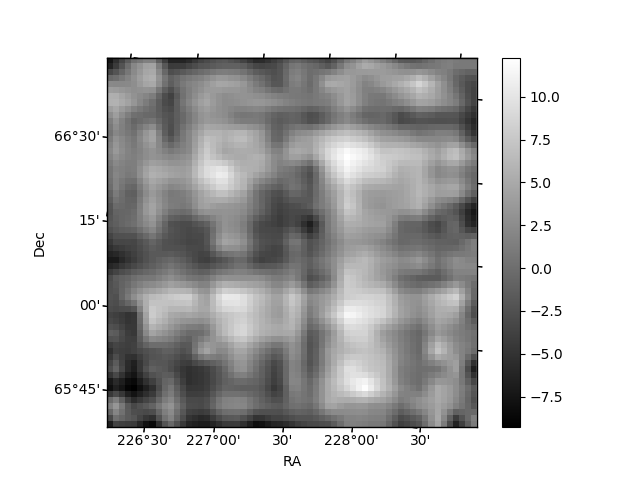
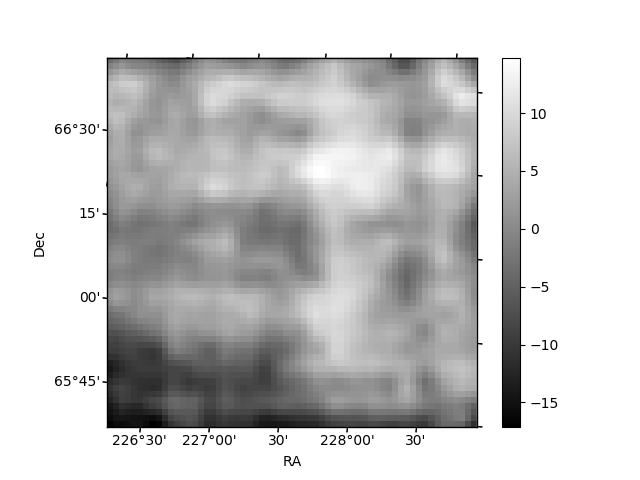
Histogram calculated using DETX and DETY for each event in the final _common_clean file
| Quadrant A | 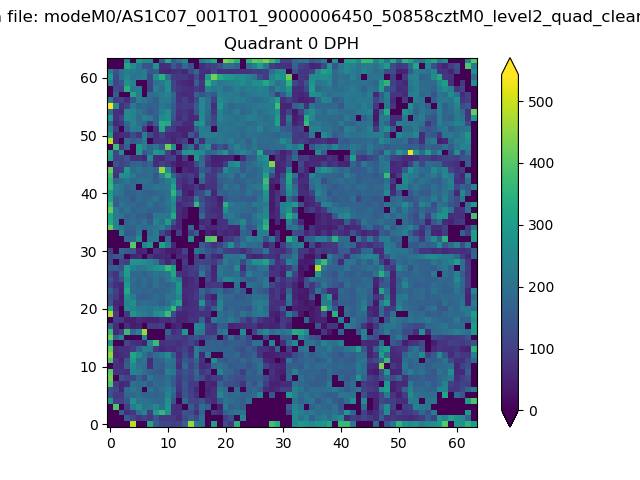 |
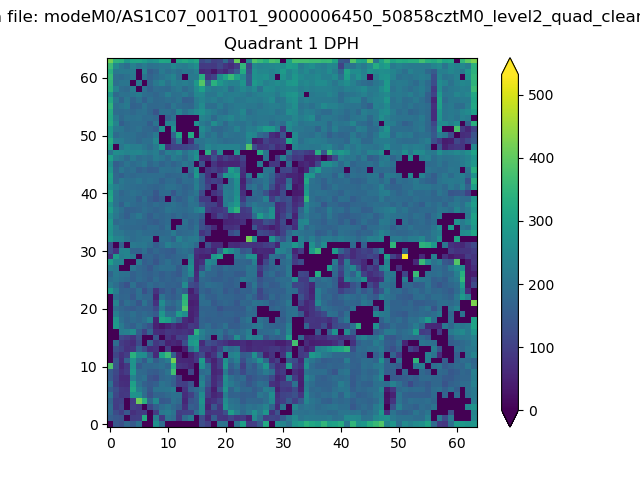 |
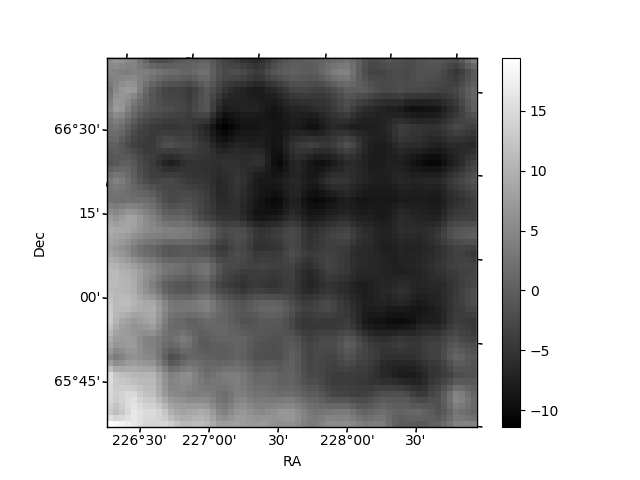
Quadrant B |
|---|---|---|---|
| Quadrant D | 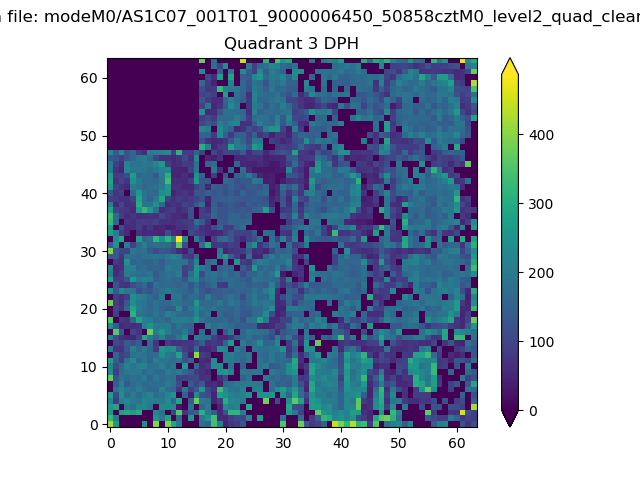 |
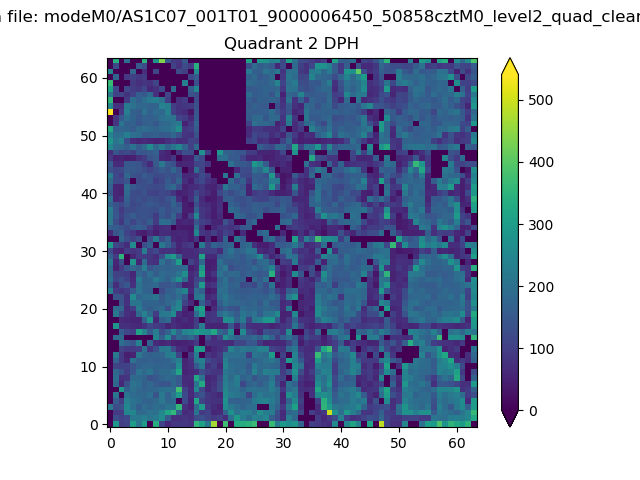 |
Quadrant C |
| Plot type | Count rate plots | Images |
|---|---|---|
| Comparison with Poisson distribution Blue bars denote a histogram of data divided into 1 sec bins. Red curve is a Poisson curve with rate = median count rate of data. |
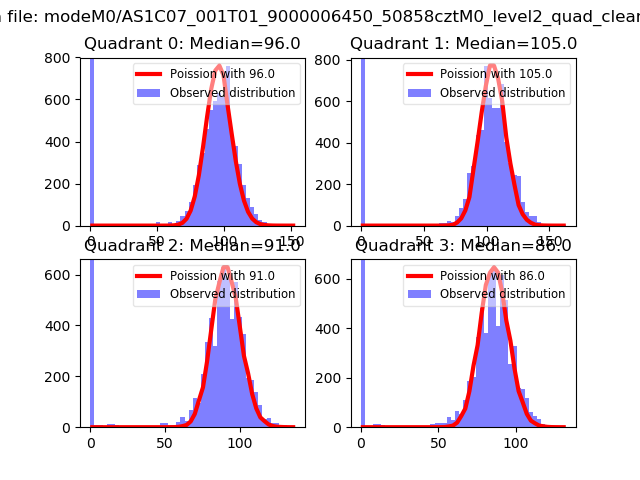 |
 |
| Quadrant-wise count rates Data is divided into 100 sec bins |
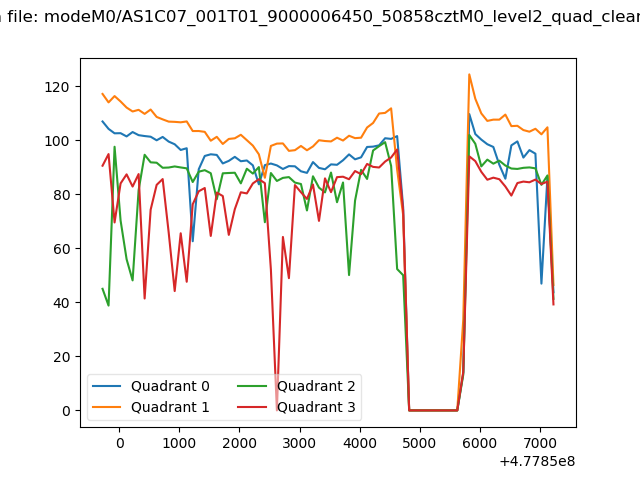 |
|
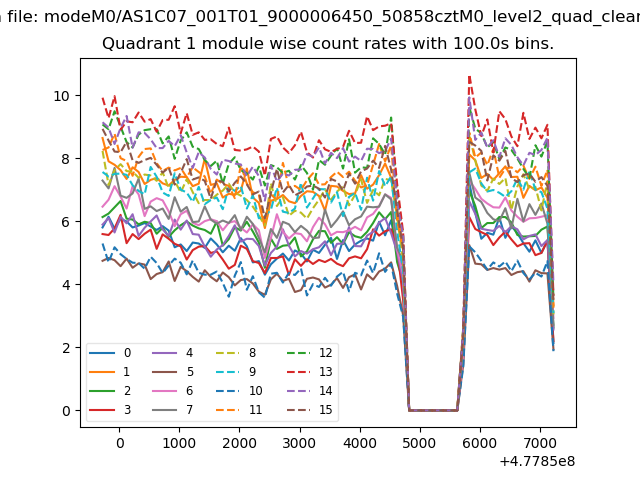
| Module-wise count rates for Quadrant A Data is divided into 100 sec bins |
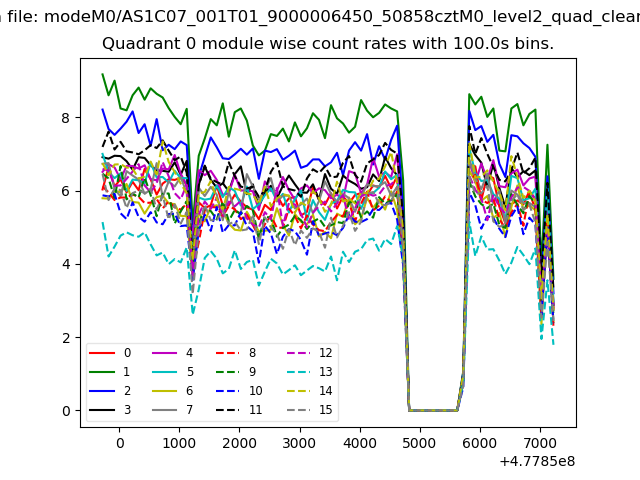 |
 |
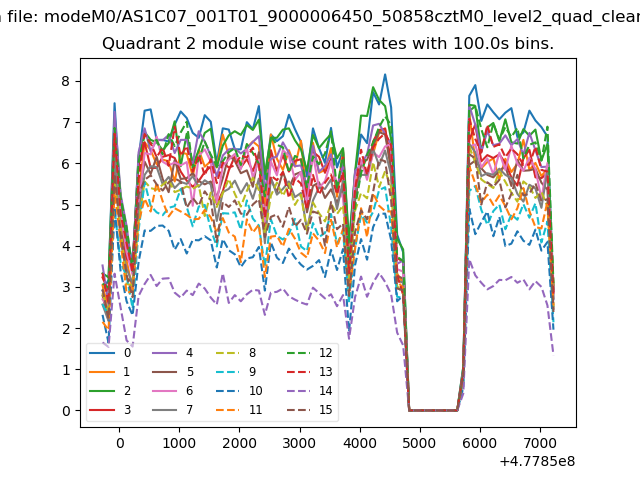
| Module-wise count rates for Quadrant B Data is divided into 100 sec bins |
 |
 |
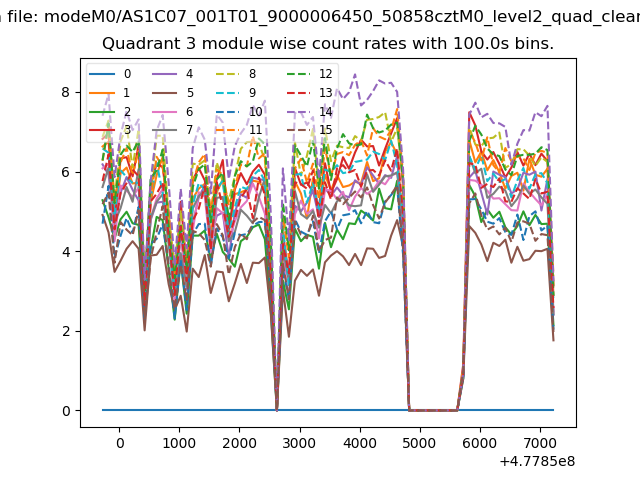
| Module-wise count rates for Quadrant C Data is divided into 100 sec bins |
 |
 |
| Module-wise count rates for Quadrant D Data is divided into 100 sec bins |
 |
 |
| Parameter | Plot |
|---|---|
| CZT HV Monitor | 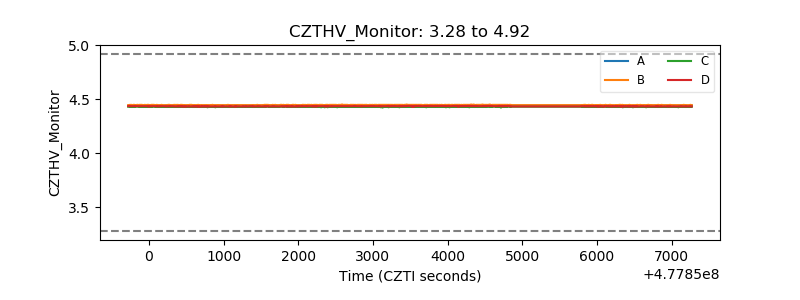 |
| D_VDD | 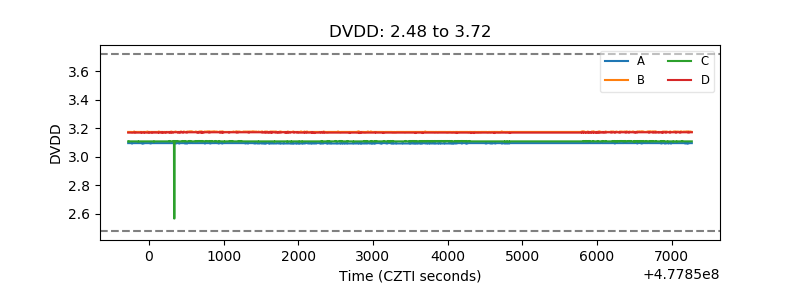 |
| Temperature 1 | 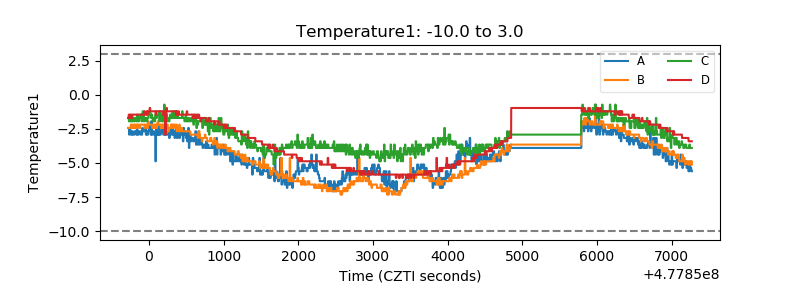 |
| Veto HV Monitor | 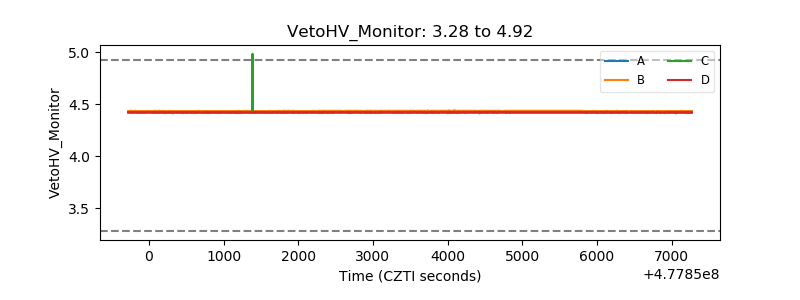 |
| Veto LLD | 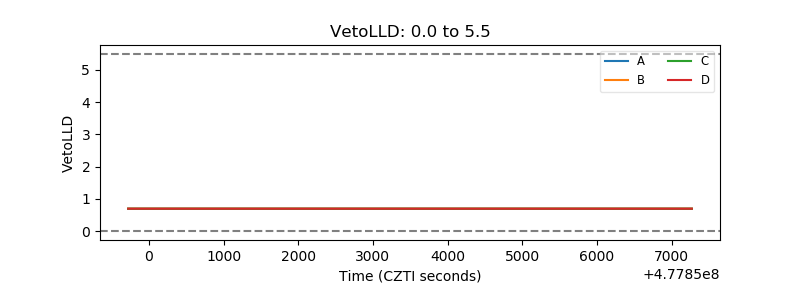 |
| Alpha Counter | 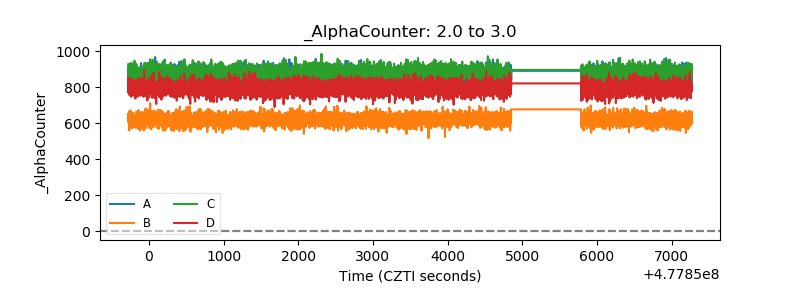 |
| _CPM_Rate | 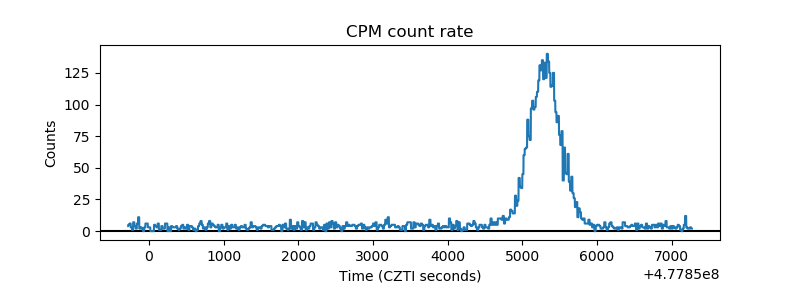 |
| CZT Counter | 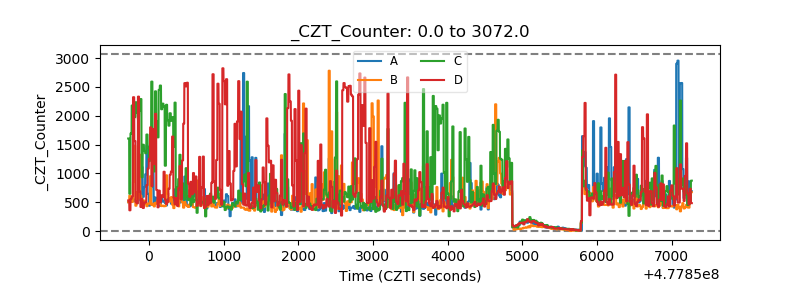 |
| +2.5 Volts monitor | 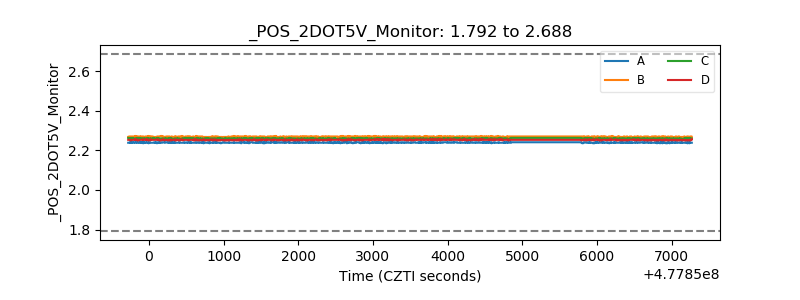 |
| +5 Volts monitor | 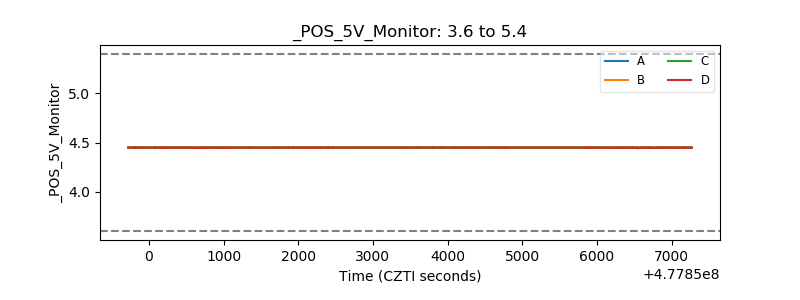 |
| _ROLL_ROT | 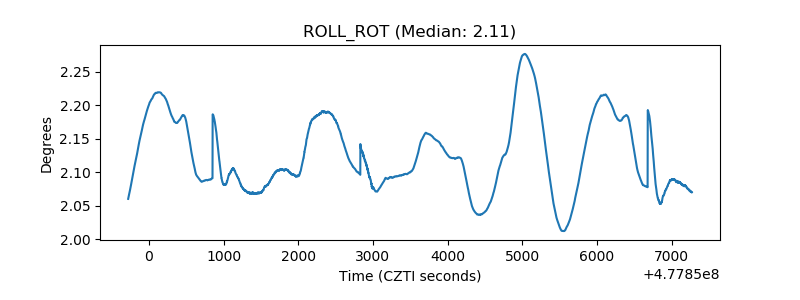 |
| _Roll_DEC | 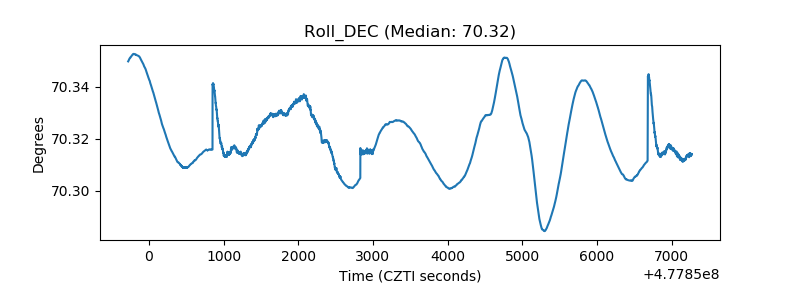 |
| _Roll_RA | 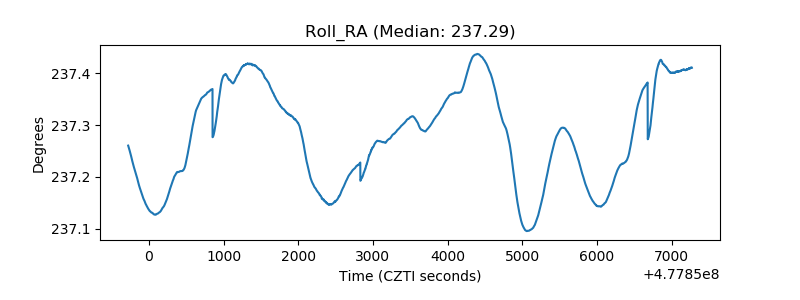 |
| Veto Counter | 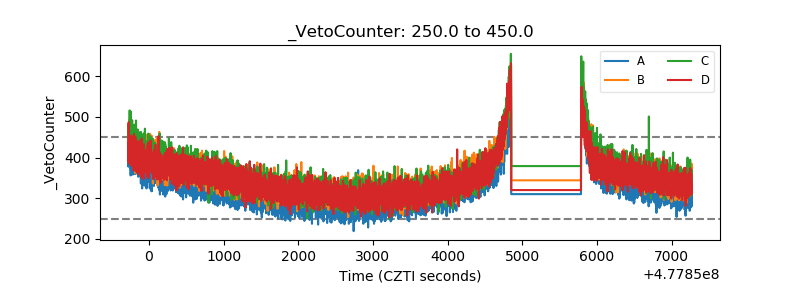 |