| Param | Original file | Final file |
|---|---|---|
| Filename | modeM0/AS1C07_001T01_9000006450_50859cztM0_level2.fits | modeM0/AS1C07_001T01_9000006450_50859cztM0_level2_quad_clean.evt |
| Size (bytes) | 584,974,080 | 97,398,720 |
| Size | 557.9 MB | 92.9 MB |
| Events in quadrant A | 4,538,425 | 652,178 |
| Events in quadrant B | 3,791,971 | 714,013 |
| Events in quadrant C | 7,637,675 | 519,593 |
| Events in quadrant D | 5,140,795 | 574,139 |
| Mode SS | |||
|---|---|---|---|
| Quadrant | BADHDUFLAG | Total packets | Discarded packets |
| A | 0 | 142 | 0 |
| B | 0 | 142 | 0 |
| C | 0 | 142 | 0 |
| D | 0 | 142 | 0 |
| Mode M0 | |||
|---|---|---|---|
| Quadrant | BADHDUFLAG | Total packets | Discarded packets |
| A | 0 | 18470 | 2 |
| B | 0 | 16200 | 2 |
| C | 0 | 27657 | 2 |
| D | 0 | 20090 | 2 |
| Mode M9 | |||
|---|---|---|---|
| Quadrant | BADHDUFLAG | Total packets | Discarded packets |
| A | 0 | 6 | 0 |
| B | 0 | 6 | 0 |
| C | 0 | 6 | 0 |
| D | 0 | 6 | 0 |
| Quadrant | Total seconds | Saturated seconds | Saturation percentage |
|---|---|---|---|
| A | 7024 | 232 | 3.302961% |
| B | 7024 | 187 | 2.662301% |
| C | 7025 | 1512 | 21.523132% |
| D | 7024 | 408 | 5.808656% |
Noise dominated data is calculated using 1-second bins in cleaned event files. If a bin has >2000 counts, and if more than 50% of those come from <1% of pixels, then it is considered to be noise-dominated and hence unusable.
| Quadrant | # 1 sec bins | Bins with >0 counts | Bins with >2000 counts | High rate bins dominated by noise | Noise dominated (total time) | Noise dominated (detector-on time) | Marked lightcurve |
|---|---|---|---|---|---|---|---|
| A | 7594 | 7025 | 181 | 181 | 2.38% | 2.58% | 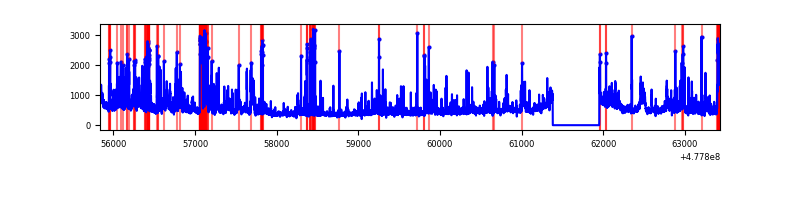 |
| B | 7594 | 7025 | 79 | 79 | 1.04% | 1.12% | 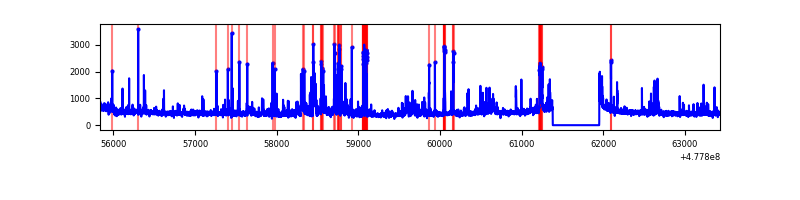 |
| C | 7595 | 7025 | 1168 | 1168 | 15.38% | 16.63% | 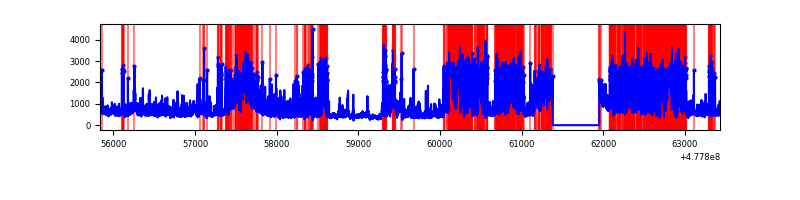 |
| D | 7594 | 7025 | 340 | 340 | 4.48% | 4.84% | 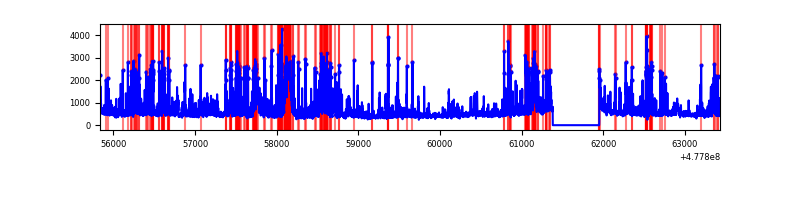 |
Top three noisy pixels from each quadrant. If the there are fewer than three noisy pixels in the level2.evt file, extra rows are filled as -1
| Pixel properties | Quadrant properties | ||||||
|---|---|---|---|---|---|---|---|
| Quadrant | DetID | PixID | Counts | Sigma | Mean | Median | Sigma |
| A | 10 | 253 | 304279 | 1669.65 | 738 | 721 | 181.8 |
| A | 8 | 38 | 253019 | 1387.71 | 738 | 721 | 181.8 |
| A | 9 | 96 | 180651 | 989.66 | 738 | 721 | 181.8 |
| B | 4 | 206 | 335432 | 2155.66 | 737 | 711 | 155.3 |
| B | 8 | 128 | 133882 | 857.65 | 737 | 711 | 155.3 |
| B | 4 | 81 | 69179 | 440.95 | 737 | 711 | 155.3 |
| C | 4 | 5 | 3014740 | 16443.35 | 657 | 652 | 183.3 |
| C | 1 | 29 | 474159 | 2583.22 | 657 | 652 | 183.3 |
| C | 15 | 231 | 270283 | 1470.97 | 657 | 652 | 183.3 |
| D | 6 | 191 | 449468 | 2233.03 | 712 | 687 | 201.0 |
| D | 10 | 181 | 428869 | 2130.54 | 712 | 687 | 201.0 |
| D | 2 | 216 | 248365 | 1232.39 | 712 | 687 | 201.0 |
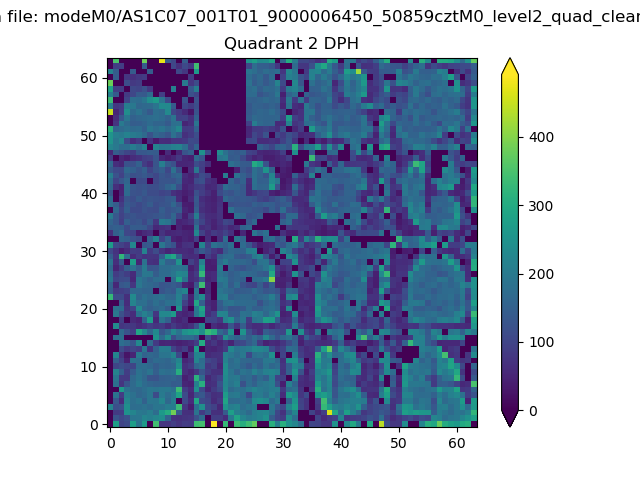
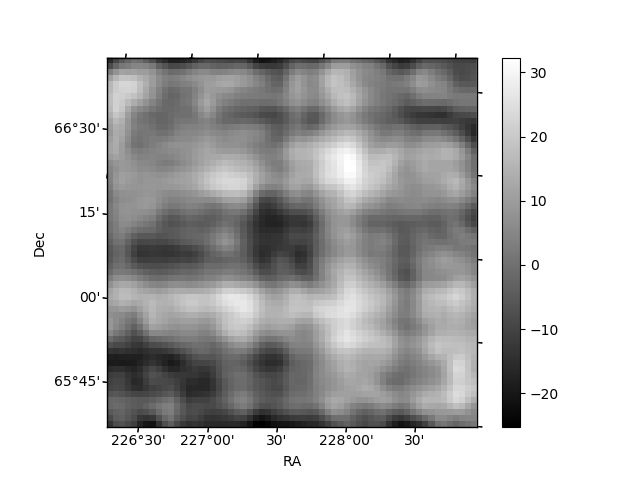
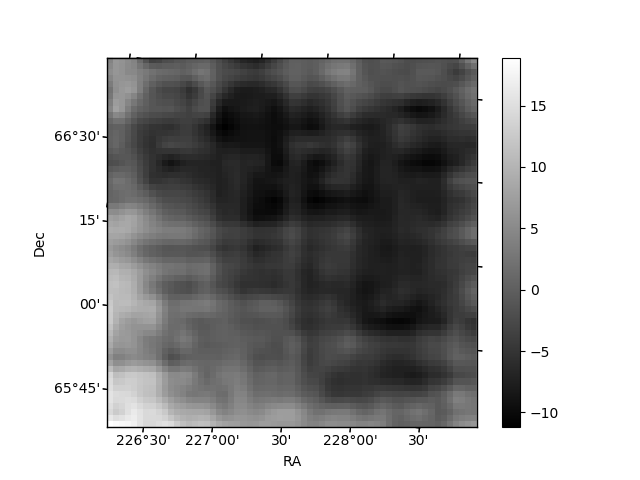
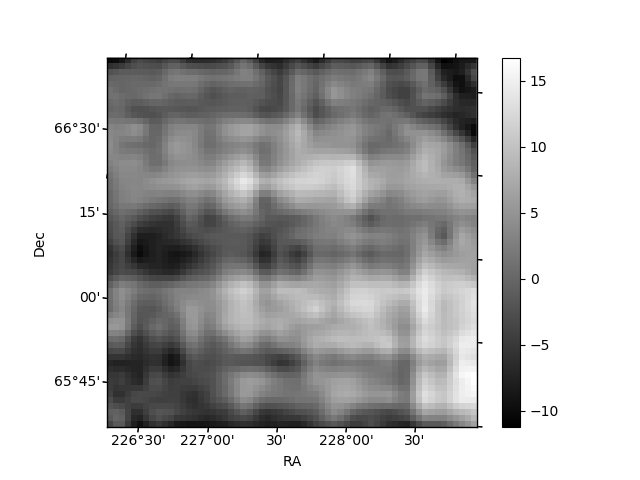
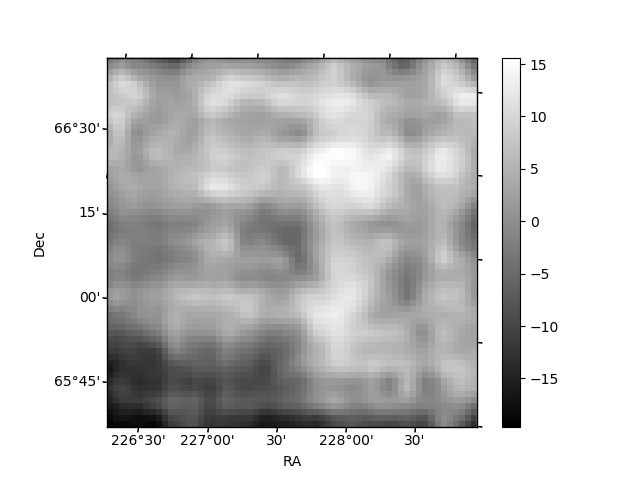
Histogram calculated using DETX and DETY for each event in the final _common_clean file
| Quadrant A | 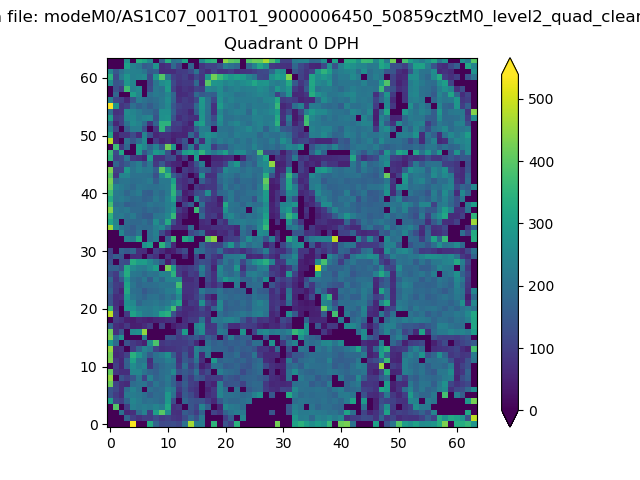 |
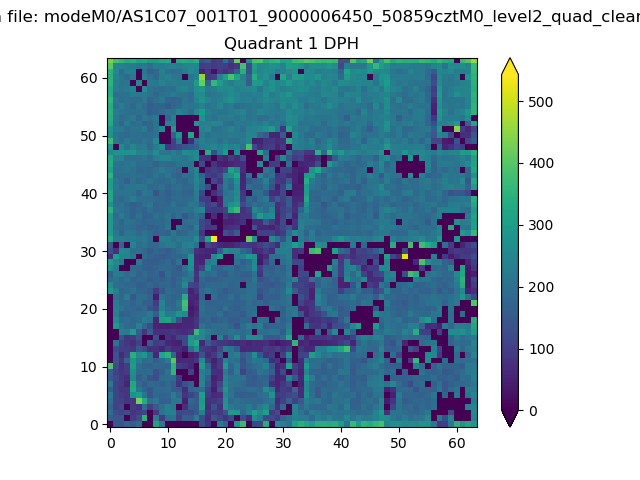 |
Quadrant B |
|---|---|---|---|
| Quadrant D | 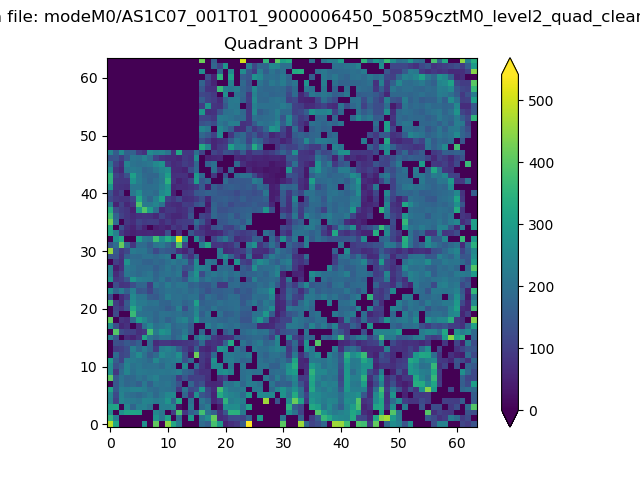 |
 |
Quadrant C |
| Plot type | Count rate plots | Images |
|---|---|---|
| Comparison with Poisson distribution Blue bars denote a histogram of data divided into 1 sec bins. Red curve is a Poisson curve with rate = median count rate of data. |
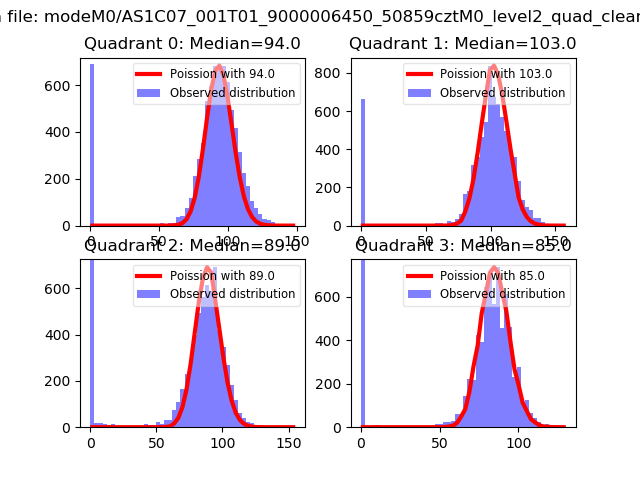 |
 |
| Quadrant-wise count rates Data is divided into 100 sec bins |
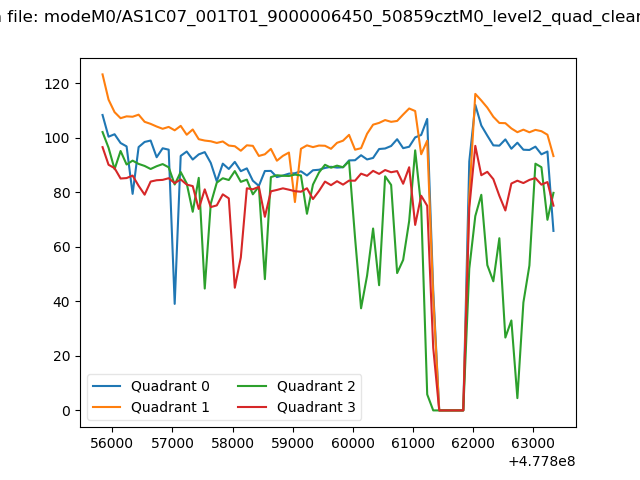 |
|
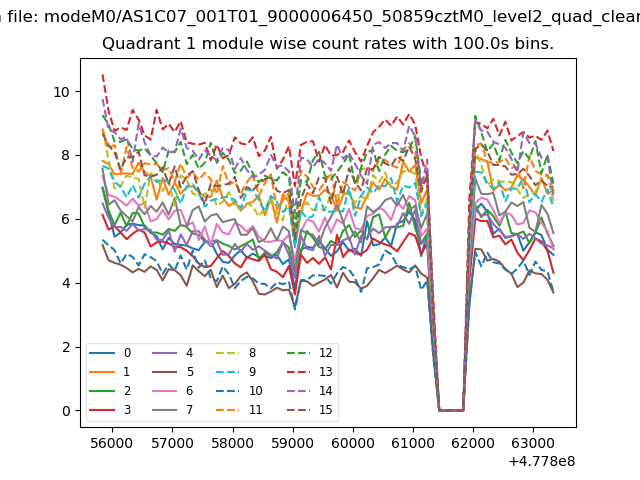
| Module-wise count rates for Quadrant A Data is divided into 100 sec bins |
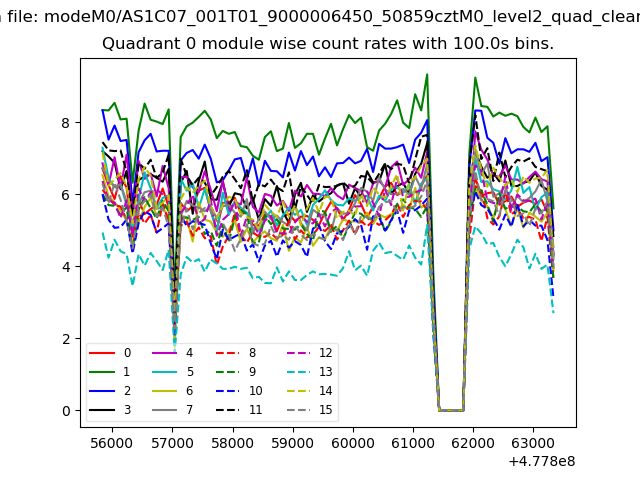 |
 |
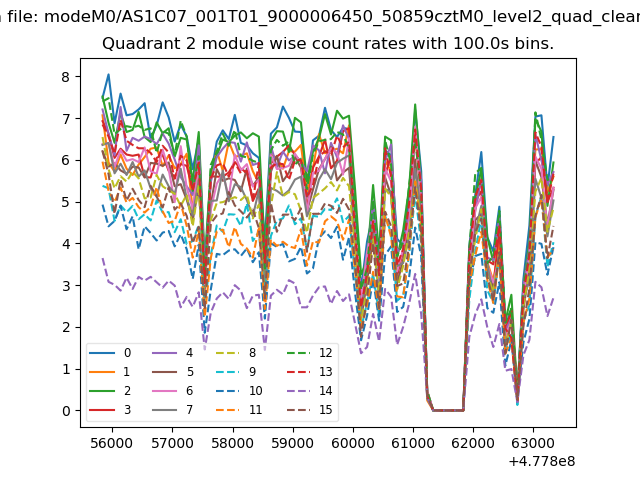
| Module-wise count rates for Quadrant B Data is divided into 100 sec bins |
 |
 |
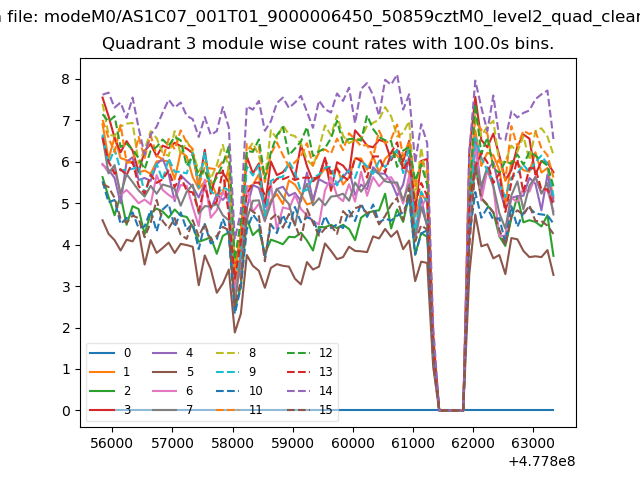
| Module-wise count rates for Quadrant C Data is divided into 100 sec bins |
 |
 |
| Module-wise count rates for Quadrant D Data is divided into 100 sec bins |
 |
 |
| Parameter | Plot |
|---|---|
| CZT HV Monitor | 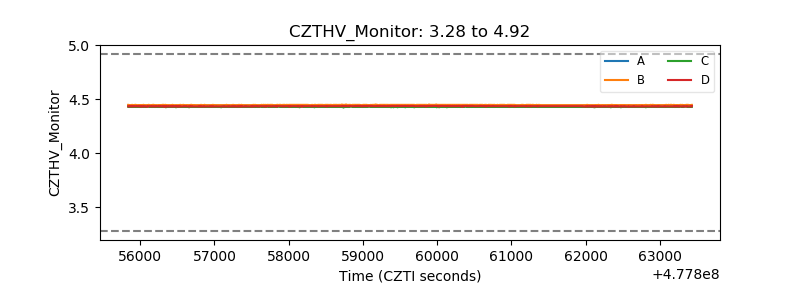 |
| D_VDD | 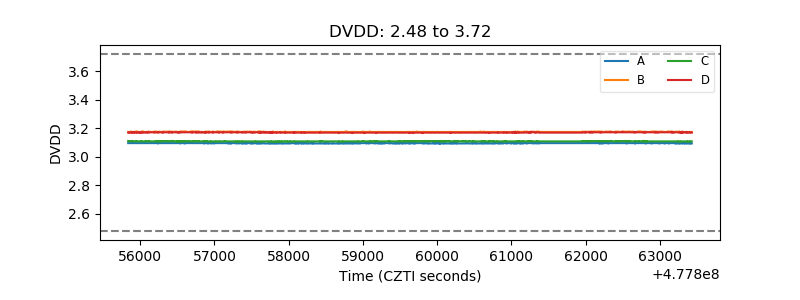 |
| Temperature 1 | 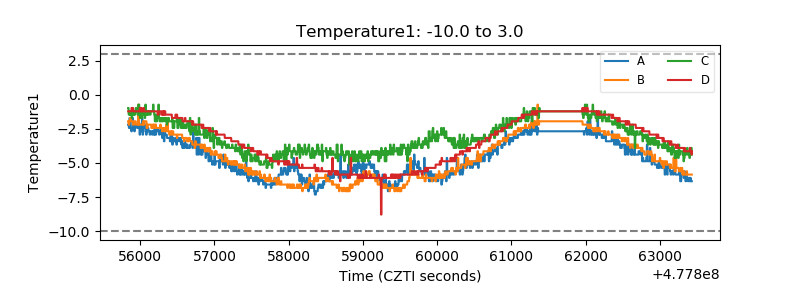 |
| Veto HV Monitor | 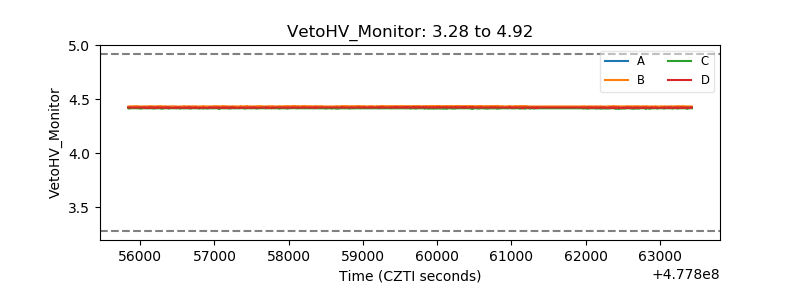 |
| Veto LLD | 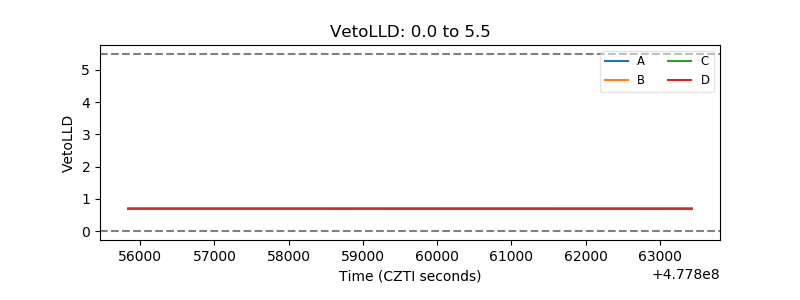 |
| Alpha Counter | 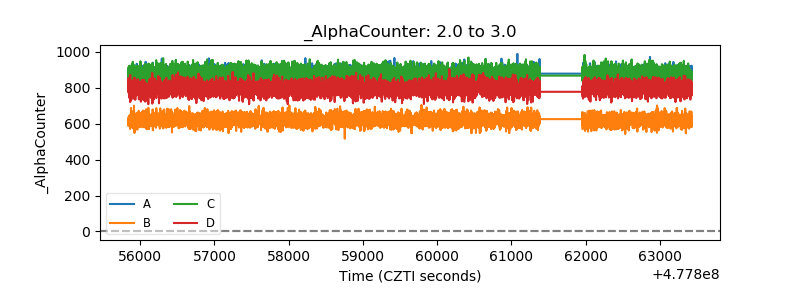 |
| _CPM_Rate | 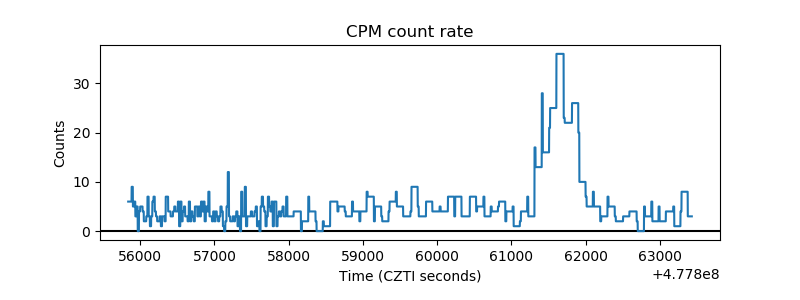 |
| CZT Counter | 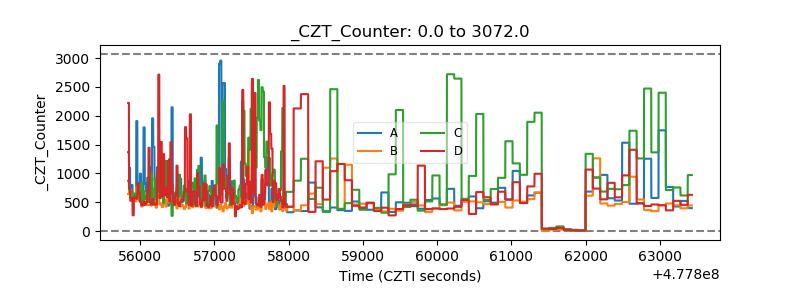 |
| +2.5 Volts monitor | 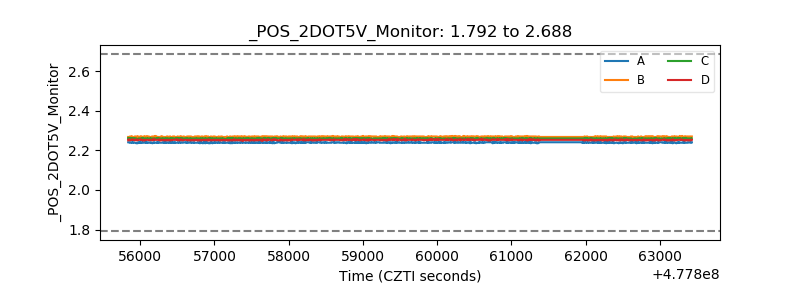 |
| +5 Volts monitor |  |
| _ROLL_ROT | 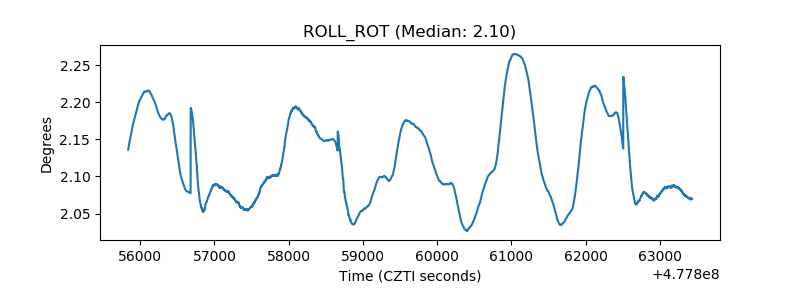 |
| _Roll_DEC | 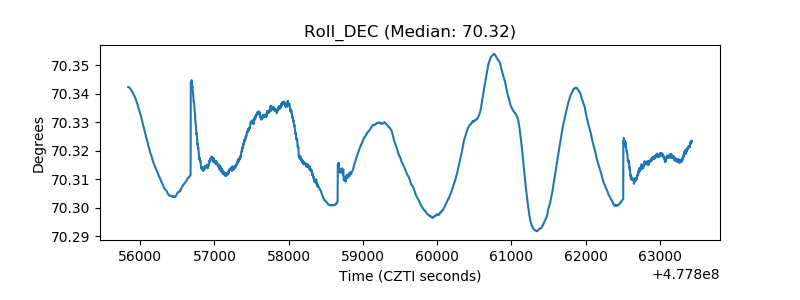 |
| _Roll_RA | 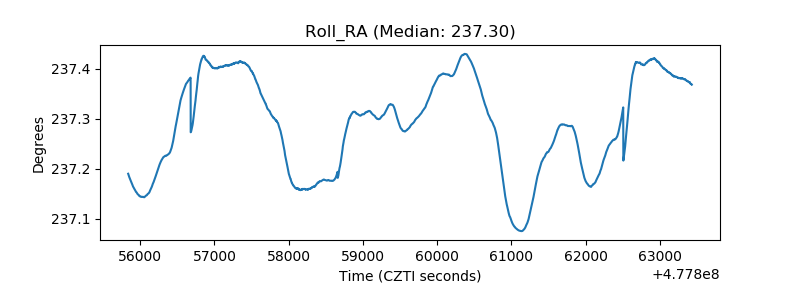 |
| Veto Counter | 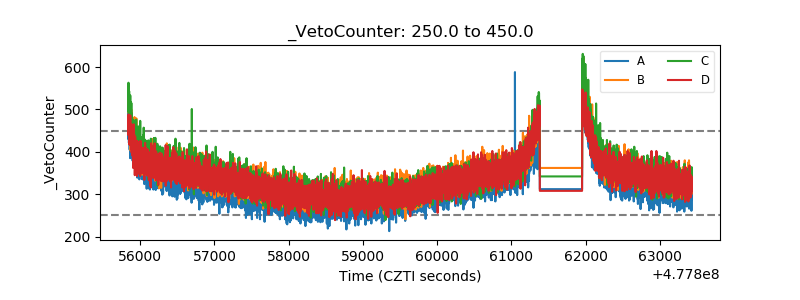 |