| Param | Original file | Final file |
|---|---|---|
| Filename | modeM0/AS1C07_001T01_9000006450_50860cztM0_level2.fits | modeM0/AS1C07_001T01_9000006450_50860cztM0_level2_quad_clean.evt |
| Size (bytes) | 572,186,880 | 110,471,040 |
| Size | 545.7 MB | 105.4 MB |
| Events in quadrant A | 4,445,754 | 734,315 |
| Events in quadrant B | 4,492,428 | 792,403 |
| Events in quadrant C | 6,386,230 | 628,639 |
| Events in quadrant D | 5,249,871 | 646,436 |
| Mode SS | |||
|---|---|---|---|
| Quadrant | BADHDUFLAG | Total packets | Discarded packets |
| A | 0 | 156 | 0 |
| B | 0 | 156 | 0 |
| C | 0 | 156 | 0 |
| D | 0 | 156 | 0 |
| Mode M0 | |||
|---|---|---|---|
| Quadrant | BADHDUFLAG | Total packets | Discarded packets |
| A | 0 | 18649 | 1 |
| B | 0 | 18885 | 1 |
| C | 0 | 24525 | 1 |
| D | 0 | 20931 | 1 |
| Mode M9 | |||
|---|---|---|---|
| Quadrant | BADHDUFLAG | Total packets | Discarded packets |
| A | 0 | 1 | 0 |
| B | 0 | 2 | 0 |
| C | 0 | 2 | 0 |
| D | 0 | 2 | 0 |
| Quadrant | Total seconds | Saturated seconds | Saturation percentage |
|---|---|---|---|
| A | 7811 | 121 | 1.549097% |
| B | 7811 | 208 | 2.662911% |
| C | 7811 | 996 | 12.751248% |
| D | 7811 | 285 | 3.648701% |
Noise dominated data is calculated using 1-second bins in cleaned event files. If a bin has >2000 counts, and if more than 50% of those come from <1% of pixels, then it is considered to be noise-dominated and hence unusable.
| Quadrant | # 1 sec bins | Bins with >0 counts | Bins with >2000 counts | High rate bins dominated by noise | Noise dominated (total time) | Noise dominated (detector-on time) | Marked lightcurve |
|---|---|---|---|---|---|---|---|
| A | 7811 | 7811 | 79 | 79 | 1.01% | 1.01% | 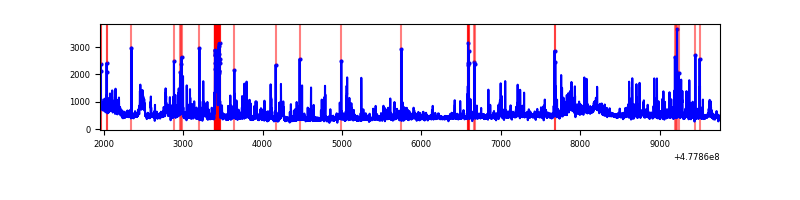 |
| B | 7811 | 7811 | 94 | 94 | 1.20% | 1.20% | 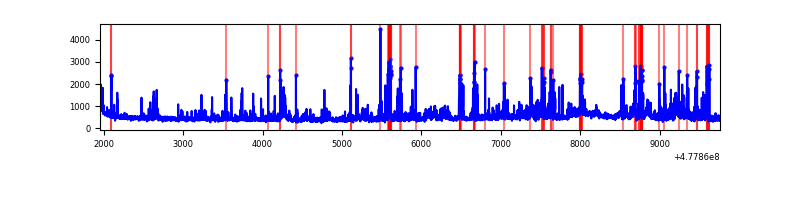 |
| C | 7811 | 7811 | 761 | 761 | 9.74% | 9.74% | 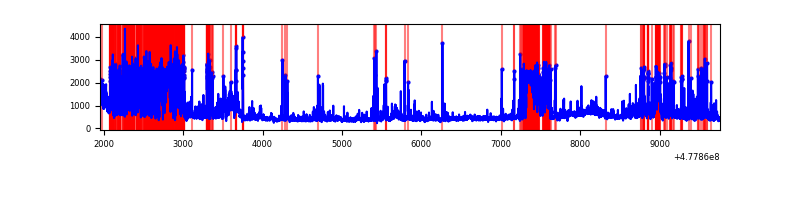 |
| D | 7811 | 7811 | 224 | 224 | 2.87% | 2.87% | 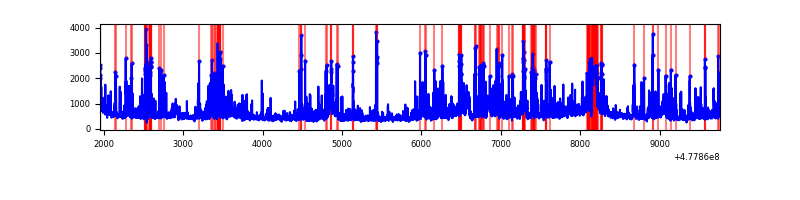 |
Top three noisy pixels from each quadrant. If the there are fewer than three noisy pixels in the level2.evt file, extra rows are filled as -1
| Pixel properties | Quadrant properties | ||||||
|---|---|---|---|---|---|---|---|
| Quadrant | DetID | PixID | Counts | Sigma | Mean | Median | Sigma |
| A | 4 | 191 | 228764 | 1093.59 | 836 | 816 | 208.4 |
| A | 8 | 38 | 139904 | 667.28 | 836 | 816 | 208.4 |
| A | 4 | 3 | 105492 | 502.19 | 836 | 816 | 208.4 |
| B | 4 | 206 | 523373 | 2968.23 | 833 | 804 | 176.1 |
| B | 10 | 247 | 119849 | 676.18 | 833 | 804 | 176.1 |
| B | 5 | 172 | 79751 | 448.42 | 833 | 804 | 176.1 |
| C | 4 | 5 | 1435641 | 6843.84 | 773 | 766 | 209.7 |
| C | 15 | 229 | 785820 | 3744.43 | 773 | 766 | 209.7 |
| C | 13 | 3 | 211212 | 1003.75 | 773 | 766 | 209.7 |
| D | 6 | 191 | 354569 | 1572.72 | 803 | 774 | 225.0 |
| D | 2 | 216 | 209192 | 926.48 | 803 | 774 | 225.0 |
| D | 7 | 96 | 173458 | 767.63 | 803 | 774 | 225.0 |
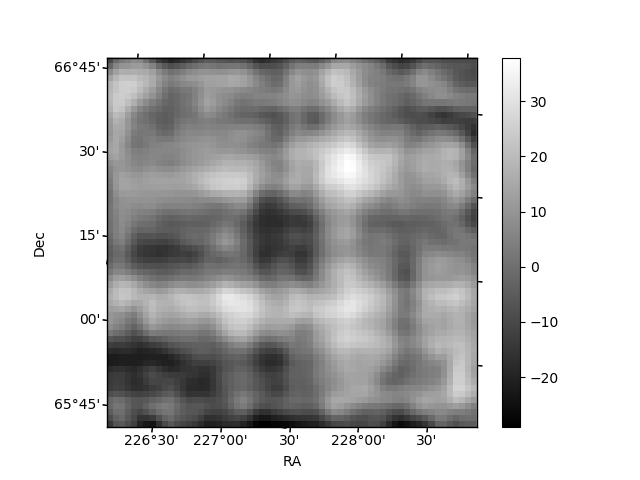
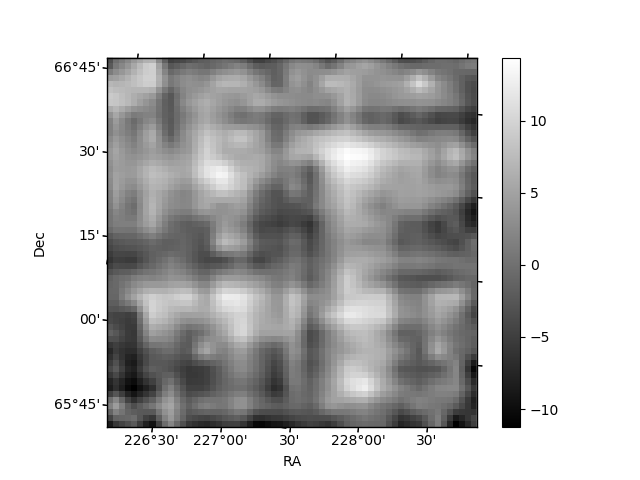
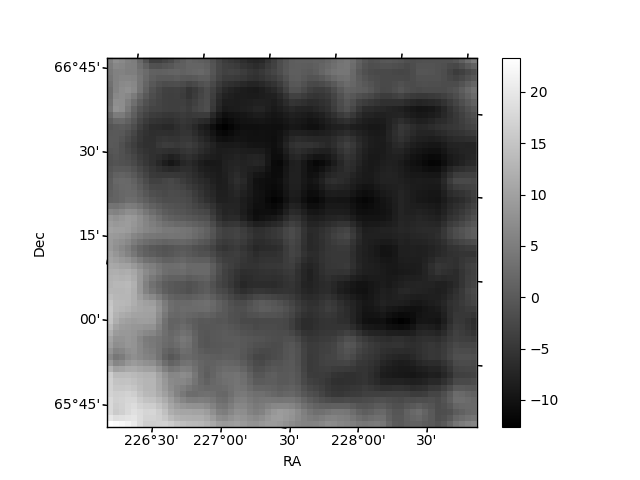
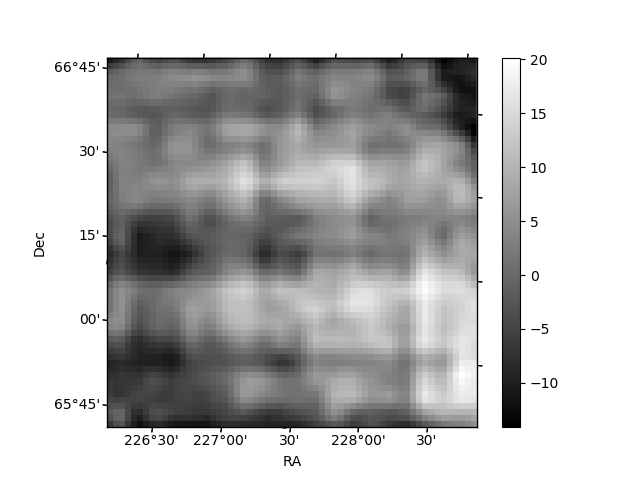
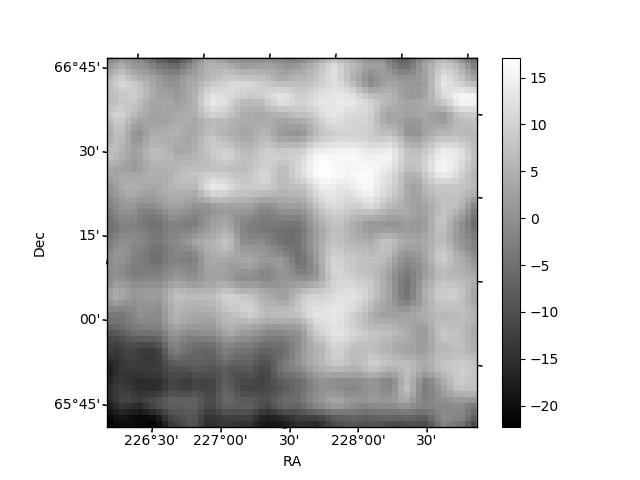
Histogram calculated using DETX and DETY for each event in the final _common_clean file
| Quadrant A | 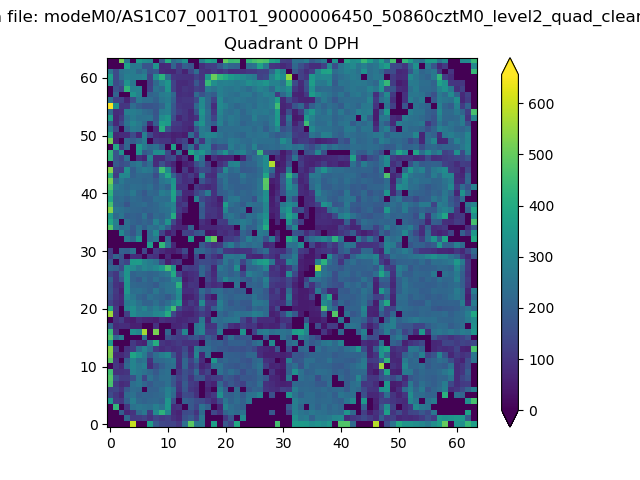 |
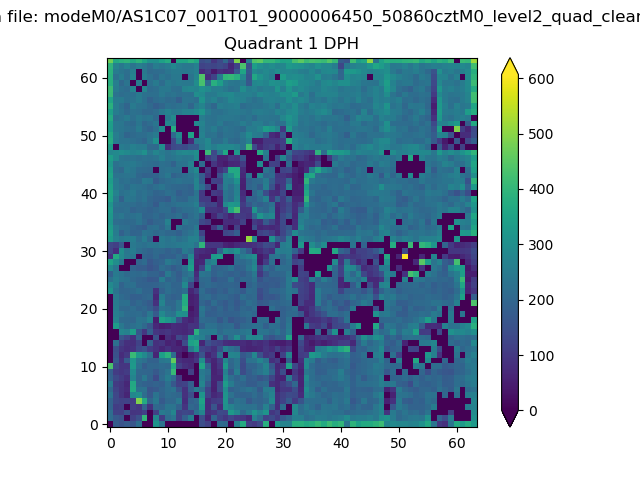 |
Quadrant B |
|---|---|---|---|
| Quadrant D | 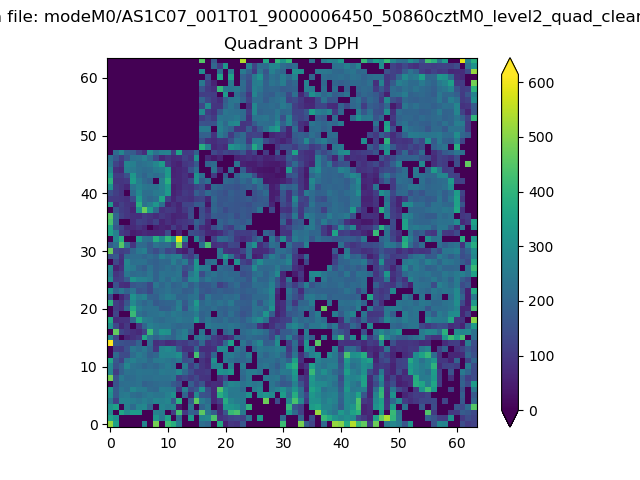 |
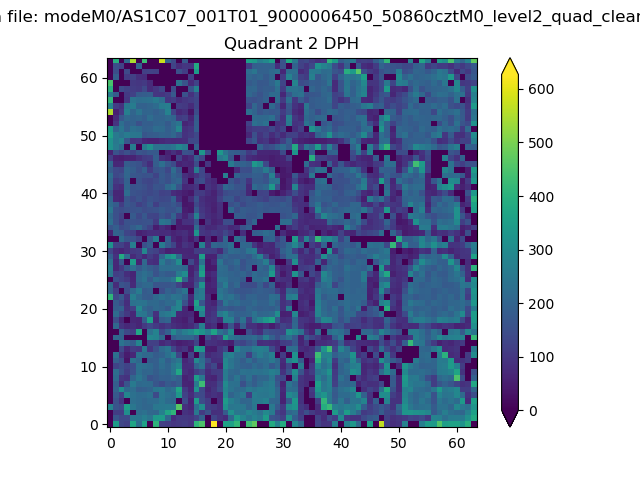 |
Quadrant C |
| Plot type | Count rate plots | Images |
|---|---|---|
| Comparison with Poisson distribution Blue bars denote a histogram of data divided into 1 sec bins. Red curve is a Poisson curve with rate = median count rate of data. |
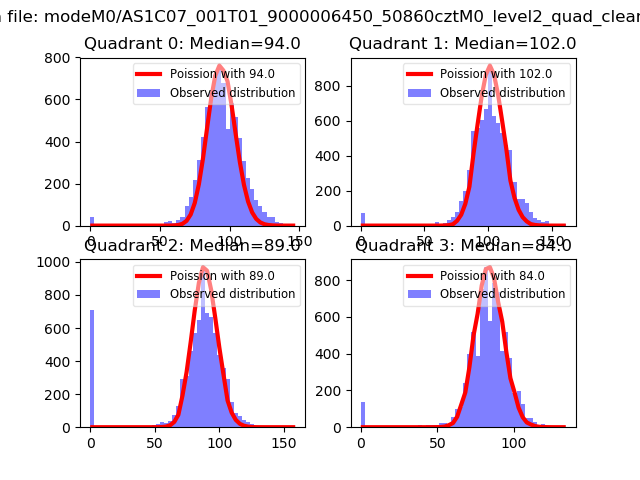 |
 |
| Quadrant-wise count rates Data is divided into 100 sec bins |
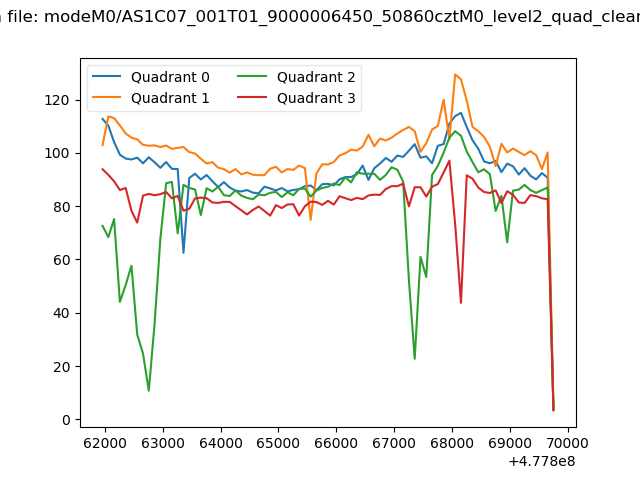 |
|
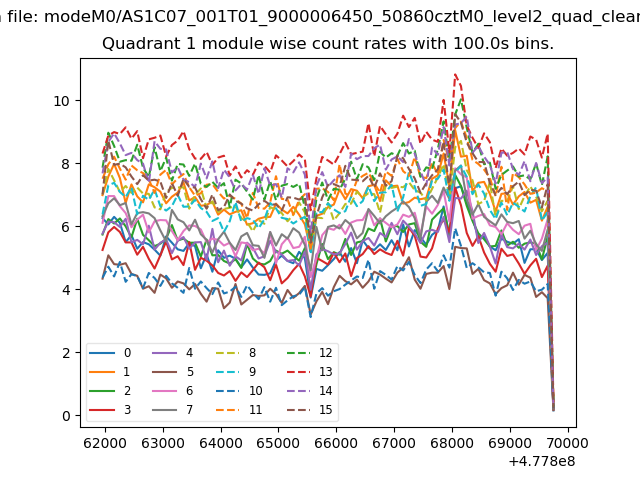
| Module-wise count rates for Quadrant A Data is divided into 100 sec bins |
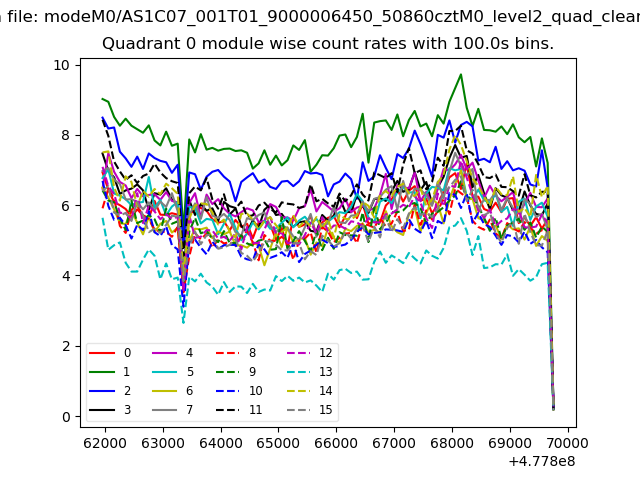 |
 |
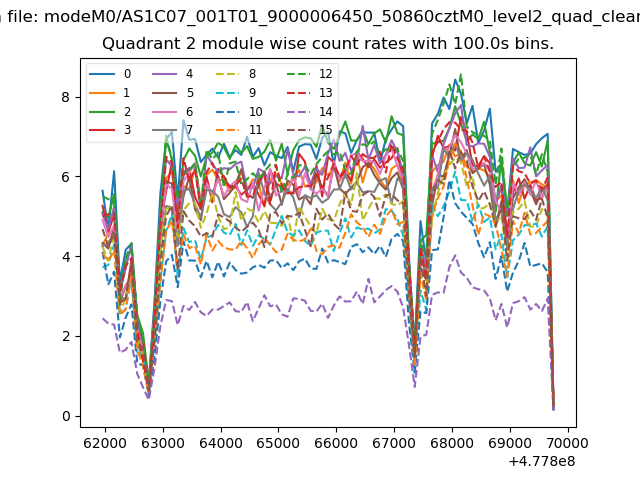
| Module-wise count rates for Quadrant B Data is divided into 100 sec bins |
 |
 |
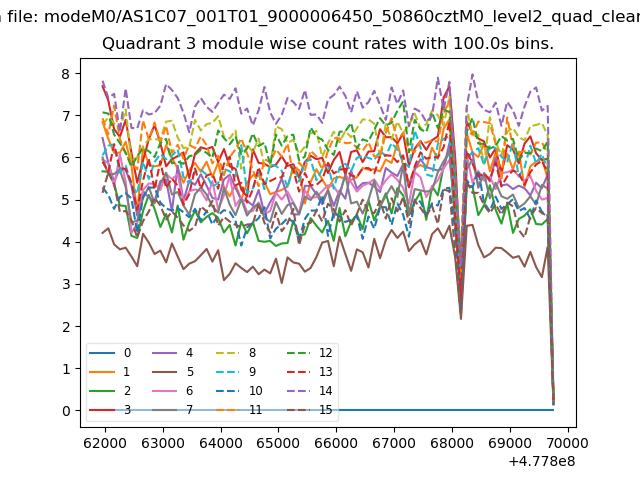
| Module-wise count rates for Quadrant C Data is divided into 100 sec bins |
 |
 |
| Module-wise count rates for Quadrant D Data is divided into 100 sec bins |
 |
 |
| Parameter | Plot |
|---|---|
| CZT HV Monitor | 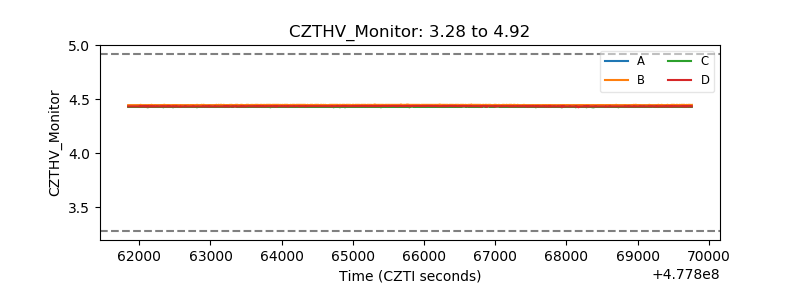 |
| D_VDD | 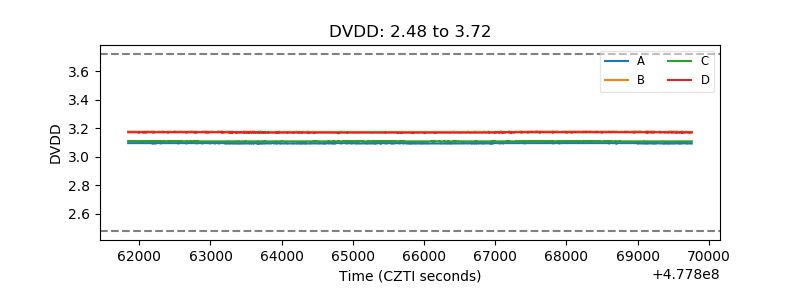 |
| Temperature 1 | 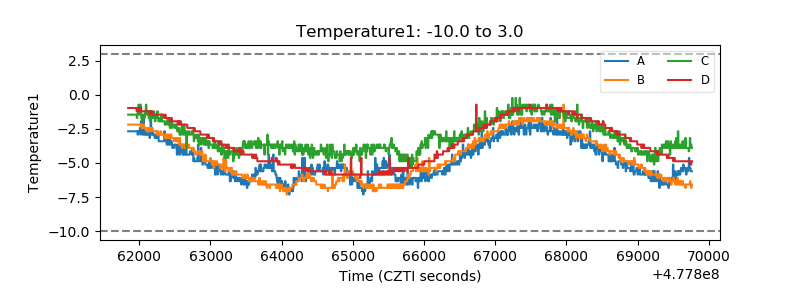 |
| Veto HV Monitor |  |
| Veto LLD | 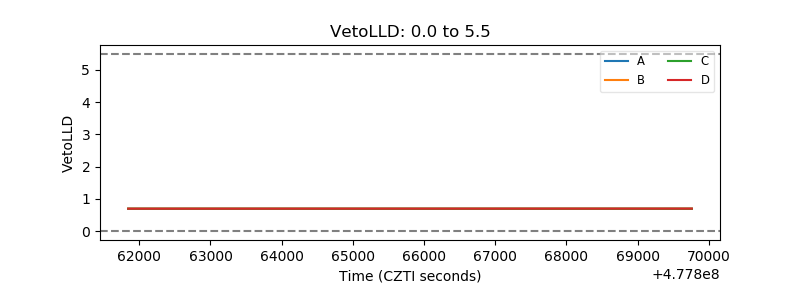 |
| Alpha Counter | 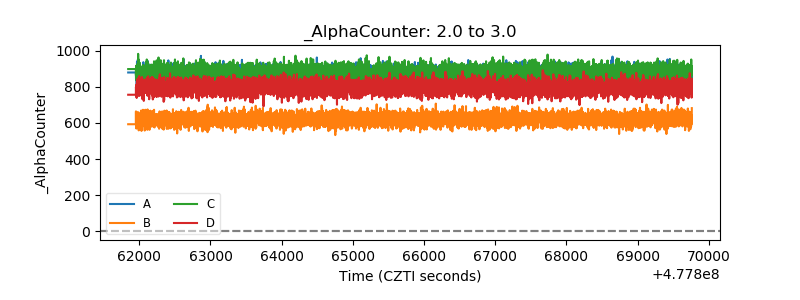 |
| _CPM_Rate | 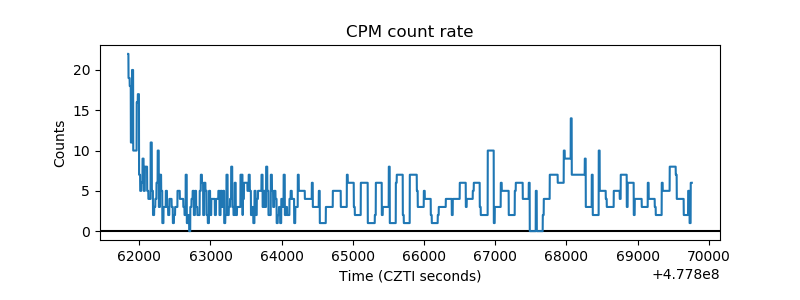 |
| CZT Counter | 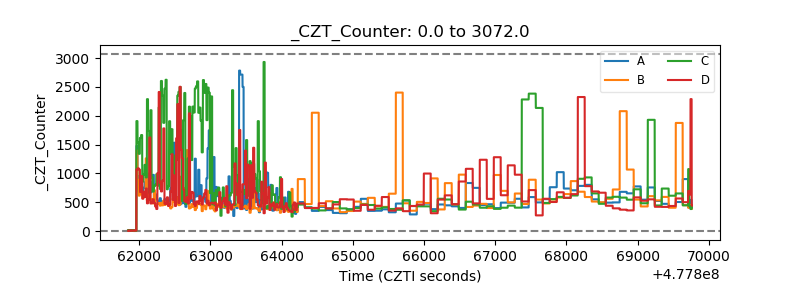 |
| +2.5 Volts monitor | 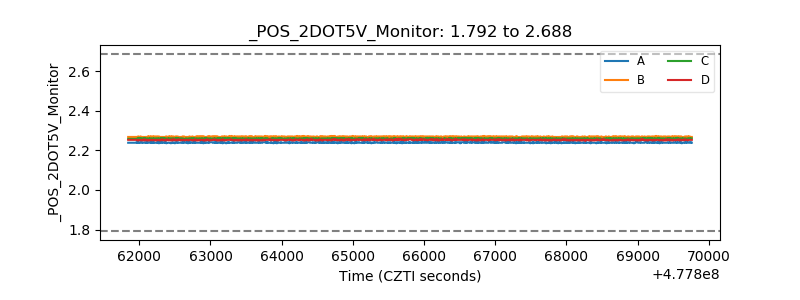 |
| +5 Volts monitor | 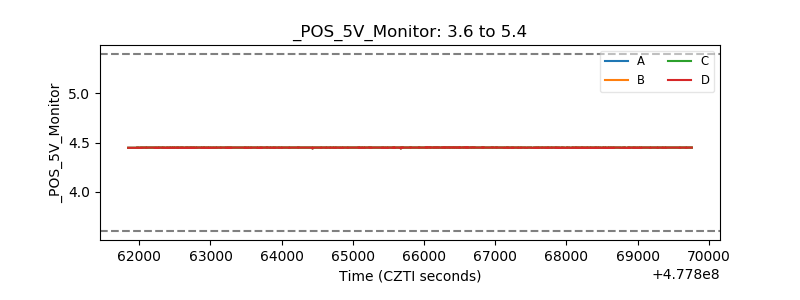 |
| _ROLL_ROT | 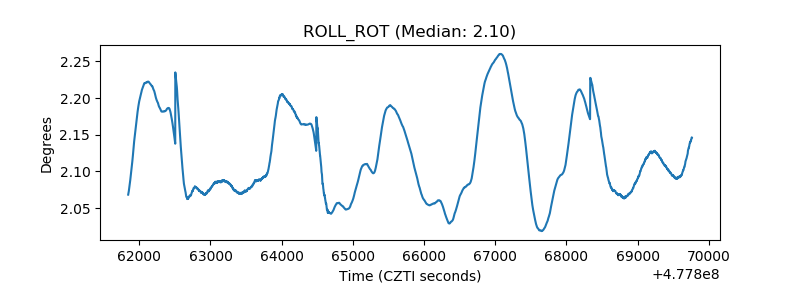 |
| _Roll_DEC | 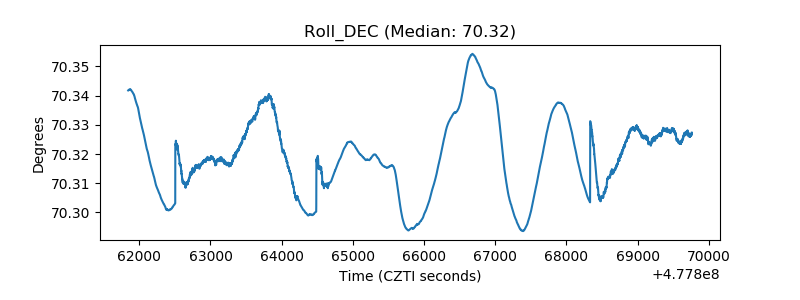 |
| _Roll_RA | 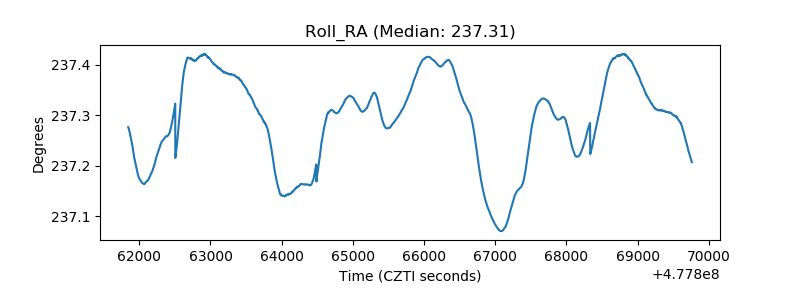 |
| Veto Counter | 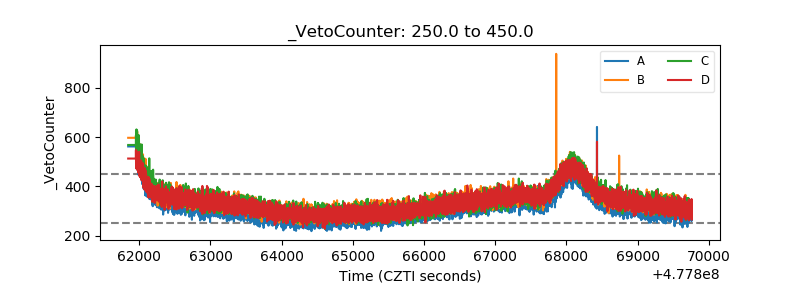 |