| Param | Original file | Final file |
|---|---|---|
| Filename | modeM0/AS1C07_001T01_9000006450_50861cztM0_level2.fits | modeM0/AS1C07_001T01_9000006450_50861cztM0_level2_quad_clean.evt |
| Size (bytes) | 747,109,440 | 112,481,280 |
| Size | 712.5 MB | 107.3 MB |
| Events in quadrant A | 5,392,699 | 760,219 |
| Events in quadrant B | 5,549,973 | 828,604 |
| Events in quadrant C | 8,976,165 | 594,139 |
| Events in quadrant D | 7,094,819 | 646,660 |
| Mode SS | |||
|---|---|---|---|
| Quadrant | BADHDUFLAG | Total packets | Discarded packets |
| A | 0 | 166 | 0 |
| B | 0 | 166 | 0 |
| C | 0 | 166 | 0 |
| D | 0 | 166 | 0 |
| Mode M0 | |||
|---|---|---|---|
| Quadrant | BADHDUFLAG | Total packets | Discarded packets |
| A | 0 | 21772 | 0 |
| B | 0 | 22486 | 0 |
| C | 0 | 32486 | 0 |
| D | 0 | 26792 | 0 |
| Quadrant | Total seconds | Saturated seconds | Saturation percentage |
|---|---|---|---|
| A | 8288 | 258 | 3.112934% |
| B | 8288 | 353 | 4.259170% |
| C | 8289 | 1956 | 23.597539% |
| D | 8289 | 816 | 9.844372% |
Noise dominated data is calculated using 1-second bins in cleaned event files. If a bin has >2000 counts, and if more than 50% of those come from <1% of pixels, then it is considered to be noise-dominated and hence unusable.
| Quadrant | # 1 sec bins | Bins with >0 counts | Bins with >2000 counts | High rate bins dominated by noise | Noise dominated (total time) | Noise dominated (detector-on time) | Marked lightcurve |
|---|---|---|---|---|---|---|---|
| A | 8288 | 8288 | 187 | 187 | 2.26% | 2.26% | 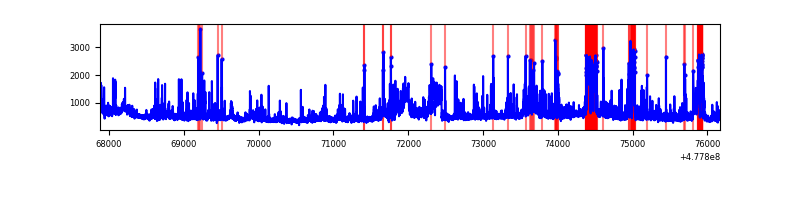 |
| B | 8287 | 8287 | 242 | 242 | 2.92% | 2.92% | 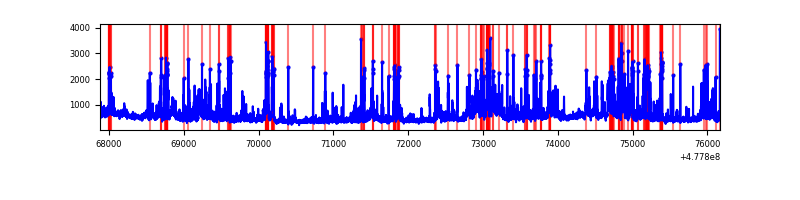 |
| C | 8289 | 8289 | 1316 | 1316 | 15.88% | 15.88% | 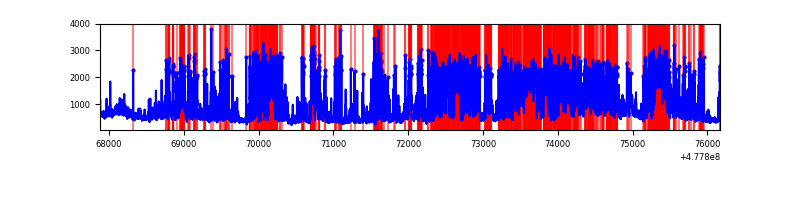 |
| D | 8289 | 8289 | 755 | 755 | 9.11% | 9.11% | 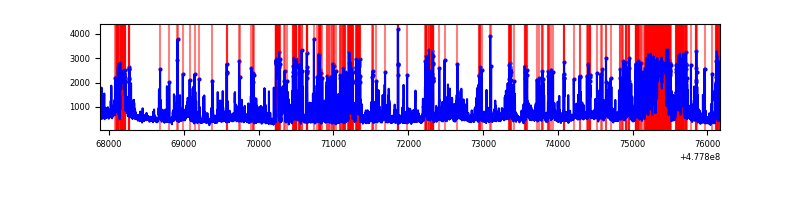 |
Top three noisy pixels from each quadrant. If the there are fewer than three noisy pixels in the level2.evt file, extra rows are filled as -1
| Pixel properties | Quadrant properties | ||||||
|---|---|---|---|---|---|---|---|
| Quadrant | DetID | PixID | Counts | Sigma | Mean | Median | Sigma |
| A | 12 | 80 | 320454 | 1460.74 | 877 | 856 | 218.8 |
| A | 4 | 249 | 259931 | 1184.11 | 877 | 856 | 218.8 |
| A | 3 | 130 | 234011 | 1065.65 | 877 | 856 | 218.8 |
| B | 4 | 206 | 1088941 | 5797.33 | 880 | 849 | 187.7 |
| B | 10 | 247 | 314577 | 1671.53 | 880 | 849 | 187.7 |
| B | 5 | 172 | 123126 | 651.49 | 880 | 849 | 187.7 |
| C | 4 | 210 | 2194099 | 10102.52 | 791 | 786 | 217.1 |
| C | 15 | 229 | 1999953 | 9208.27 | 791 | 786 | 217.1 |
| C | 13 | 3 | 298714 | 1372.27 | 791 | 786 | 217.1 |
| D | 15 | 185 | 898244 | 3891.24 | 829 | 799 | 230.6 |
| D | 2 | 249 | 394803 | 1708.36 | 829 | 799 | 230.6 |
| D | 2 | 216 | 323623 | 1399.73 | 829 | 799 | 230.6 |
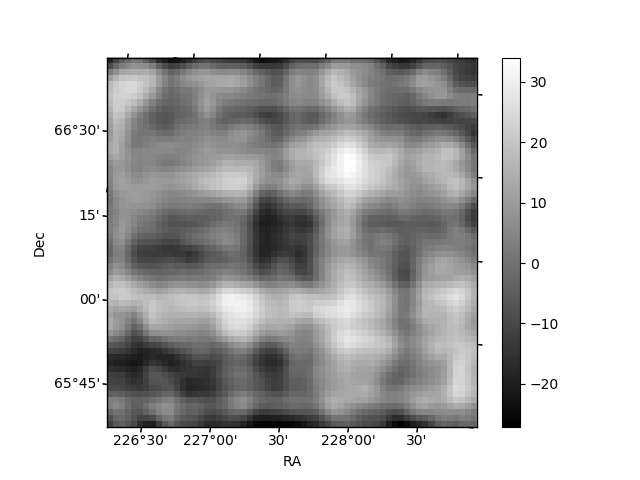
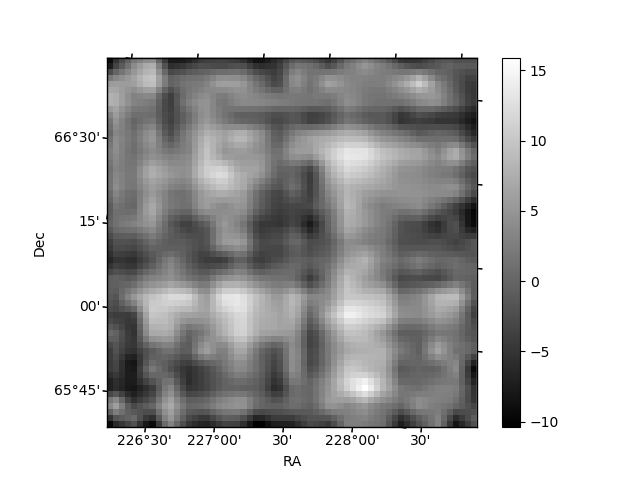
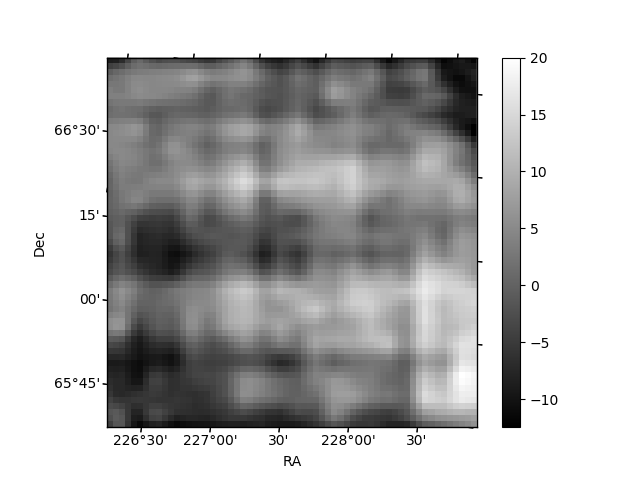
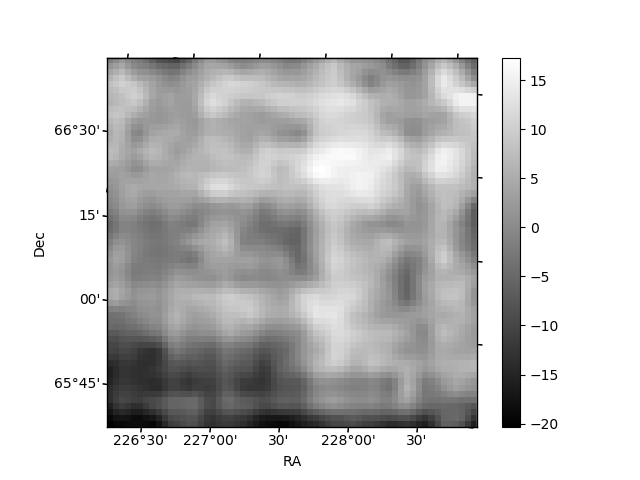
Histogram calculated using DETX and DETY for each event in the final _common_clean file
| Quadrant A | 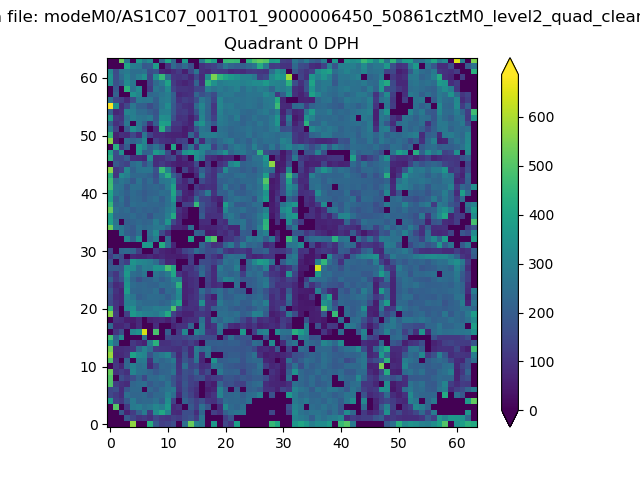 |
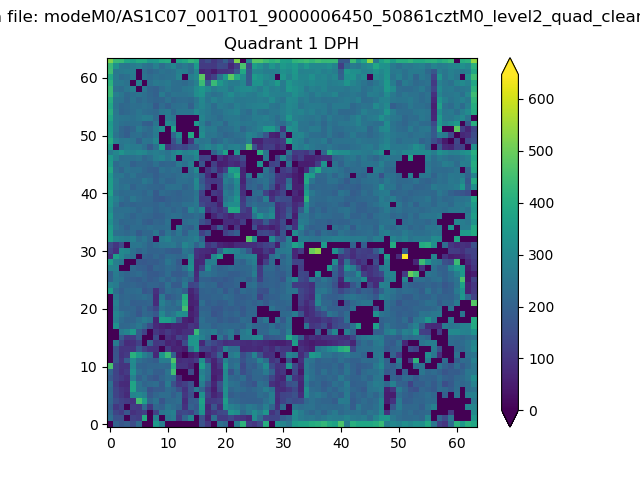 |
Quadrant B |
|---|---|---|---|
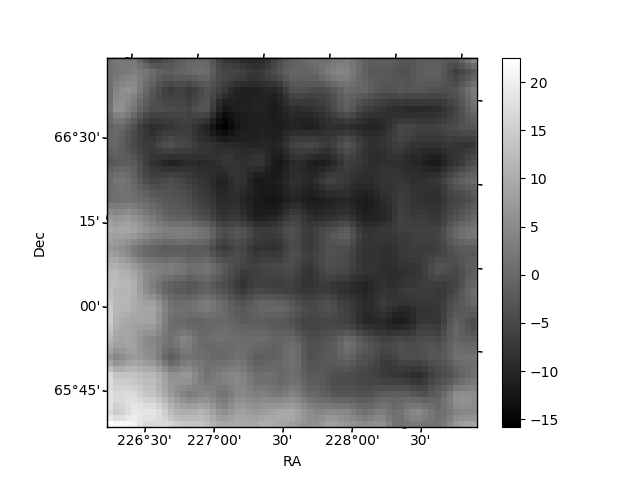
| Quadrant D | 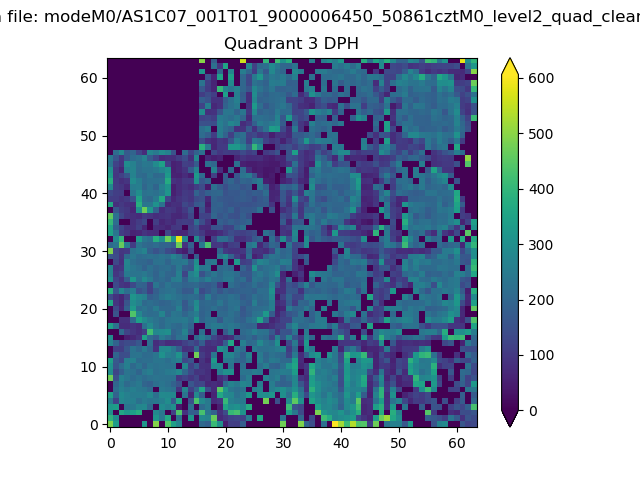 |
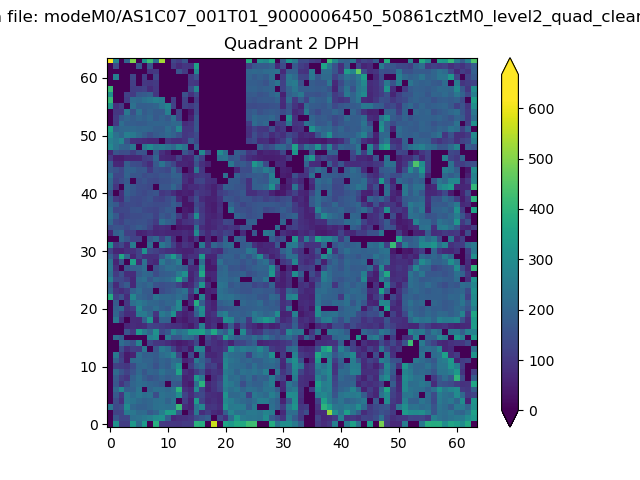 |
Quadrant C |
| Plot type | Count rate plots | Images |
|---|---|---|
| Comparison with Poisson distribution Blue bars denote a histogram of data divided into 1 sec bins. Red curve is a Poisson curve with rate = median count rate of data. |
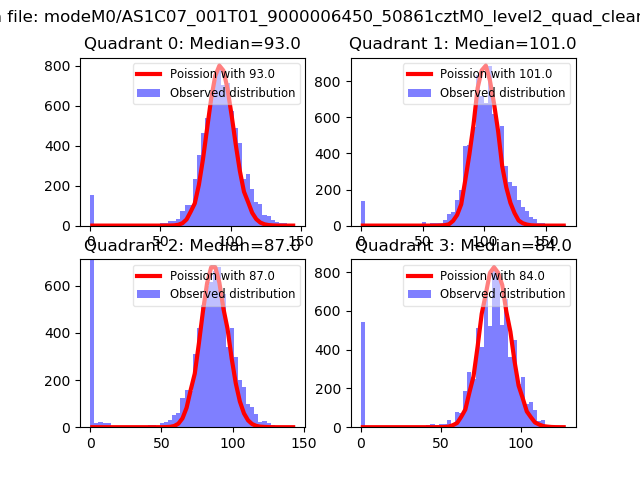 |
 |
| Quadrant-wise count rates Data is divided into 100 sec bins |
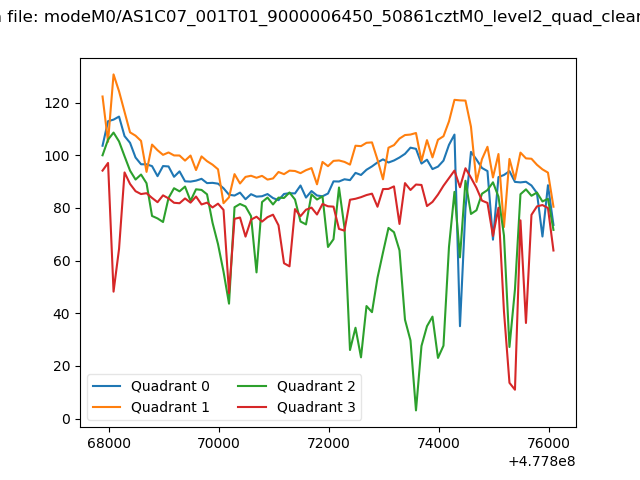 |
|
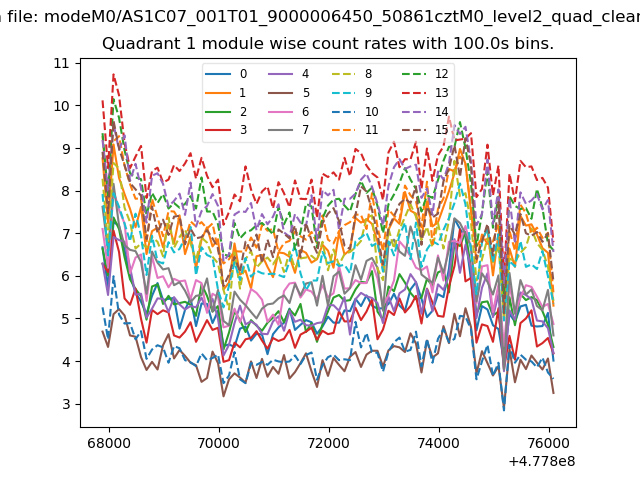
| Module-wise count rates for Quadrant A Data is divided into 100 sec bins |
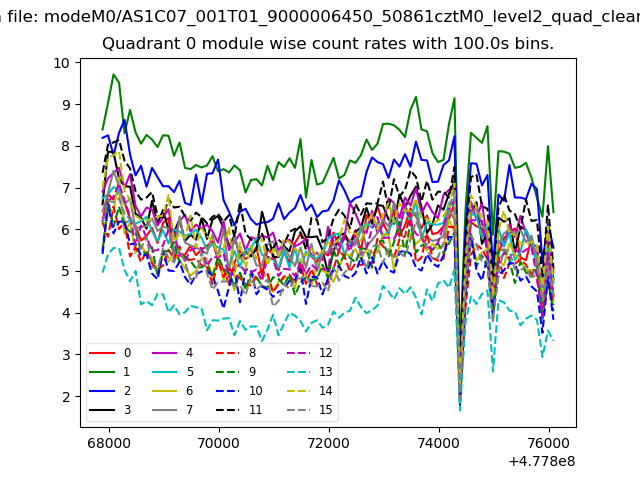 |
 |
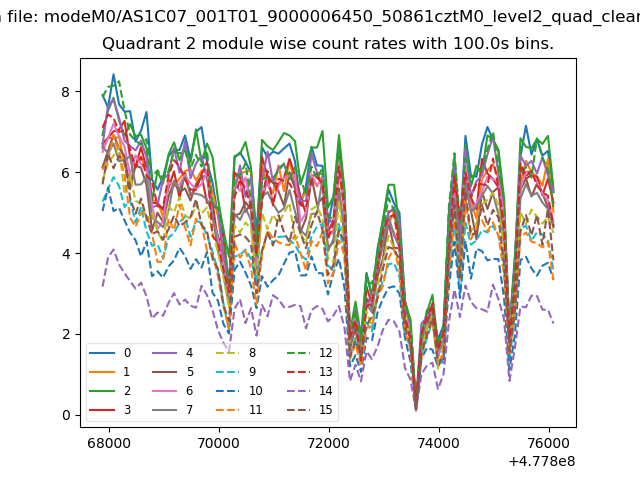
| Module-wise count rates for Quadrant B Data is divided into 100 sec bins |
 |
 |
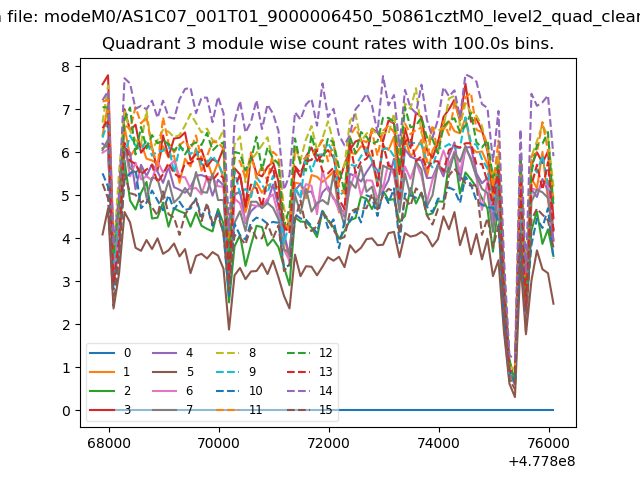
| Module-wise count rates for Quadrant C Data is divided into 100 sec bins |
 |
 |
| Module-wise count rates for Quadrant D Data is divided into 100 sec bins |
 |
 |
| Parameter | Plot |
|---|---|
| CZT HV Monitor | 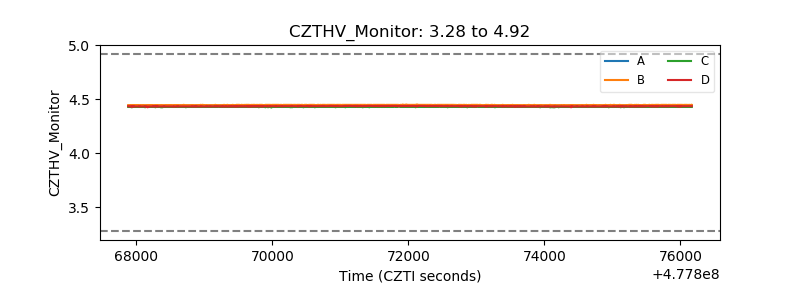 |
| D_VDD | 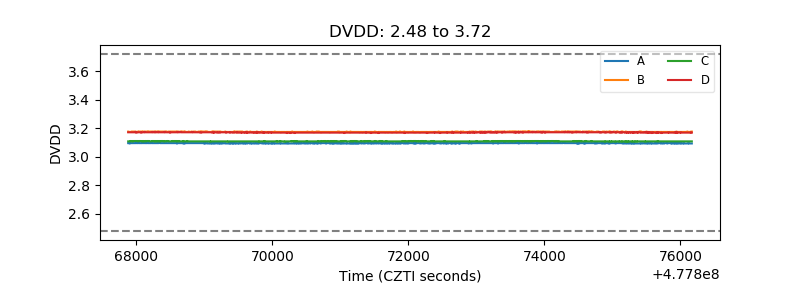 |
| Temperature 1 | 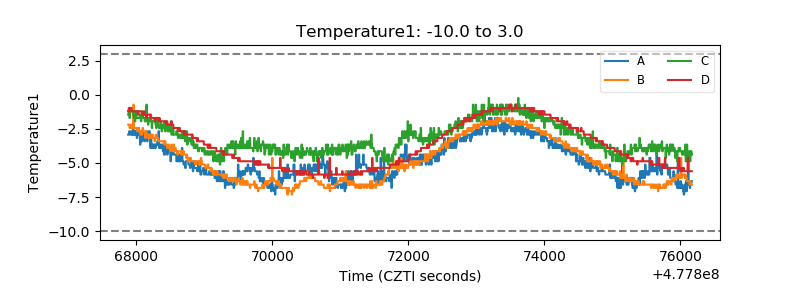 |
| Veto HV Monitor | 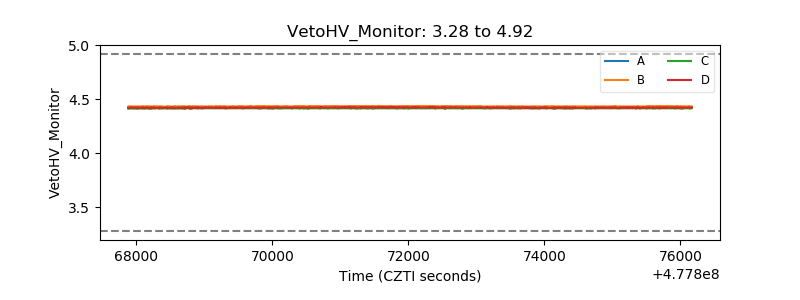 |
| Veto LLD | 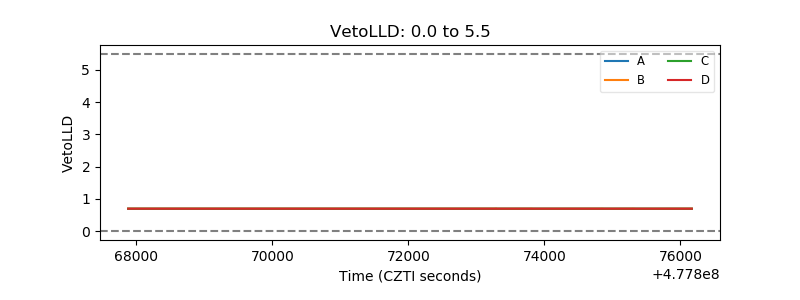 |
| Alpha Counter | 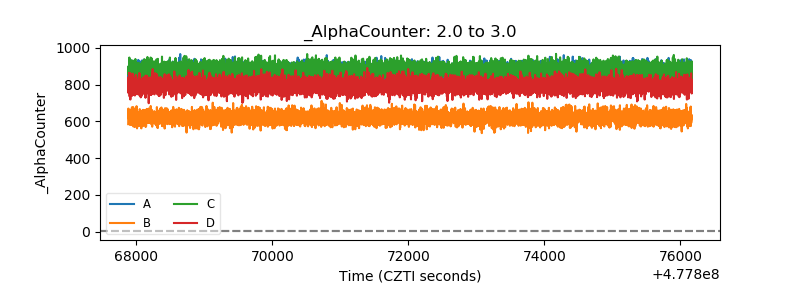 |
| _CPM_Rate | 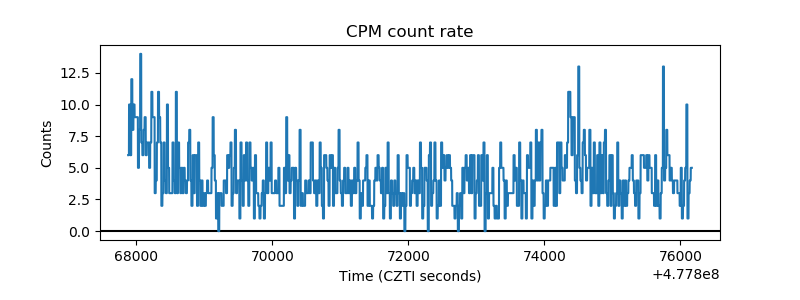 |
| CZT Counter | 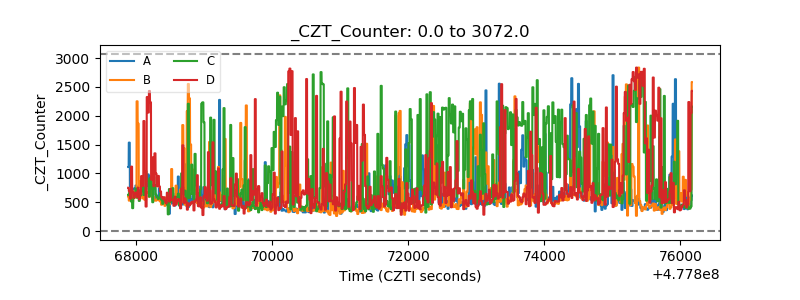 |
| +2.5 Volts monitor | 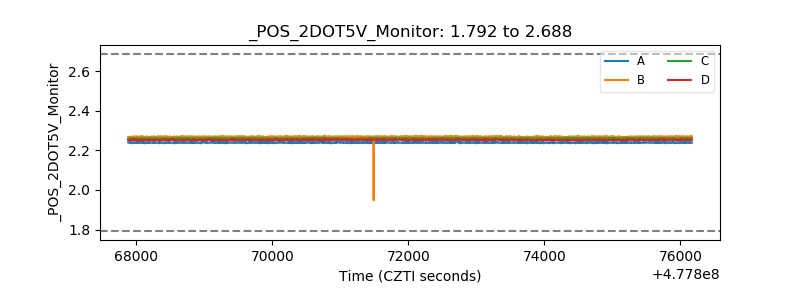 |
| +5 Volts monitor | 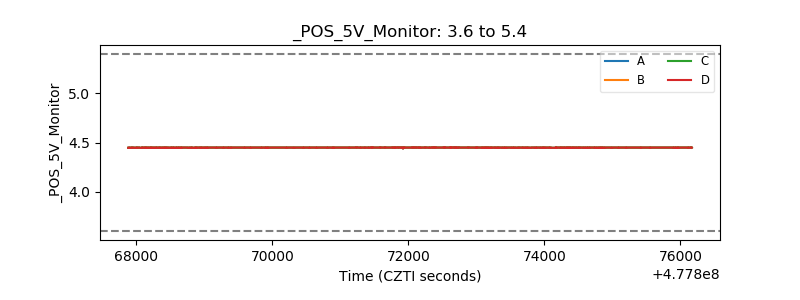 |
| _ROLL_ROT | 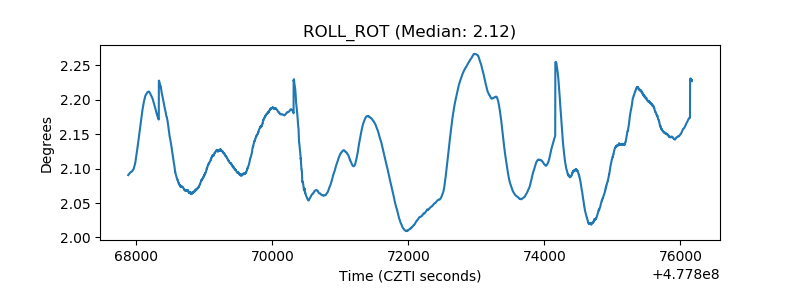 |
| _Roll_DEC | 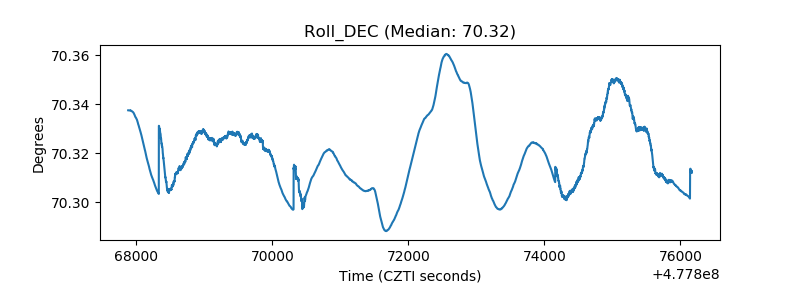 |
| _Roll_RA | 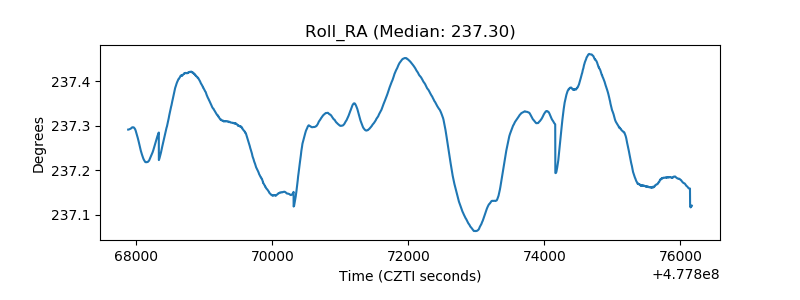 |
| Veto Counter | 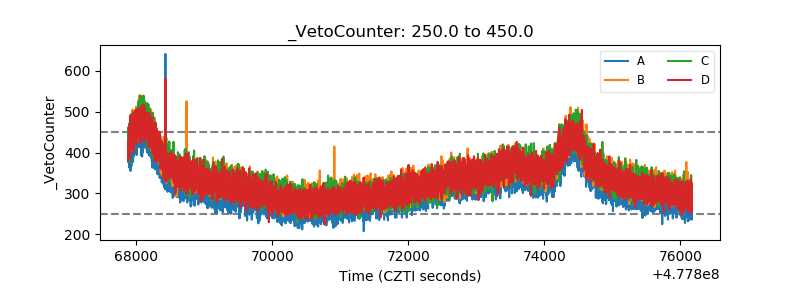 |