| Param | Original file | Final file |
|---|---|---|
| Filename | modeM0/AS1C07_001T01_9000006450_50862cztM0_level2.fits | modeM0/AS1C07_001T01_9000006450_50862cztM0_level2_quad_clean.evt |
| Size (bytes) | 938,413,440 | 90,648,000 |
| Size | 894.9 MB | 86.4 MB |
| Events in quadrant A | 5,421,666 | 684,843 |
| Events in quadrant B | 8,181,908 | 648,219 |
| Events in quadrant C | 11,491,921 | 386,492 |
| Events in quadrant D | 9,046,958 | 489,851 |
| Mode SS | |||
|---|---|---|---|
| Quadrant | BADHDUFLAG | Total packets | Discarded packets |
| A | 0 | 154 | 0 |
| B | 0 | 154 | 0 |
| C | 0 | 154 | 0 |
| D | 0 | 154 | 0 |
| Mode M0 | |||
|---|---|---|---|
| Quadrant | BADHDUFLAG | Total packets | Discarded packets |
| A | 0 | 21602 | 0 |
| B | 0 | 29775 | 0 |
| C | 0 | 39436 | 0 |
| D | 0 | 32258 | 0 |
| Quadrant | Total seconds | Saturated seconds | Saturation percentage |
|---|---|---|---|
| A | 7686 | 432 | 5.620609% |
| B | 7686 | 1546 | 20.114494% |
| C | 7686 | 3671 | 47.762165% |
| D | 7687 | 1923 | 25.016261% |
Noise dominated data is calculated using 1-second bins in cleaned event files. If a bin has >2000 counts, and if more than 50% of those come from <1% of pixels, then it is considered to be noise-dominated and hence unusable.
| Quadrant | # 1 sec bins | Bins with >0 counts | Bins with >2000 counts | High rate bins dominated by noise | Noise dominated (total time) | Noise dominated (detector-on time) | Marked lightcurve |
|---|---|---|---|---|---|---|---|
| A | 7686 | 7686 | 292 | 292 | 3.80% | 3.80% | 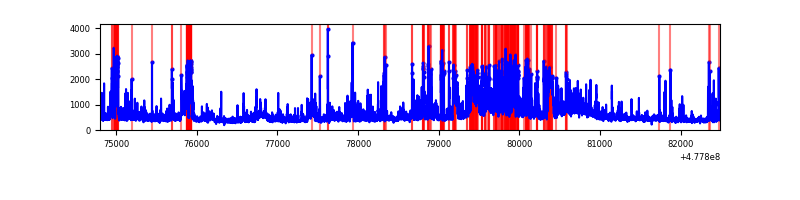 |
| B | 7685 | 7685 | 1052 | 1052 | 13.69% | 13.69% | 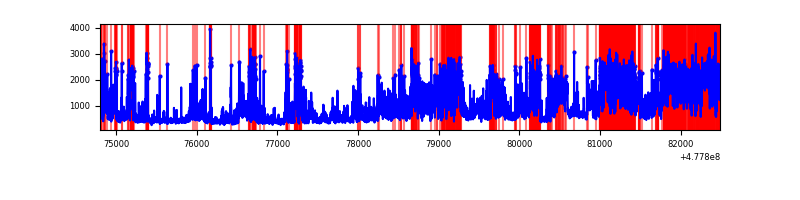 |
| C | 7686 | 7686 | 2530 | 2530 | 32.92% | 32.92% | 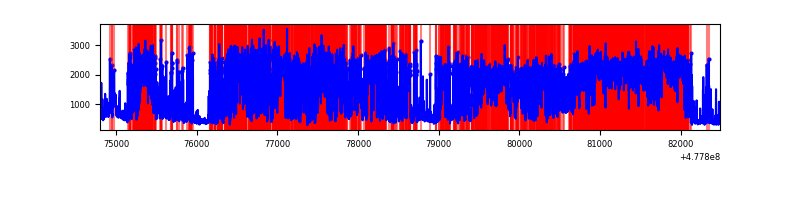 |
| D | 7687 | 7687 | 1864 | 1864 | 24.25% | 24.25% | 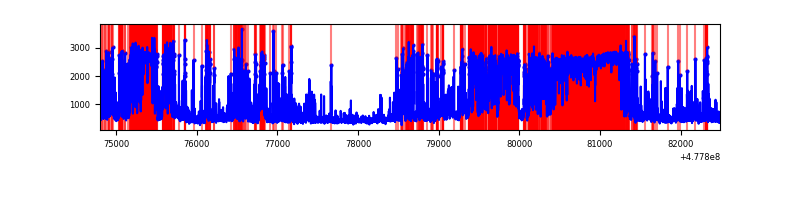 |
Top three noisy pixels from each quadrant. If the there are fewer than three noisy pixels in the level2.evt file, extra rows are filled as -1
| Pixel properties | Quadrant properties | ||||||
|---|---|---|---|---|---|---|---|
| Quadrant | DetID | PixID | Counts | Sigma | Mean | Median | Sigma |
| A | 3 | 130 | 584169 | 2933.42 | 794 | 772 | 198.9 |
| A | 9 | 248 | 448936 | 2253.44 | 794 | 772 | 198.9 |
| A | 9 | 13 | 253565 | 1271.08 | 794 | 772 | 198.9 |
| B | 5 | 172 | 3917621 | 24108.68 | 753 | 725 | 162.5 |
| B | 4 | 206 | 499118 | 3067.63 | 753 | 725 | 162.5 |
| B | 10 | 247 | 307762 | 1889.82 | 753 | 725 | 162.5 |
| C | 4 | 210 | 4212933 | 25410.95 | 598 | 594 | 165.8 |
| C | 15 | 229 | 3293596 | 19865.05 | 598 | 594 | 165.8 |
| C | 12 | 247 | 204231 | 1228.44 | 598 | 594 | 165.8 |
| D | 15 | 185 | 3944104 | 21291.97 | 660 | 637 | 185.2 |
| D | 1 | 47 | 390880 | 2107.04 | 660 | 637 | 185.2 |
| D | 2 | 249 | 334741 | 1803.93 | 660 | 637 | 185.2 |
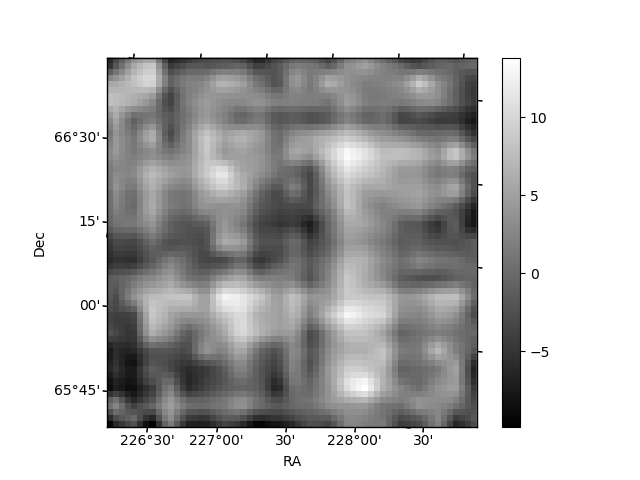
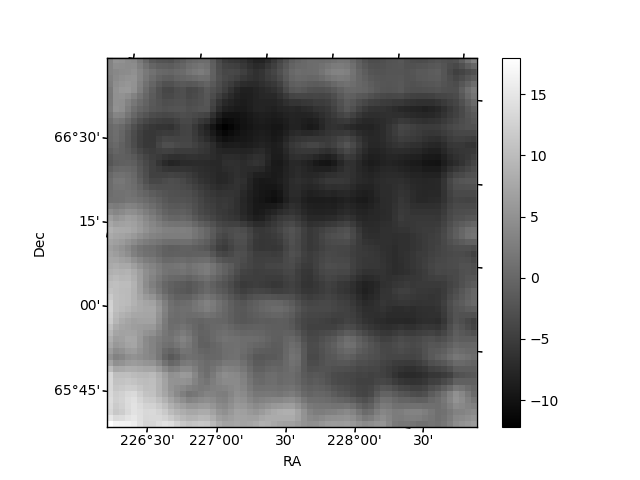
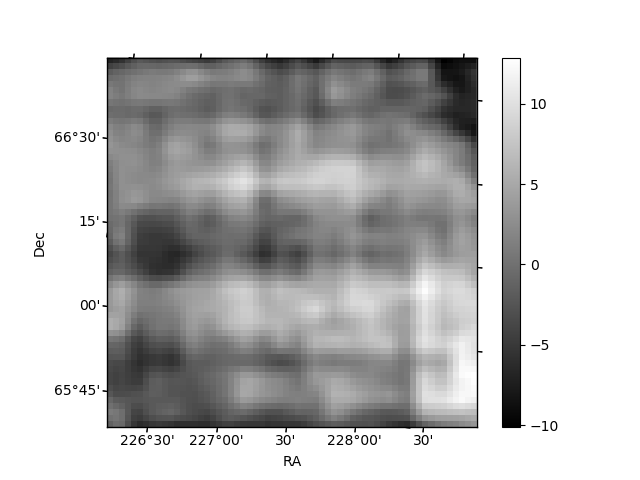
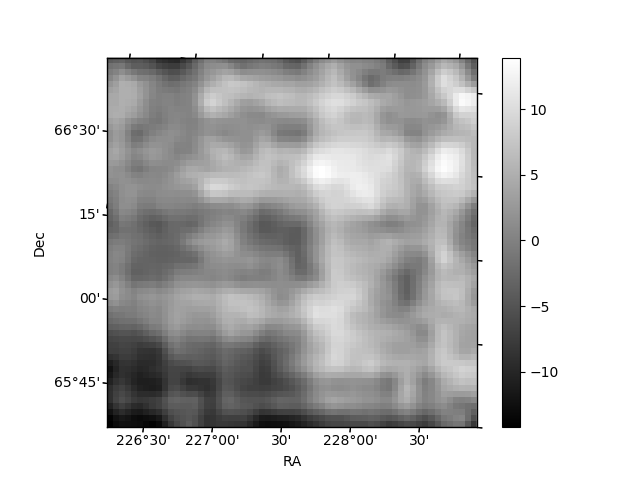
Histogram calculated using DETX and DETY for each event in the final _common_clean file
| Quadrant A | 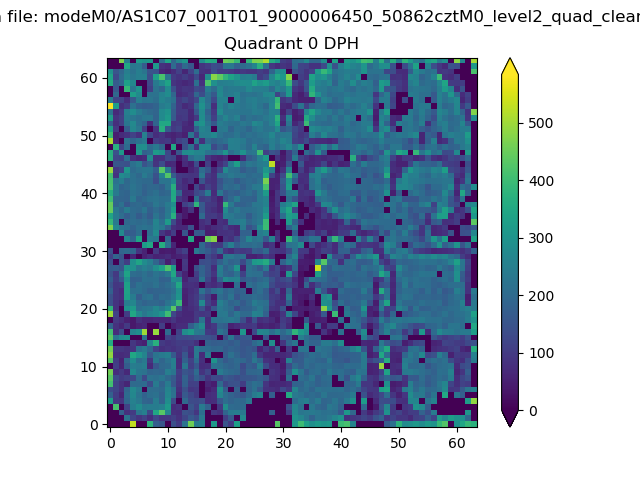 |
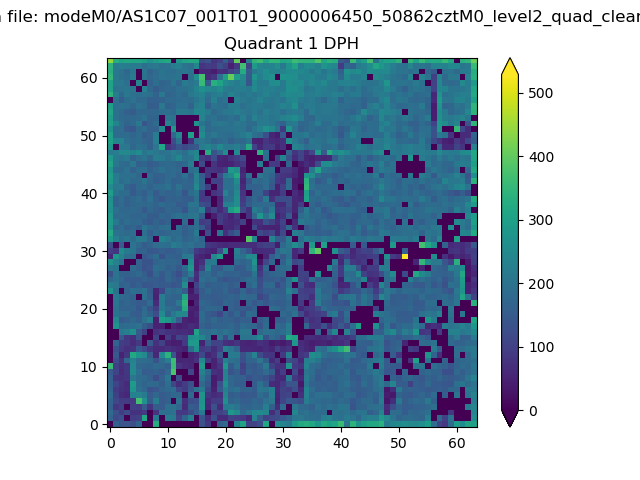 |
Quadrant B |
|---|---|---|---|
| Quadrant D | 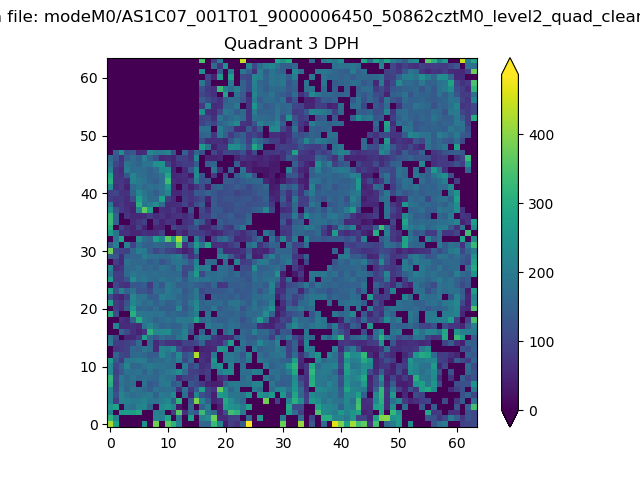 |
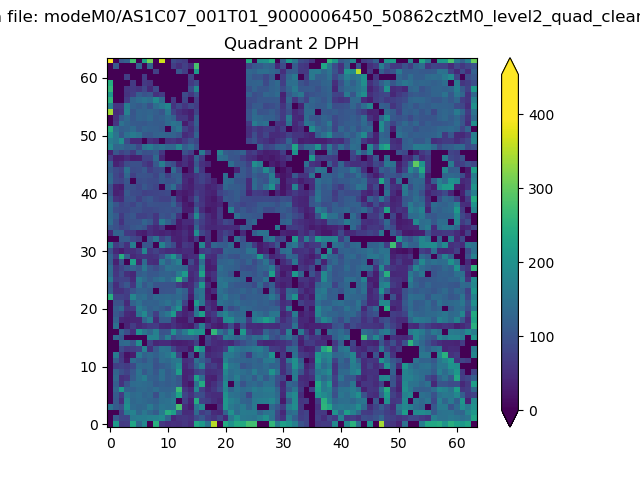 |
Quadrant C |
| Plot type | Count rate plots | Images |
|---|---|---|
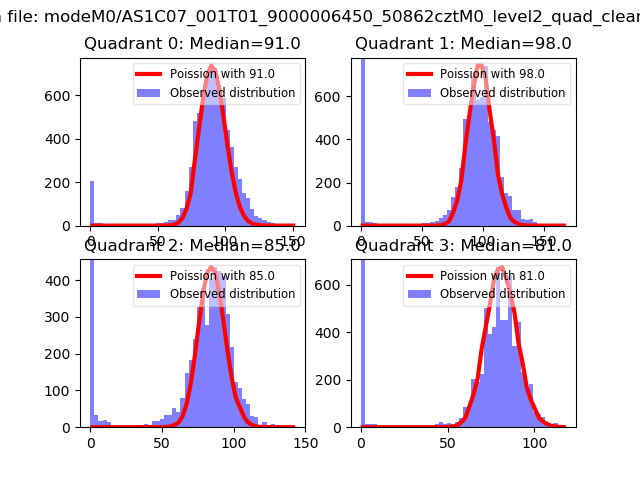
| Comparison with Poisson distribution Blue bars denote a histogram of data divided into 1 sec bins. Red curve is a Poisson curve with rate = median count rate of data. |
 |
 |
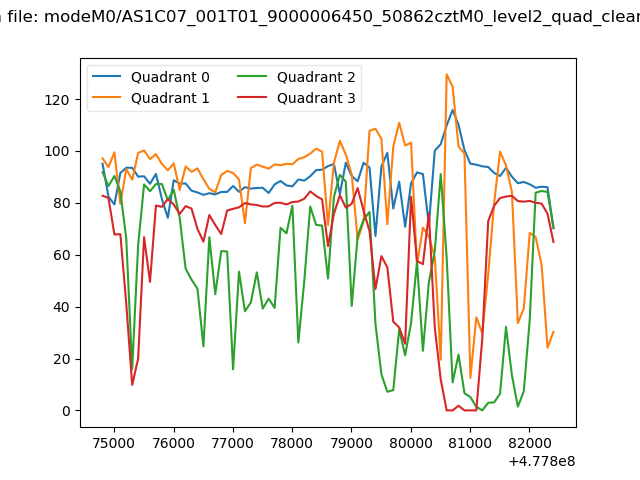
| Quadrant-wise count rates Data is divided into 100 sec bins |
 |
|
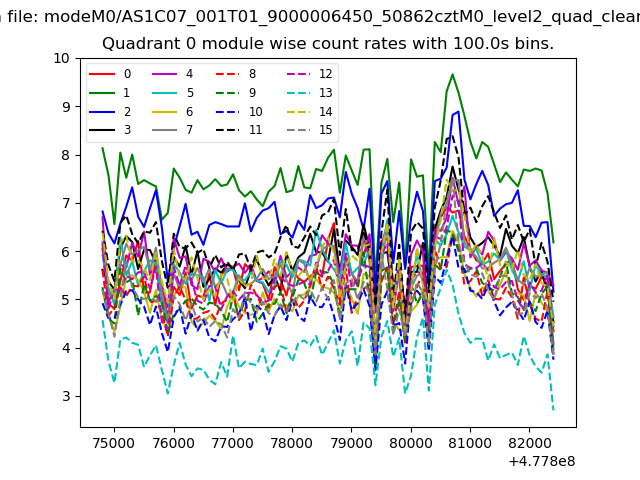
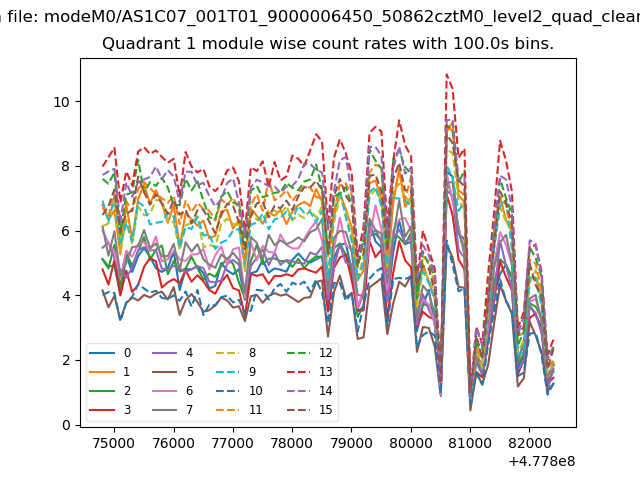
| Module-wise count rates for Quadrant A Data is divided into 100 sec bins |
 |
 |
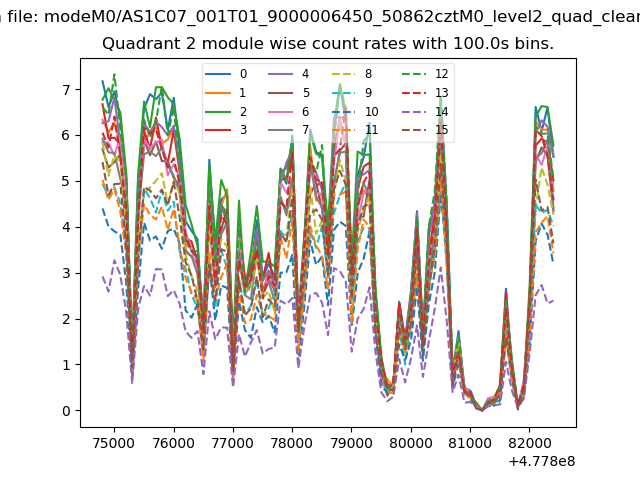
| Module-wise count rates for Quadrant B Data is divided into 100 sec bins |
 |
 |
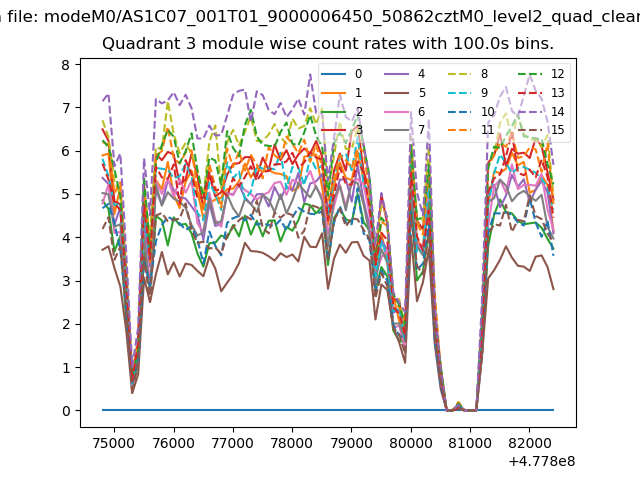
| Module-wise count rates for Quadrant C Data is divided into 100 sec bins |
 |
 |
| Module-wise count rates for Quadrant D Data is divided into 100 sec bins |
 |
 |
| Parameter | Plot |
|---|---|
| CZT HV Monitor |  |
| D_VDD |  |
| Temperature 1 | 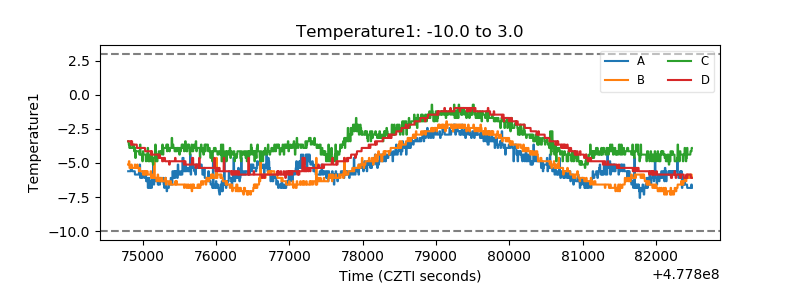 |
| Veto HV Monitor | 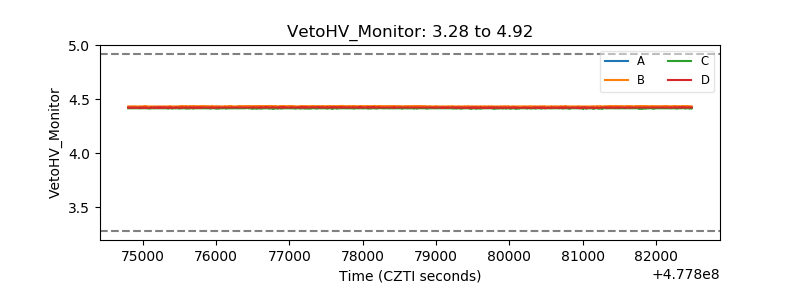 |
| Veto LLD | 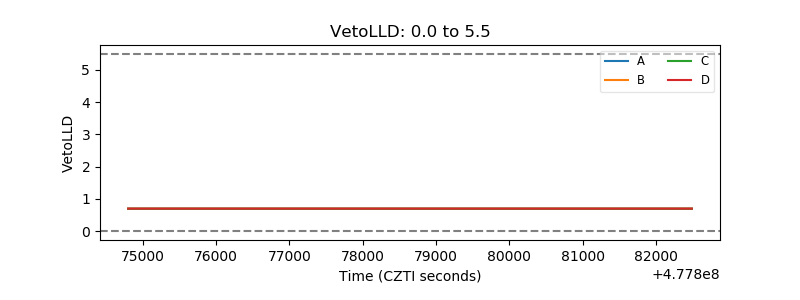 |
| Alpha Counter | 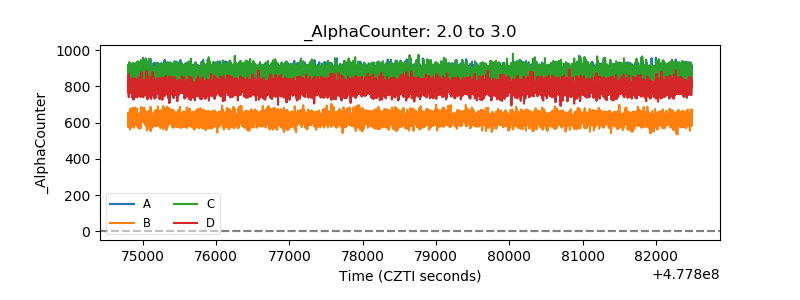 |
| _CPM_Rate | 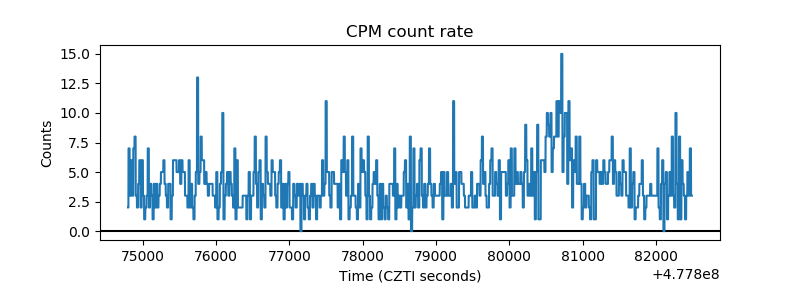 |
| CZT Counter | 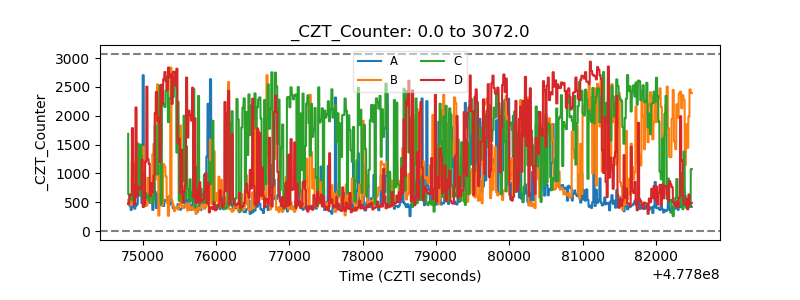 |
| +2.5 Volts monitor | 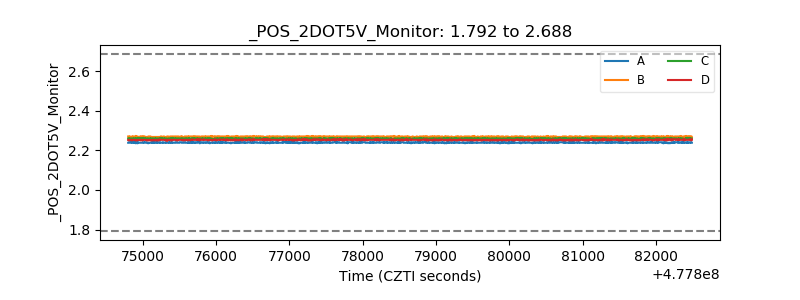 |
| +5 Volts monitor |  |
| _ROLL_ROT | 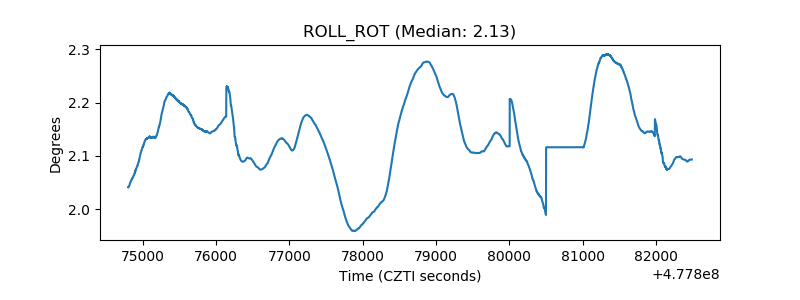 |
| _Roll_DEC | 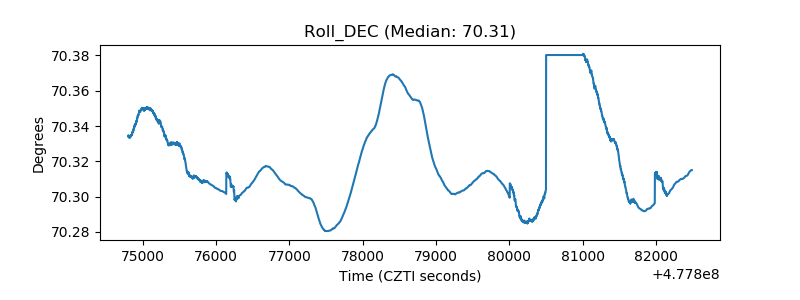 |
| _Roll_RA | 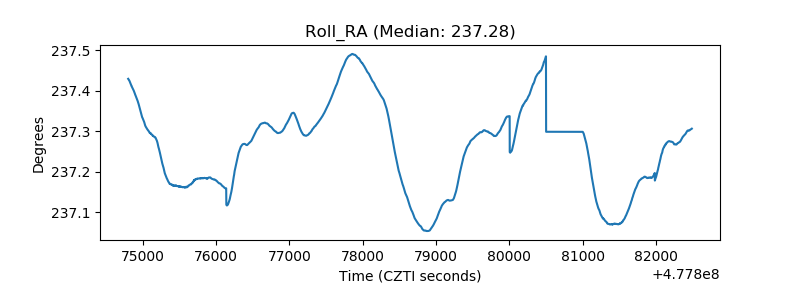 |
| Veto Counter | 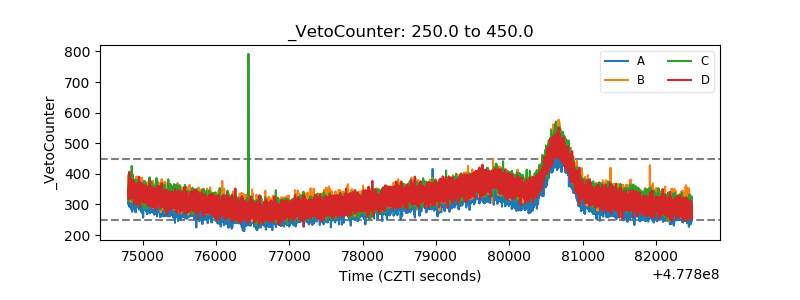 |