| Param | Original file | Final file |
|---|---|---|
| Filename | modeM0/AS1C07_001T01_9000006450_50865cztM0_level2.fits | modeM0/AS1C07_001T01_9000006450_50865cztM0_level2_quad_clean.evt |
| Size (bytes) | 1,754,743,680 | 239,716,800 |
| Size | 1.6 GB | 228.6 MB |
| Events in quadrant A | 17,617,732 | 1,568,264 |
| Events in quadrant B | 12,286,356 | 1,713,766 |
| Events in quadrant C | 18,626,492 | 1,273,392 |
| Events in quadrant D | 14,982,924 | 1,414,993 |
| Mode SS | |||
|---|---|---|---|
| Quadrant | BADHDUFLAG | Total packets | Discarded packets |
| A | 0 | 378 | 0 |
| B | 0 | 378 | 0 |
| C | 0 | 378 | 0 |
| D | 0 | 378 | 0 |
| Mode M0 | |||
|---|---|---|---|
| Quadrant | BADHDUFLAG | Total packets | Discarded packets |
| A | 0 | 65245 | 2 |
| B | 0 | 49740 | 2 |
| C | 0 | 68225 | 2 |
| D | 0 | 57693 | 2 |
| Mode M9 | |||
|---|---|---|---|
| Quadrant | BADHDUFLAG | Total packets | Discarded packets |
| A | 0 | 16 | 0 |
| B | 0 | 16 | 0 |
| C | 0 | 16 | 0 |
| D | 0 | 16 | 0 |
| Quadrant | Total seconds | Saturated seconds | Saturation percentage |
|---|---|---|---|
| A | 18679 | 1660 | 8.886985% |
| B | 18679 | 1298 | 6.948980% |
| C | 18679 | 3943 | 21.109267% |
| D | 18680 | 1578 | 8.447537% |
Noise dominated data is calculated using 1-second bins in cleaned event files. If a bin has >2000 counts, and if more than 50% of those come from <1% of pixels, then it is considered to be noise-dominated and hence unusable.
| Quadrant | # 1 sec bins | Bins with >0 counts | Bins with >2000 counts | High rate bins dominated by noise | Noise dominated (total time) | Noise dominated (detector-on time) | Marked lightcurve |
|---|---|---|---|---|---|---|---|
| A | 20199 | 18680 | 1531 | 1531 | 7.58% | 8.20% | 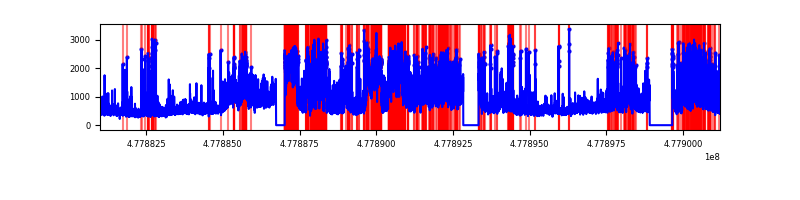 |
| B | 20199 | 18680 | 947 | 947 | 4.69% | 5.07% | 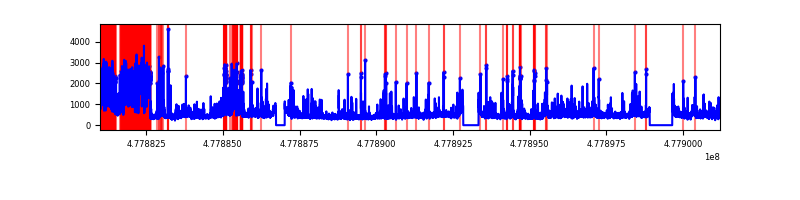 |
| C | 20199 | 18680 | 3054 | 3054 | 15.12% | 16.35% | 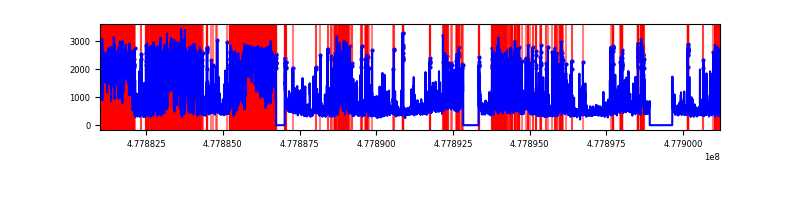 |
| D | 20200 | 18681 | 1492 | 1492 | 7.39% | 7.99% | 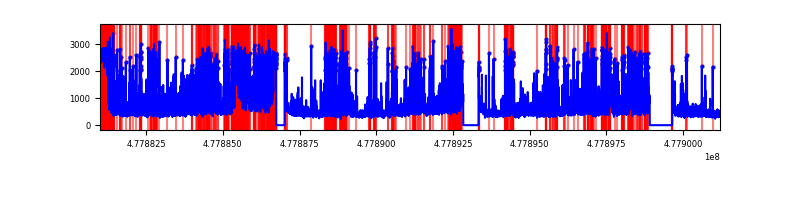 |
Top three noisy pixels from each quadrant. If the there are fewer than three noisy pixels in the level2.evt file, extra rows are filled as -1
| Pixel properties | Quadrant properties | ||||||
|---|---|---|---|---|---|---|---|
| Quadrant | DetID | PixID | Counts | Sigma | Mean | Median | Sigma |
| A | 4 | 4 | 5011368 | 10524.0 | 1916 | 1865 | 476.0 |
| A | 12 | 80 | 2842337 | 5967.29 | 1916 | 1865 | 476.0 |
| A | 8 | 249 | 274467 | 572.68 | 1916 | 1865 | 476.0 |
| B | 5 | 172 | 3323336 | 8185.73 | 1915 | 1847 | 405.8 |
| B | 8 | 128 | 558287 | 1371.33 | 1915 | 1847 | 405.8 |
| B | 10 | 247 | 119414 | 289.74 | 1915 | 1847 | 405.8 |
| C | 4 | 210 | 3454262 | 7485.03 | 1686 | 1672 | 461.3 |
| C | 15 | 229 | 2845420 | 6165.09 | 1686 | 1672 | 461.3 |
| C | 1 | 29 | 1010425 | 2186.92 | 1686 | 1672 | 461.3 |
| D | 15 | 185 | 2424172 | 4781.21 | 1813 | 1759 | 506.7 |
| D | 2 | 249 | 1101708 | 2171.01 | 1813 | 1759 | 506.7 |
| D | 1 | 47 | 717685 | 1413.05 | 1813 | 1759 | 506.7 |
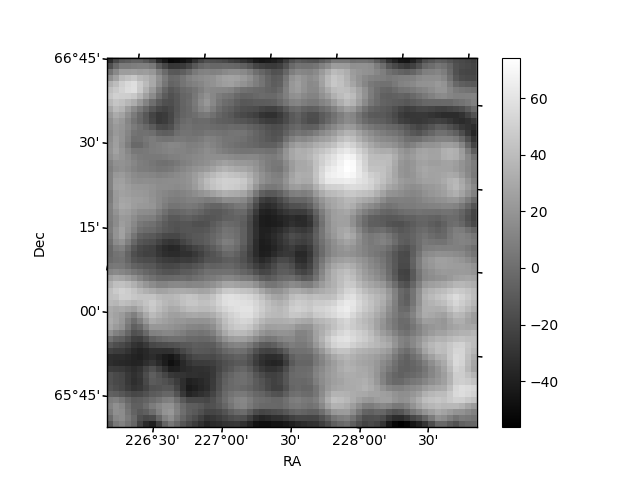
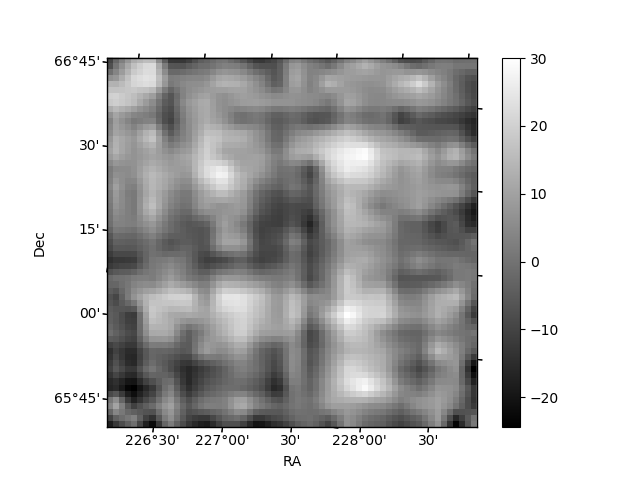
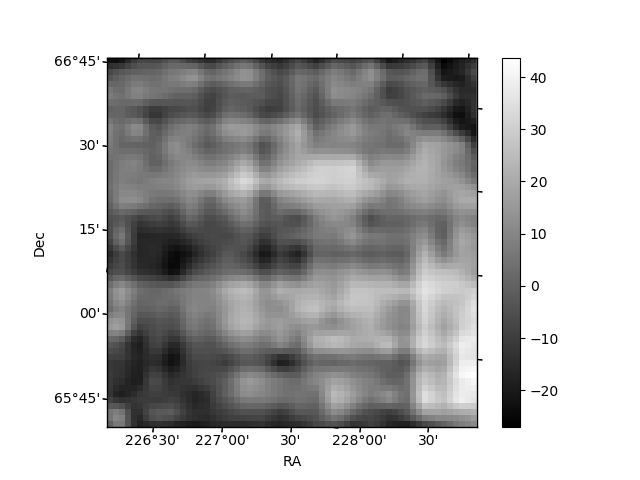
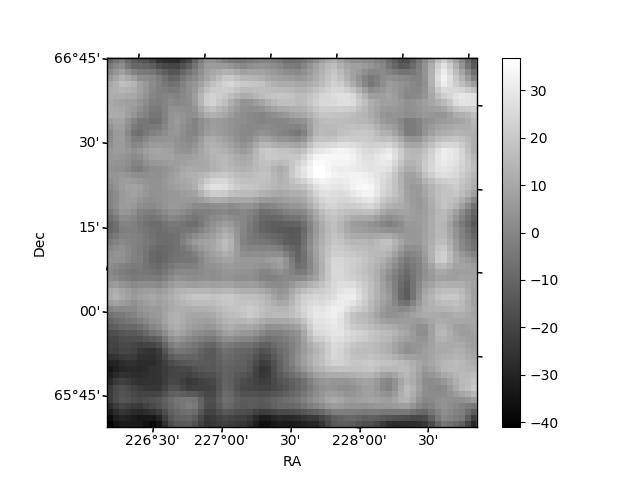
Histogram calculated using DETX and DETY for each event in the final _common_clean file
| Quadrant A | 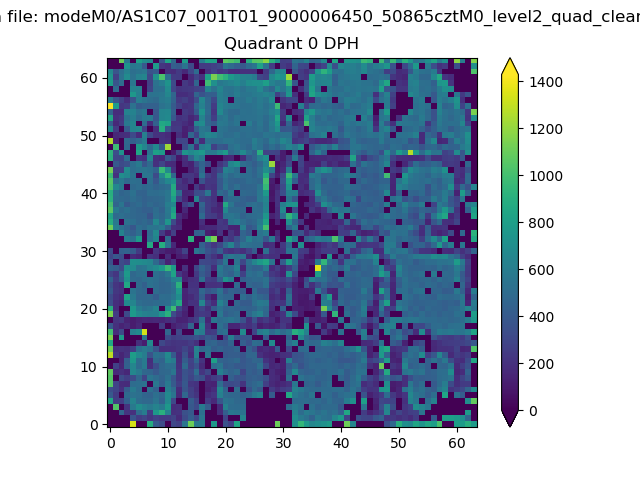 |
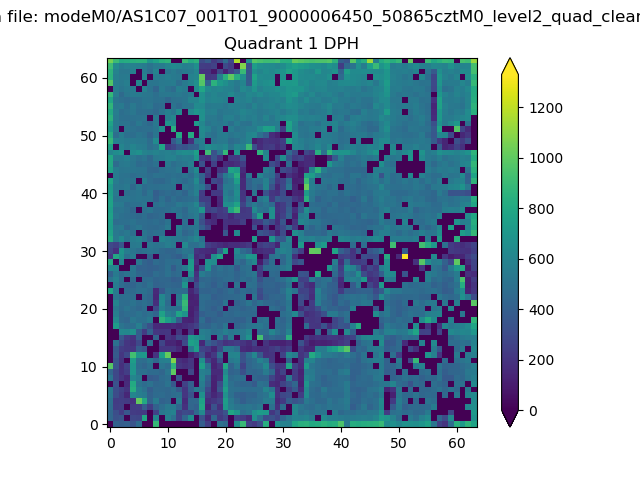 |
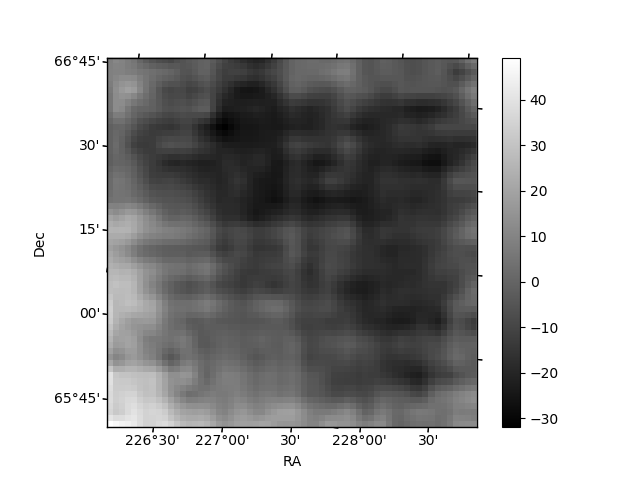
Quadrant B |
|---|---|---|---|
| Quadrant D | 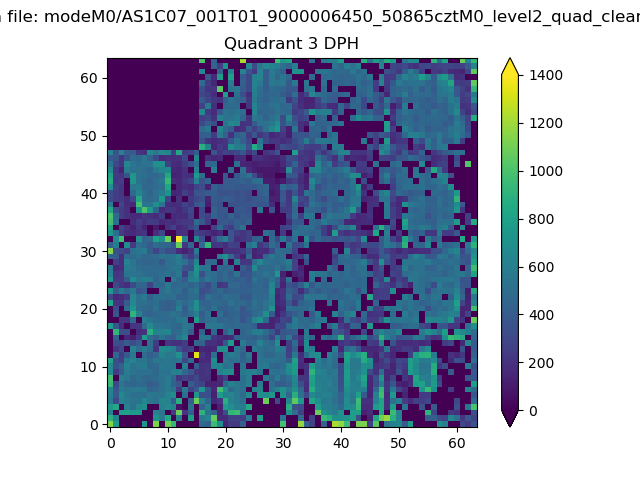 |
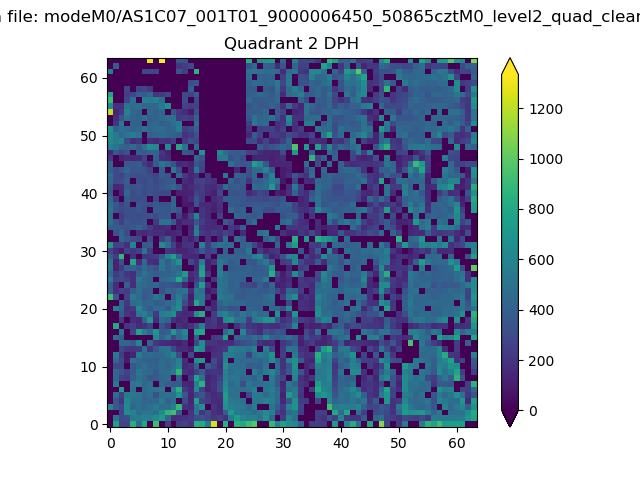 |
Quadrant C |
| Plot type | Count rate plots | Images |
|---|---|---|
| Comparison with Poisson distribution Blue bars denote a histogram of data divided into 1 sec bins. Red curve is a Poisson curve with rate = median count rate of data. |
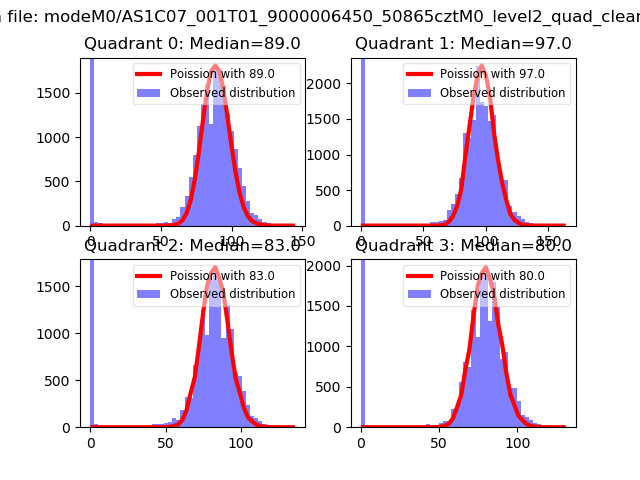 |
 |
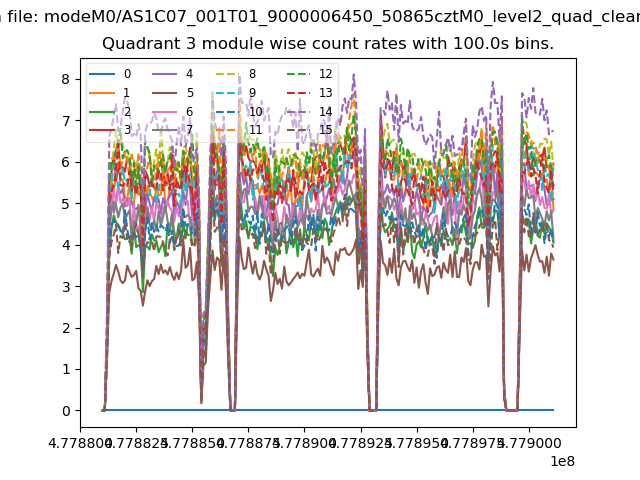
| Quadrant-wise count rates Data is divided into 100 sec bins |
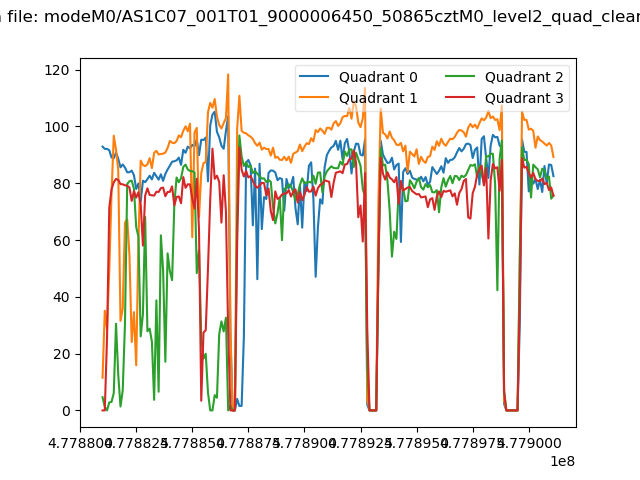 |
|
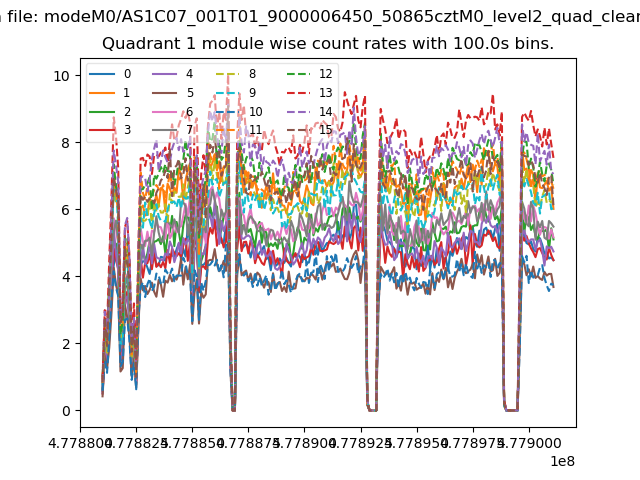
| Module-wise count rates for Quadrant A Data is divided into 100 sec bins |
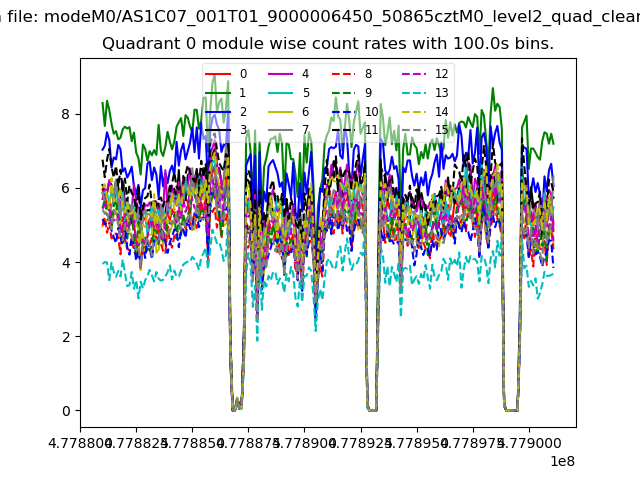 |
 |
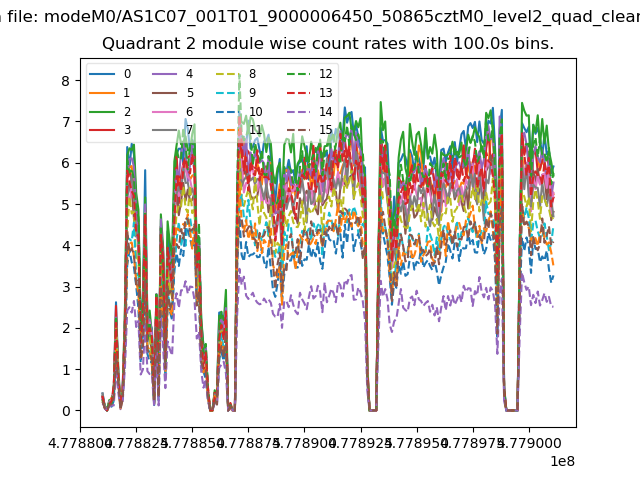
| Module-wise count rates for Quadrant B Data is divided into 100 sec bins |
 |
 |
| Module-wise count rates for Quadrant C Data is divided into 100 sec bins |
 |
 |
| Module-wise count rates for Quadrant D Data is divided into 100 sec bins |
 |
 |
| Parameter | Plot |
|---|---|
| CZT HV Monitor | 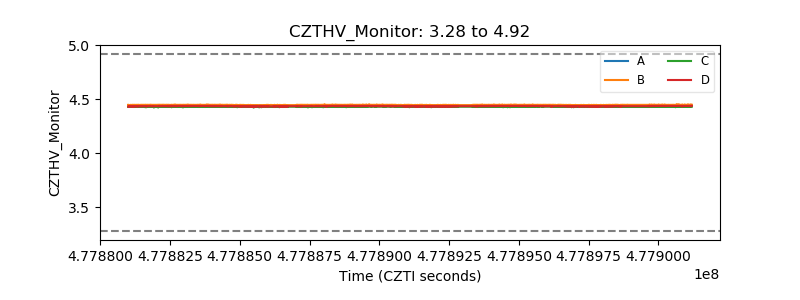 |
| D_VDD | 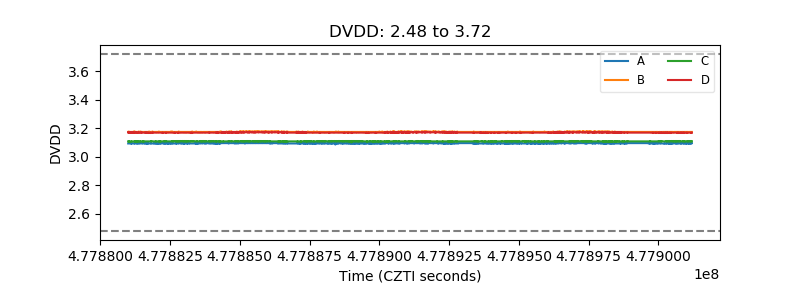 |
| Temperature 1 | 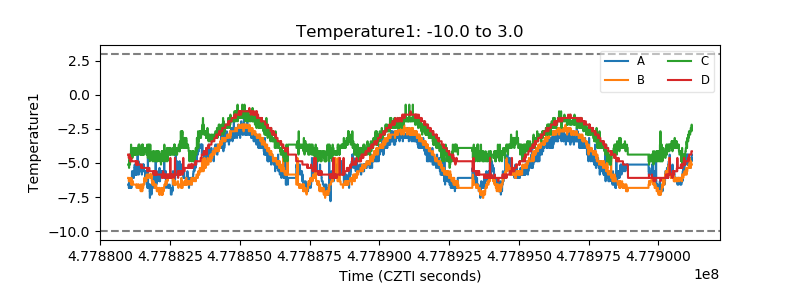 |
| Veto HV Monitor | 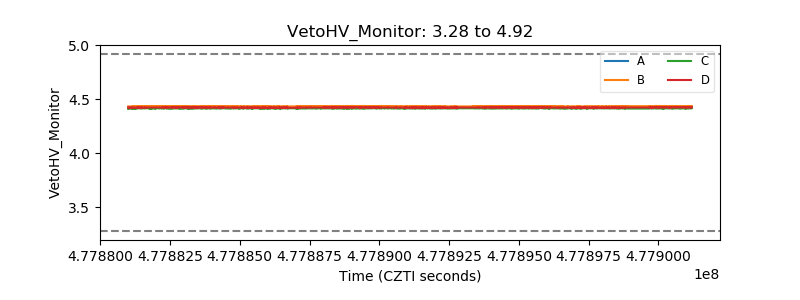 |
| Veto LLD | 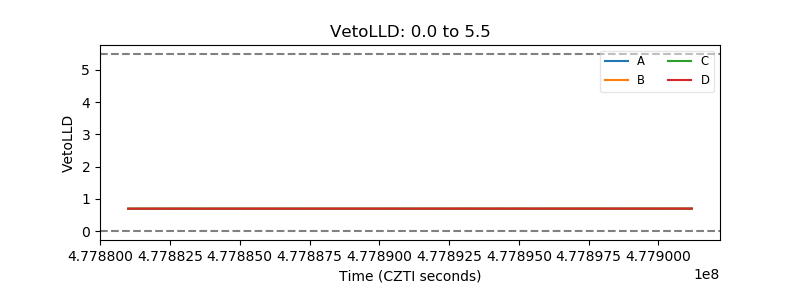 |
| Alpha Counter | 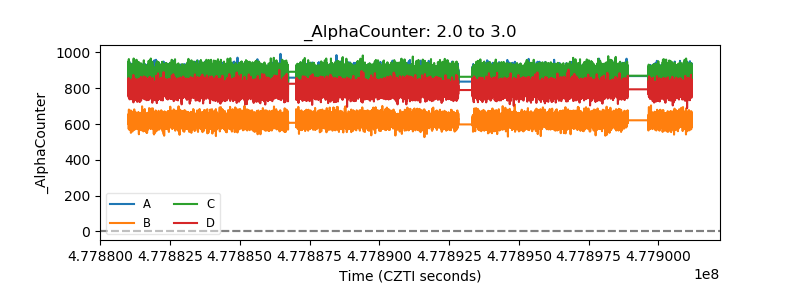 |
| _CPM_Rate | 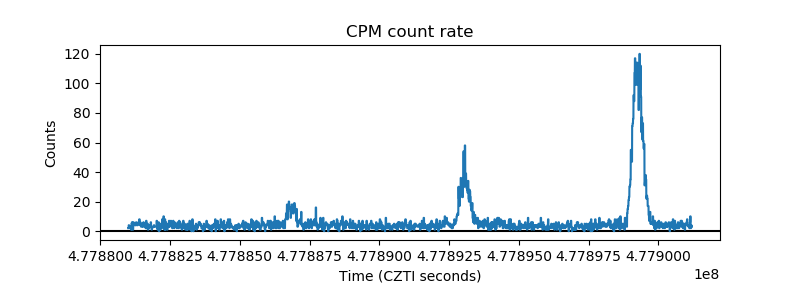 |
| CZT Counter | 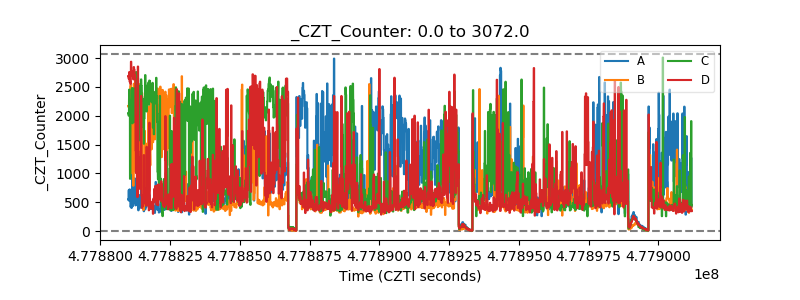 |
| +2.5 Volts monitor | 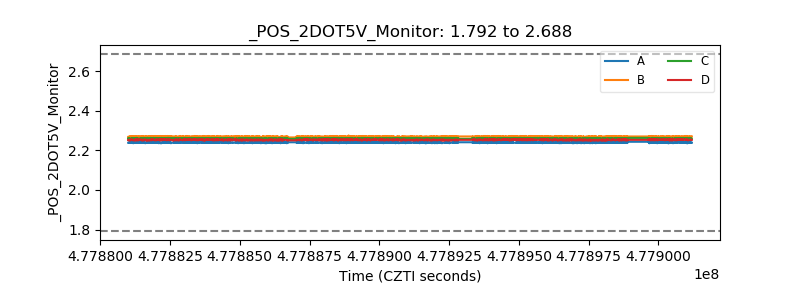 |
| +5 Volts monitor |  |
| _ROLL_ROT | 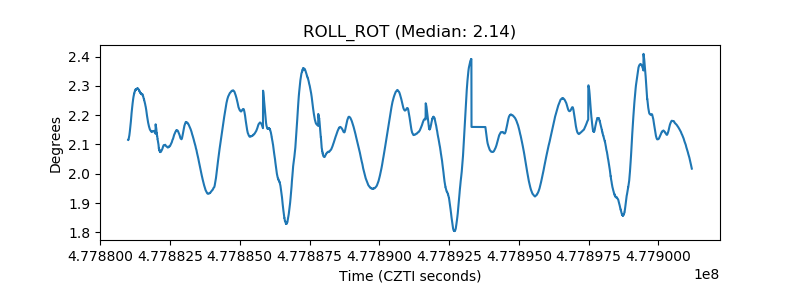 |
| _Roll_DEC | 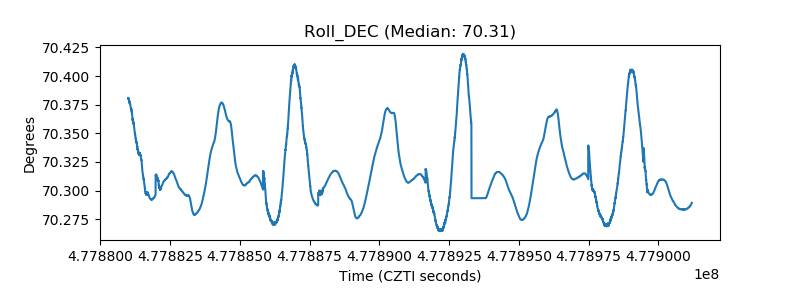 |
| _Roll_RA | 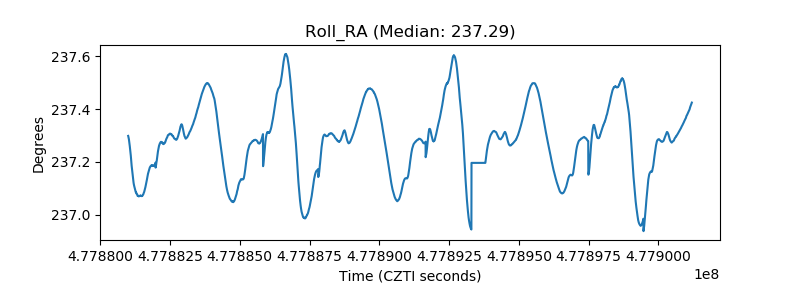 |
| Veto Counter | 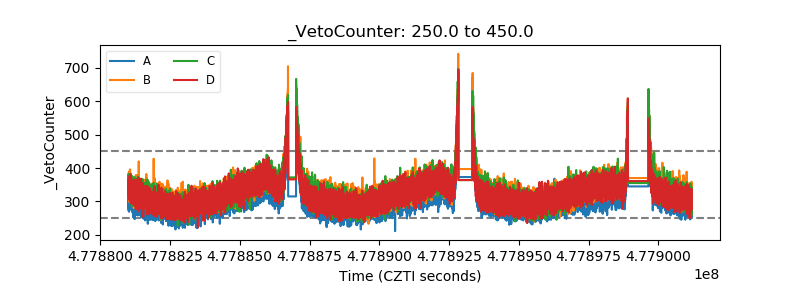 |