| Param | Original file | Final file |
|---|---|---|
| Filename | modeM0/AS1C07_001T01_9000006450_50866cztM0_level2.fits | modeM0/AS1C07_001T01_9000006450_50866cztM0_level2_quad_clean.evt |
| Size (bytes) | 526,196,160 | 96,546,240 |
| Size | 501.8 MB | 92.1 MB |
| Events in quadrant A | 5,678,786 | 614,291 |
| Events in quadrant B | 4,067,458 | 672,159 |
| Events in quadrant C | 4,777,597 | 595,180 |
| Events in quadrant D | 4,419,816 | 562,195 |
| Mode SS | |||
|---|---|---|---|
| Quadrant | BADHDUFLAG | Total packets | Discarded packets |
| A | 0 | 138 | 0 |
| B | 0 | 138 | 0 |
| C | 0 | 138 | 0 |
| D | 0 | 138 | 0 |
| Mode M0 | |||
|---|---|---|---|
| Quadrant | BADHDUFLAG | Total packets | Discarded packets |
| A | 0 | 21602 | 3 |
| B | 0 | 16974 | 1 |
| C | 0 | 18966 | 1 |
| D | 0 | 18023 | 1 |
| Mode M9 | |||
|---|---|---|---|
| Quadrant | BADHDUFLAG | Total packets | Discarded packets |
| A | 0 | 9 | 0 |
| B | 0 | 9 | 0 |
| C | 0 | 9 | 0 |
| D | 0 | 9 | 0 |
| Quadrant | Total seconds | Saturated seconds | Saturation percentage |
|---|---|---|---|
| A | 6886 | 412 | 5.983154% |
| B | 6887 | 340 | 4.936838% |
| C | 6887 | 370 | 5.372441% |
| D | 6887 | 288 | 4.181792% |
Noise dominated data is calculated using 1-second bins in cleaned event files. If a bin has >2000 counts, and if more than 50% of those come from <1% of pixels, then it is considered to be noise-dominated and hence unusable.
| Quadrant | # 1 sec bins | Bins with >0 counts | Bins with >2000 counts | High rate bins dominated by noise | Noise dominated (total time) | Noise dominated (detector-on time) | Marked lightcurve |
|---|---|---|---|---|---|---|---|
| A | 7751 | 6886 | 288 | 288 | 3.72% | 4.18% | 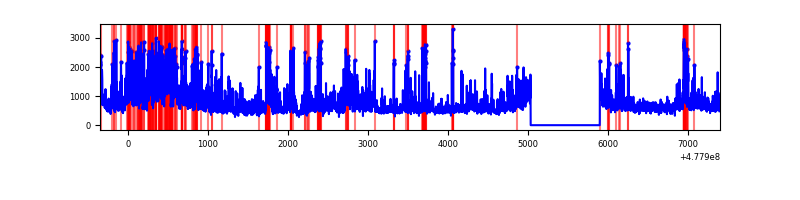 |
| B | 7751 | 6886 | 209 | 209 | 2.70% | 3.04% | 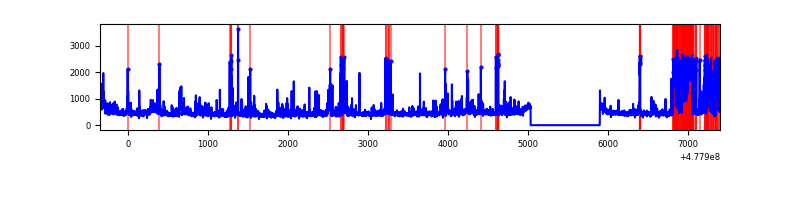 |
| C | 7752 | 6888 | 321 | 321 | 4.14% | 4.66% |  |
| D | 7752 | 6887 | 245 | 245 | 3.16% | 3.56% | 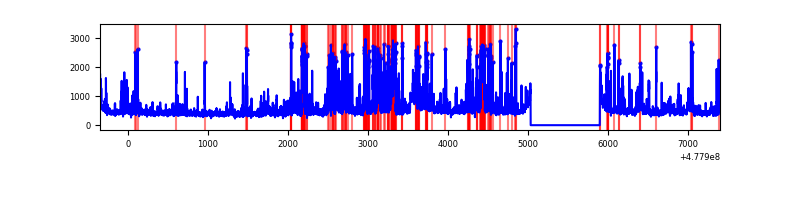 |
Top three noisy pixels from each quadrant. If the there are fewer than three noisy pixels in the level2.evt file, extra rows are filled as -1
| Pixel properties | Quadrant properties | ||||||
|---|---|---|---|---|---|---|---|
| Quadrant | DetID | PixID | Counts | Sigma | Mean | Median | Sigma |
| A | 4 | 4 | 1841354 | 10293.63 | 716 | 697 | 178.8 |
| A | 8 | 38 | 156264 | 869.99 | 716 | 697 | 178.8 |
| A | 4 | 249 | 146575 | 815.8 | 716 | 697 | 178.8 |
| B | 4 | 206 | 645329 | 4252.12 | 710 | 685 | 151.6 |
| B | 0 | 229 | 89395 | 585.14 | 710 | 685 | 151.6 |
| B | 4 | 170 | 77904 | 509.34 | 710 | 685 | 151.6 |
| C | 13 | 3 | 840481 | 4432.53 | 689 | 682 | 189.5 |
| C | 15 | 229 | 338969 | 1785.51 | 689 | 682 | 189.5 |
| C | 5 | 10 | 180774 | 950.54 | 689 | 682 | 189.5 |
| D | 2 | 249 | 341650 | 1792.98 | 688 | 664 | 190.2 |
| D | 11 | 245 | 231552 | 1214.06 | 688 | 664 | 190.2 |
| D | 15 | 185 | 212664 | 1114.74 | 688 | 664 | 190.2 |
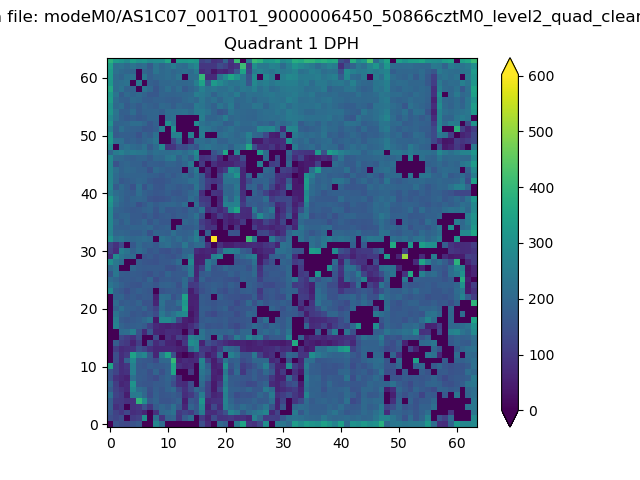
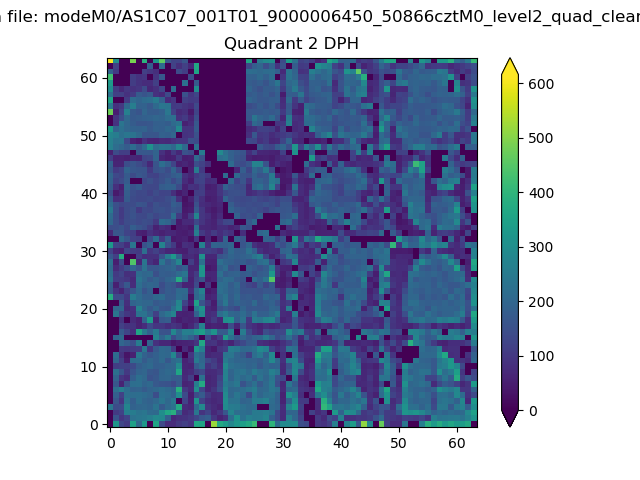
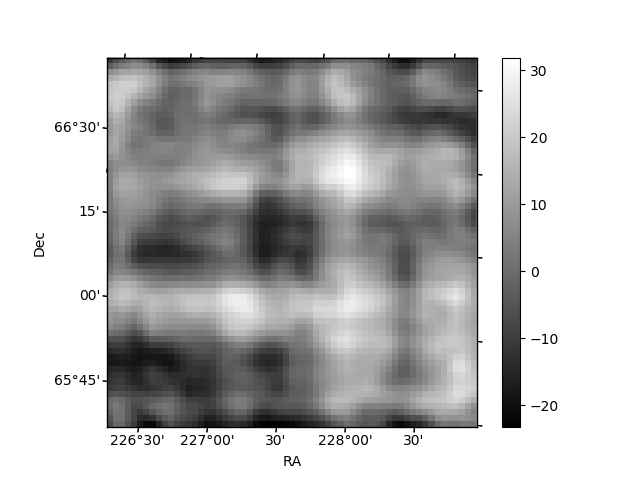
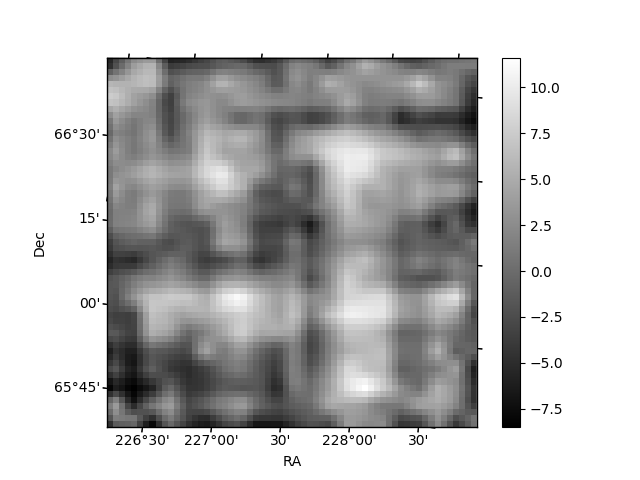
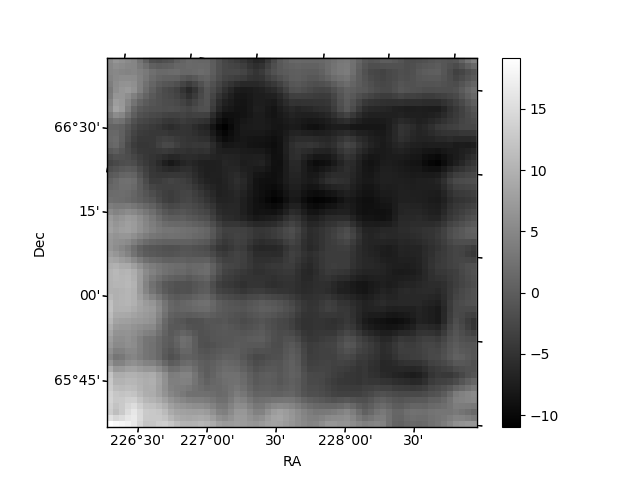
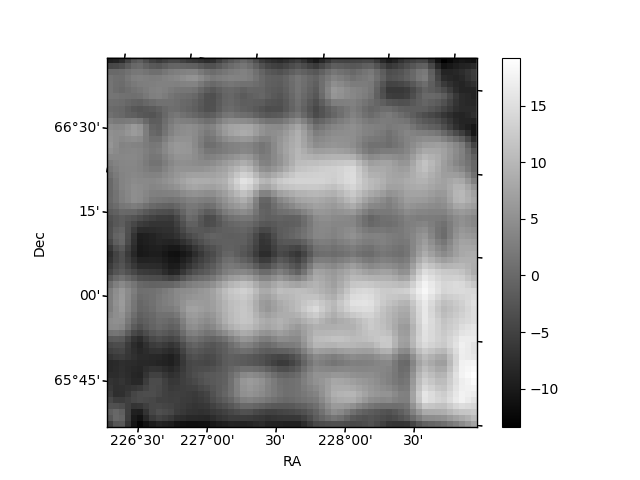
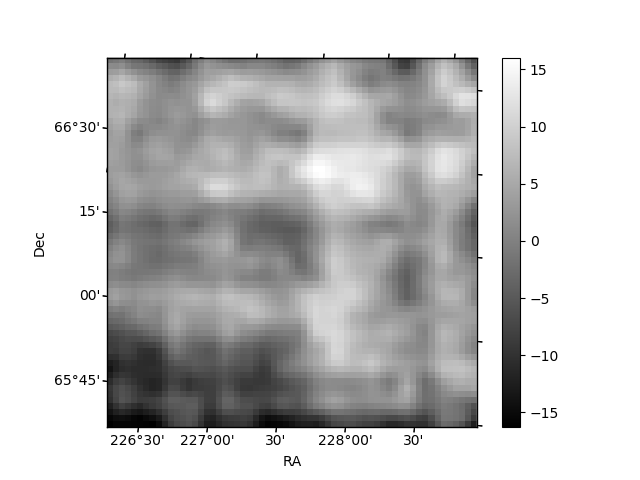
Histogram calculated using DETX and DETY for each event in the final _common_clean file
| Quadrant A | 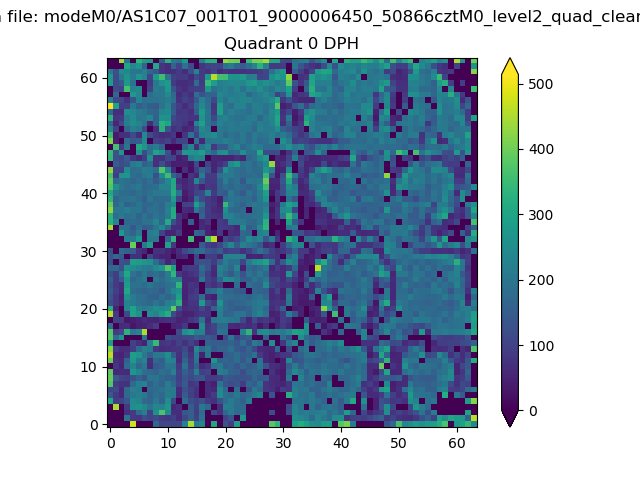 |
 |
Quadrant B |
|---|---|---|---|
| Quadrant D | 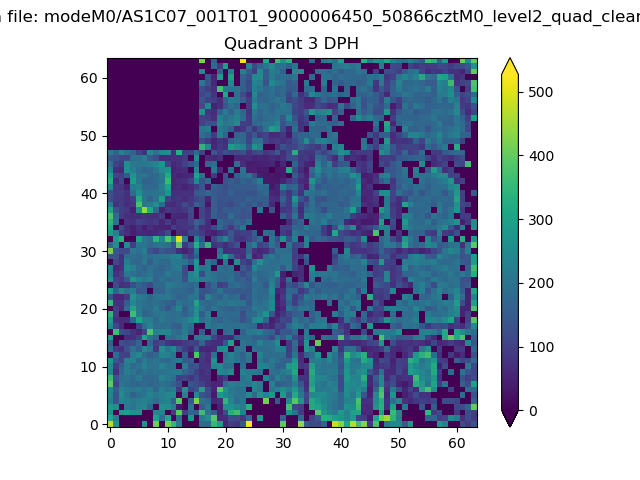 |
 |
Quadrant C |
| Plot type | Count rate plots | Images |
|---|---|---|
| Comparison with Poisson distribution Blue bars denote a histogram of data divided into 1 sec bins. Red curve is a Poisson curve with rate = median count rate of data. |
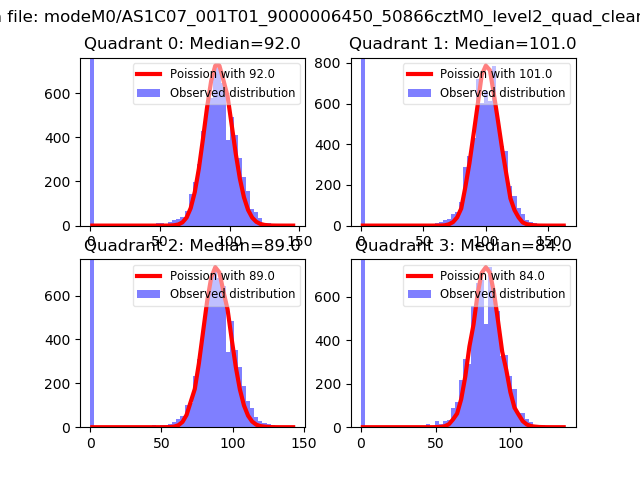 |
 |
| Quadrant-wise count rates Data is divided into 100 sec bins |
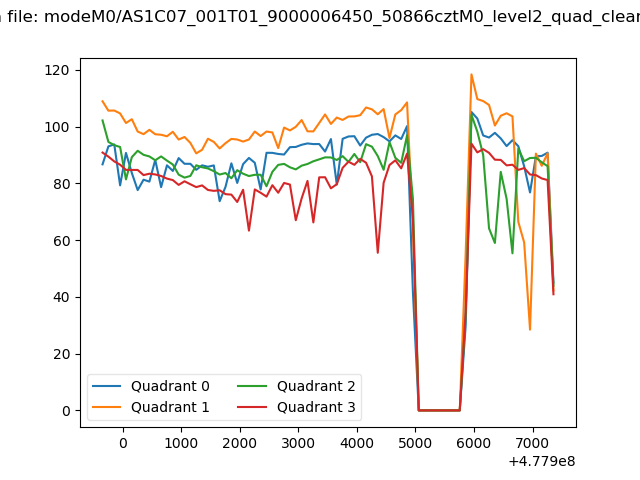 |
|
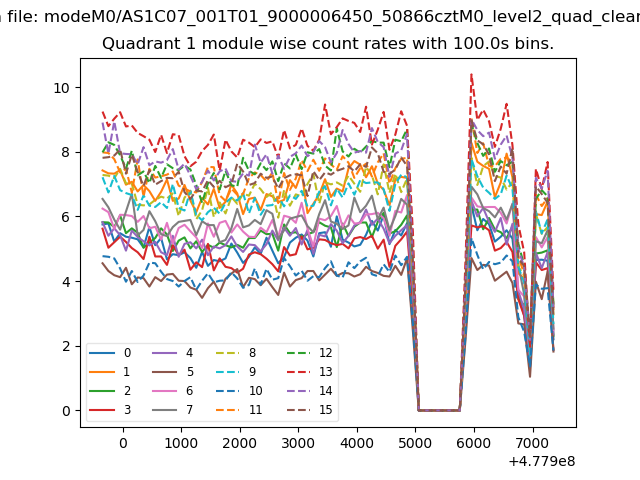
| Module-wise count rates for Quadrant A Data is divided into 100 sec bins |
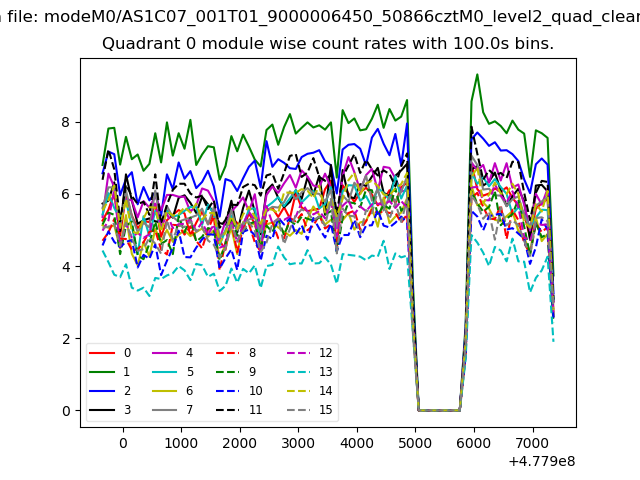 |
 |
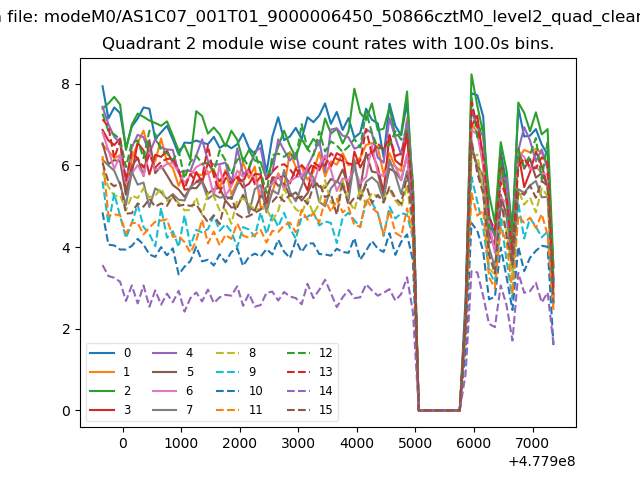
| Module-wise count rates for Quadrant B Data is divided into 100 sec bins |
 |
 |
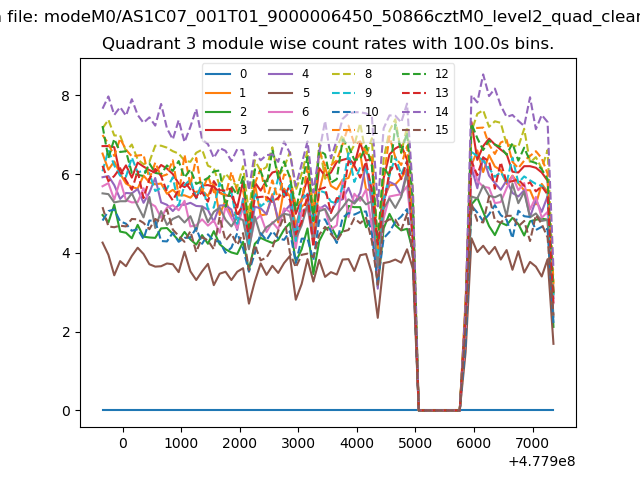
| Module-wise count rates for Quadrant C Data is divided into 100 sec bins |
 |
 |
| Module-wise count rates for Quadrant D Data is divided into 100 sec bins |
 |
 |
| Parameter | Plot |
|---|---|
| CZT HV Monitor |  |
| D_VDD | 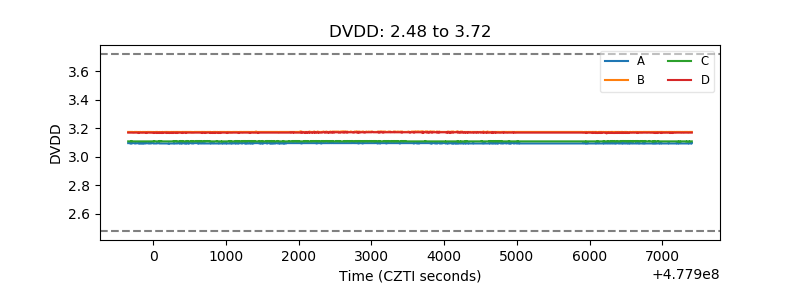 |
| Temperature 1 | 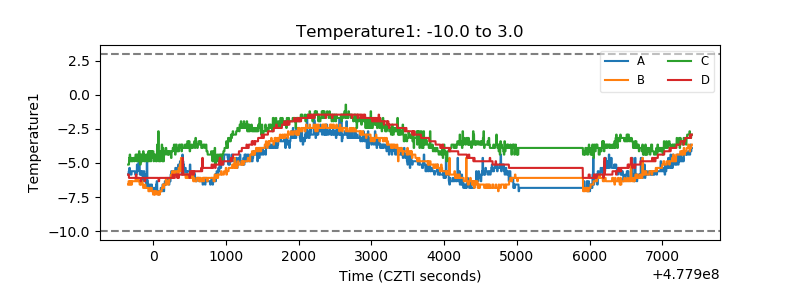 |
| Veto HV Monitor | 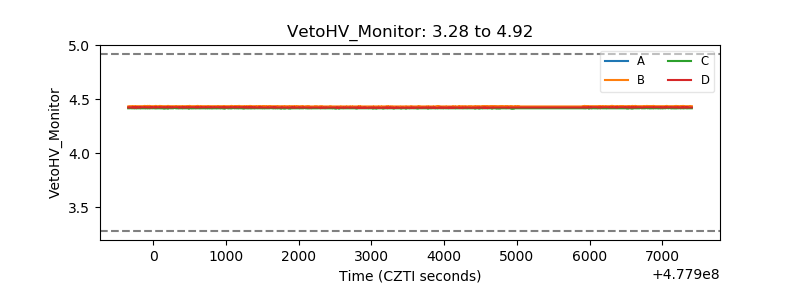 |
| Veto LLD | 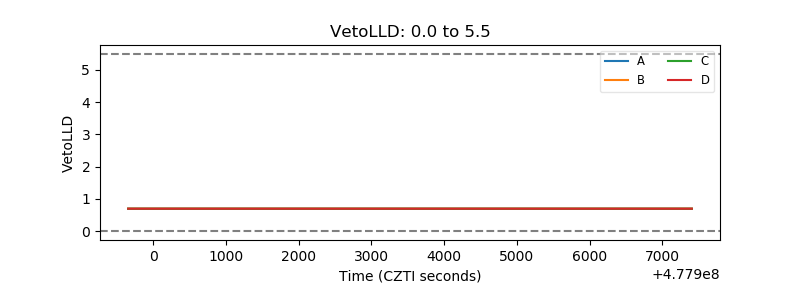 |
| Alpha Counter | 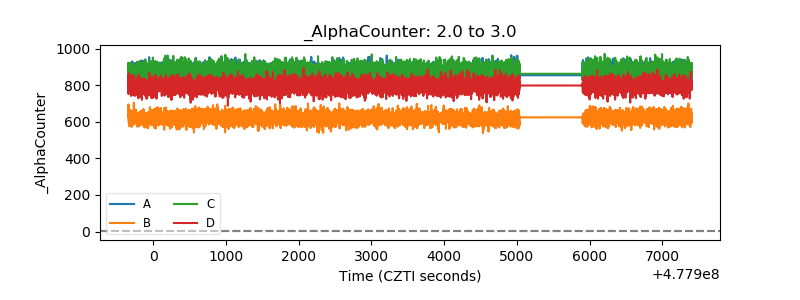 |
| _CPM_Rate | 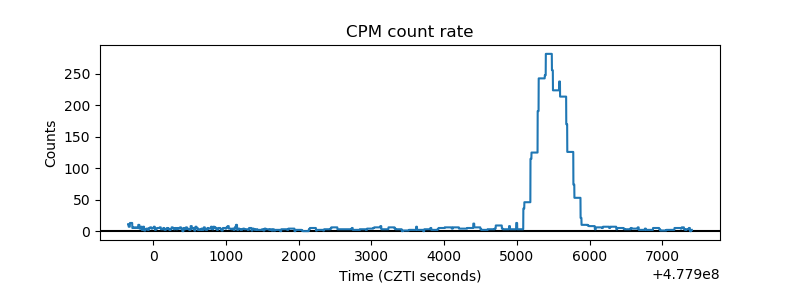 |
| CZT Counter | 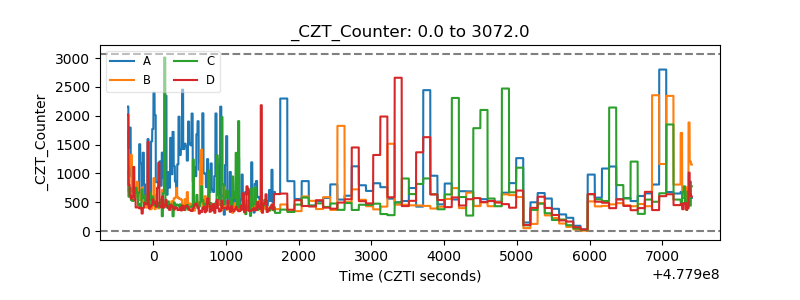 |
| +2.5 Volts monitor | 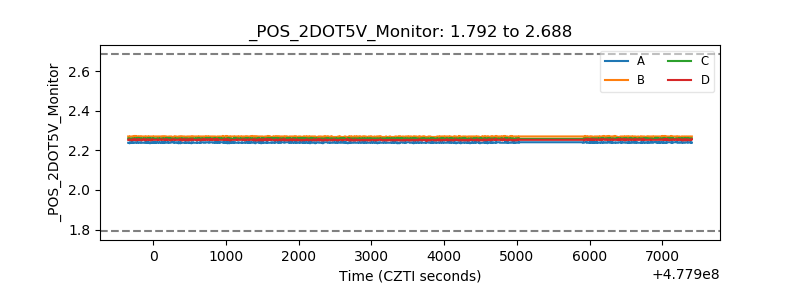 |
| +5 Volts monitor |  |
| _ROLL_ROT | 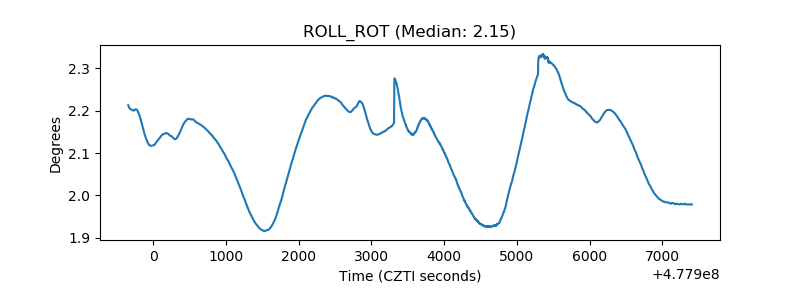 |
| _Roll_DEC | 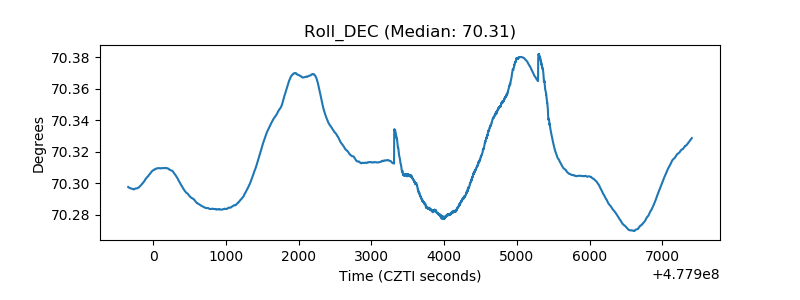 |
| _Roll_RA | 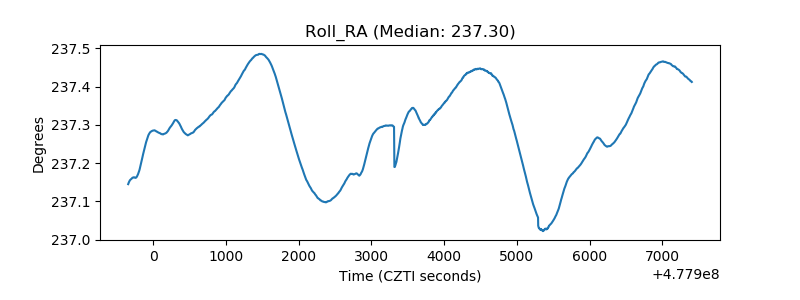 |
| Veto Counter | 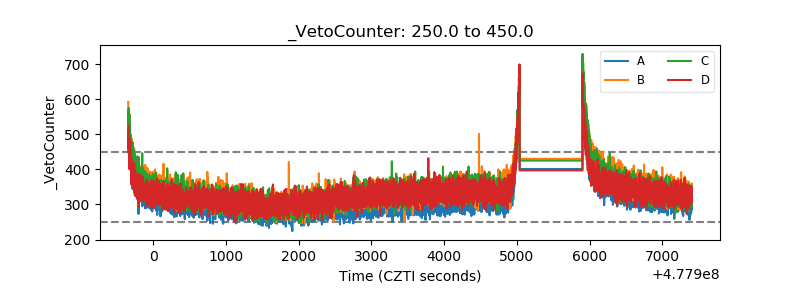 |