| Param | Original file | Final file |
|---|---|---|
| Filename | modeM0/AS1C07_001T01_9000006450_50868cztM0_level2.fits | modeM0/AS1C07_001T01_9000006450_50868cztM0_level2_quad_clean.evt |
| Size (bytes) | 530,208,000 | 82,419,840 |
| Size | 505.6 MB | 78.6 MB |
| Events in quadrant A | 4,990,420 | 549,423 |
| Events in quadrant B | 6,182,065 | 507,981 |
| Events in quadrant C | 4,207,568 | 521,613 |
| Events in quadrant D | 3,783,921 | 500,369 |
| Mode SS | |||
|---|---|---|---|
| Quadrant | BADHDUFLAG | Total packets | Discarded packets |
| A | 0 | 120 | 0 |
| B | 0 | 120 | 0 |
| C | 0 | 120 | 0 |
| D | 0 | 120 | 0 |
| Mode M0 | |||
|---|---|---|---|
| Quadrant | BADHDUFLAG | Total packets | Discarded packets |
| A | 0 | 19067 | 1 |
| B | 0 | 22467 | 1 |
| C | 0 | 16524 | 6 |
| D | 0 | 15305 | 1 |
| Mode M9 | |||
|---|---|---|---|
| Quadrant | BADHDUFLAG | Total packets | Discarded packets |
| A | 0 | 10 | 0 |
| B | 0 | 10 | 0 |
| C | 0 | 10 | 0 |
| D | 0 | 10 | 0 |
| Quadrant | Total seconds | Saturated seconds | Saturation percentage |
|---|---|---|---|
| A | 5959 | 307 | 5.151871% |
| B | 5960 | 1299 | 21.795302% |
| C | 5959 | 367 | 6.158751% |
| D | 5959 | 198 | 3.322705% |
Noise dominated data is calculated using 1-second bins in cleaned event files. If a bin has >2000 counts, and if more than 50% of those come from <1% of pixels, then it is considered to be noise-dominated and hence unusable.
| Quadrant | # 1 sec bins | Bins with >0 counts | Bins with >2000 counts | High rate bins dominated by noise | Noise dominated (total time) | Noise dominated (detector-on time) | Marked lightcurve |
|---|---|---|---|---|---|---|---|
| A | 6969 | 5959 | 227 | 227 | 3.26% | 3.81% | 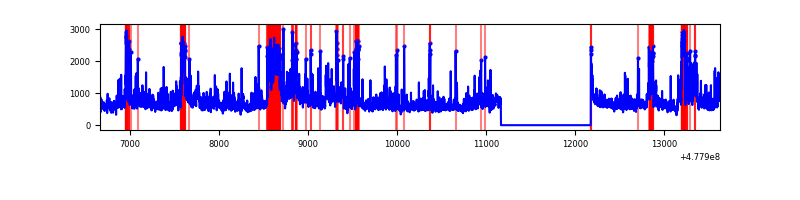 |
| B | 6970 | 5960 | 967 | 967 | 13.87% | 16.22% | 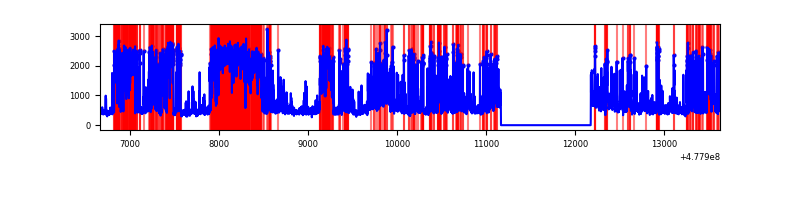 |
| C | 6969 | 5959 | 290 | 290 | 4.16% | 4.87% | 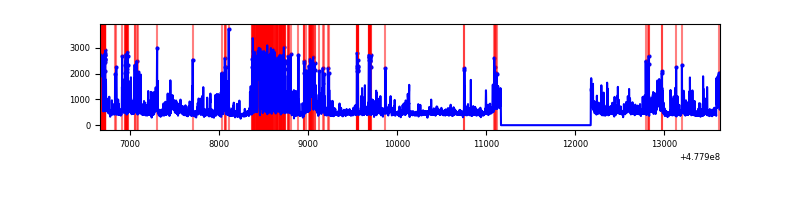 |
| D | 6969 | 5959 | 141 | 141 | 2.02% | 2.37% | 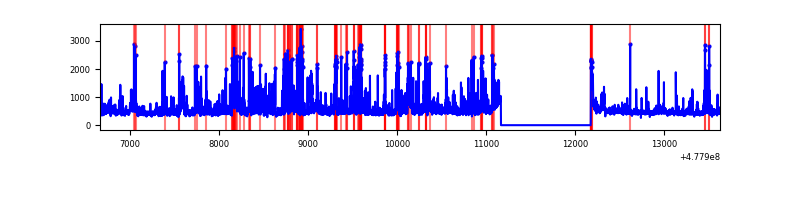 |
Top three noisy pixels from each quadrant. If the there are fewer than three noisy pixels in the level2.evt file, extra rows are filled as -1
| Pixel properties | Quadrant properties | ||||||
|---|---|---|---|---|---|---|---|
| Quadrant | DetID | PixID | Counts | Sigma | Mean | Median | Sigma |
| A | 4 | 4 | 968638 | 6230.86 | 624 | 609 | 155.4 |
| A | 8 | 234 | 451694 | 2903.47 | 624 | 609 | 155.4 |
| A | 4 | 191 | 152368 | 976.82 | 624 | 609 | 155.4 |
| B | 4 | 206 | 2753012 | 22622.83 | 576 | 557 | 121.7 |
| B | 4 | 170 | 783452 | 6434.73 | 576 | 557 | 121.7 |
| B | 8 | 128 | 65595 | 534.56 | 576 | 557 | 121.7 |
| C | 13 | 3 | 857799 | 5226.45 | 596 | 591 | 164.0 |
| C | 1 | 29 | 259592 | 1579.15 | 596 | 591 | 164.0 |
| C | 15 | 229 | 143286 | 870.02 | 596 | 591 | 164.0 |
| D | 2 | 249 | 354177 | 2114.78 | 604 | 581 | 167.2 |
| D | 15 | 108 | 159041 | 947.72 | 604 | 581 | 167.2 |
| D | 7 | 96 | 126636 | 753.91 | 604 | 581 | 167.2 |
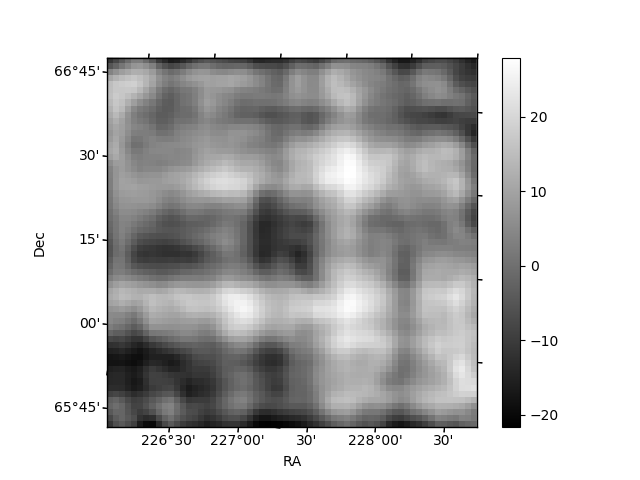
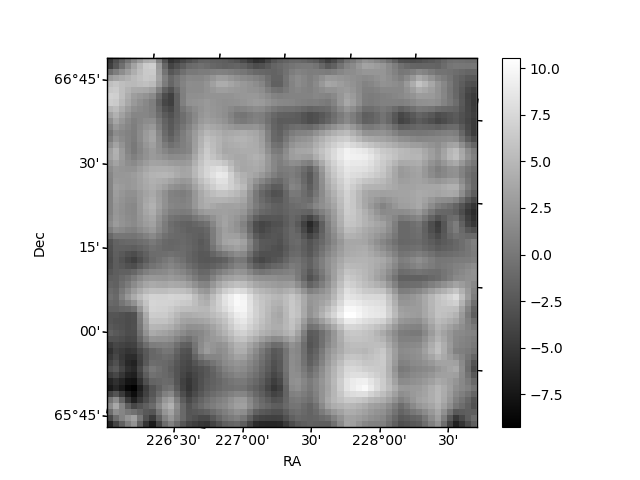
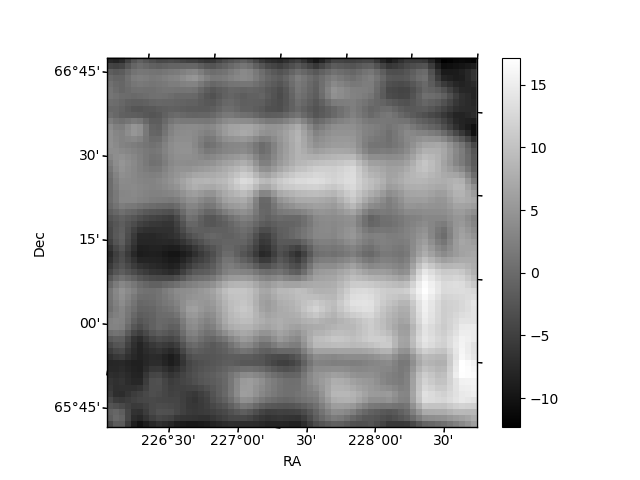
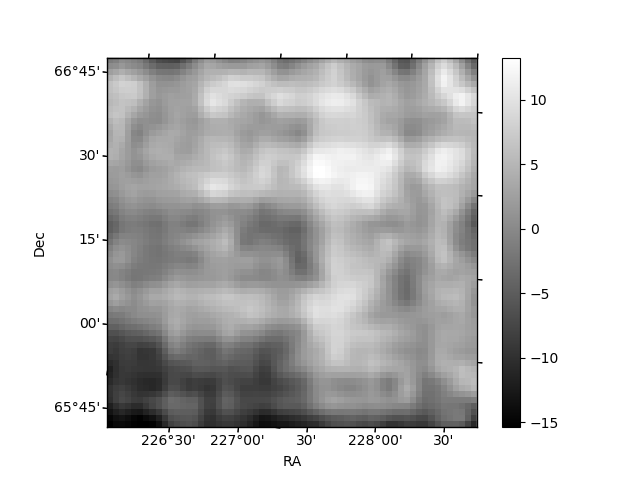
Histogram calculated using DETX and DETY for each event in the final _common_clean file
| Quadrant A | 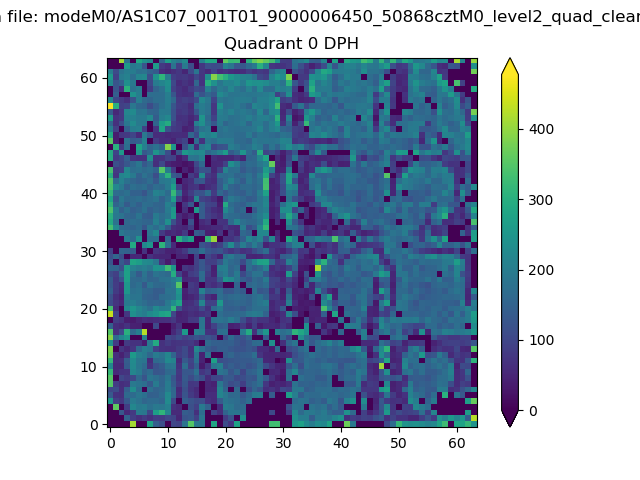 |
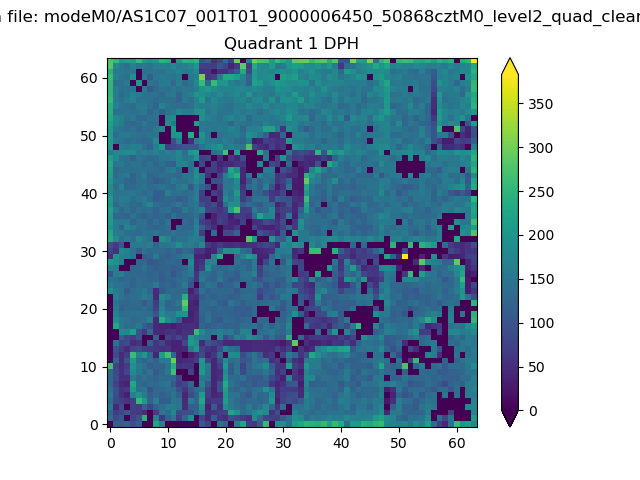 |
Quadrant B |
|---|---|---|---|
| Quadrant D | 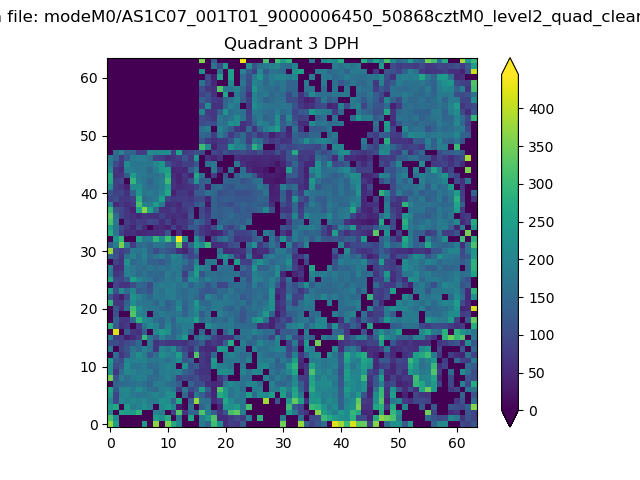 |
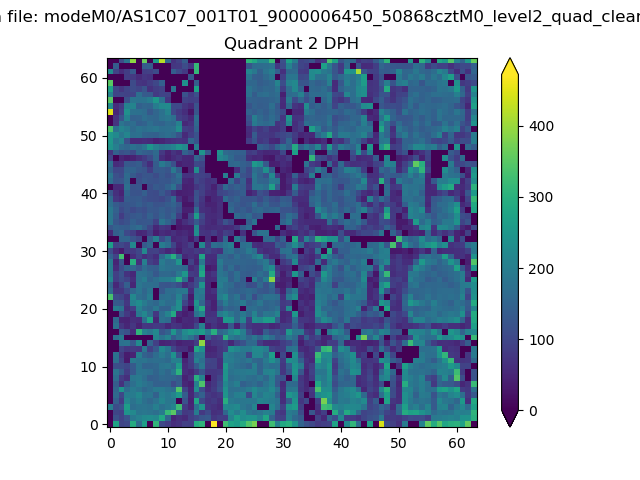 |
Quadrant C |
| Plot type | Count rate plots | Images |
|---|---|---|
| Comparison with Poisson distribution Blue bars denote a histogram of data divided into 1 sec bins. Red curve is a Poisson curve with rate = median count rate of data. |
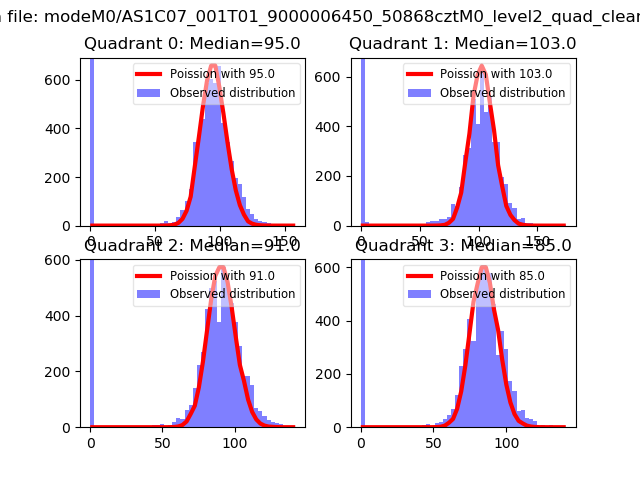 |
 |
| Quadrant-wise count rates Data is divided into 100 sec bins |
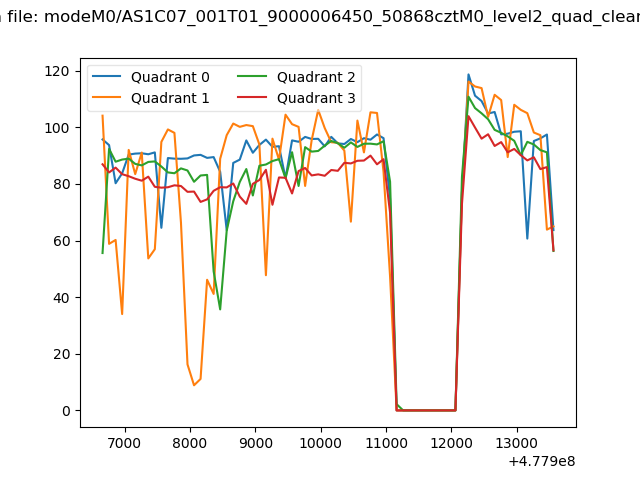 |
|
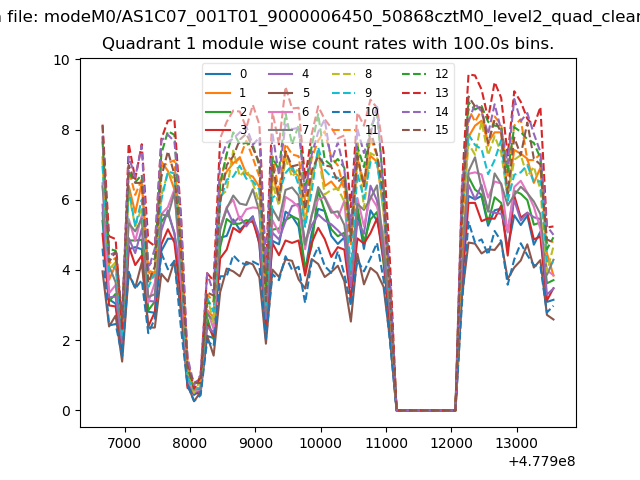
| Module-wise count rates for Quadrant A Data is divided into 100 sec bins |
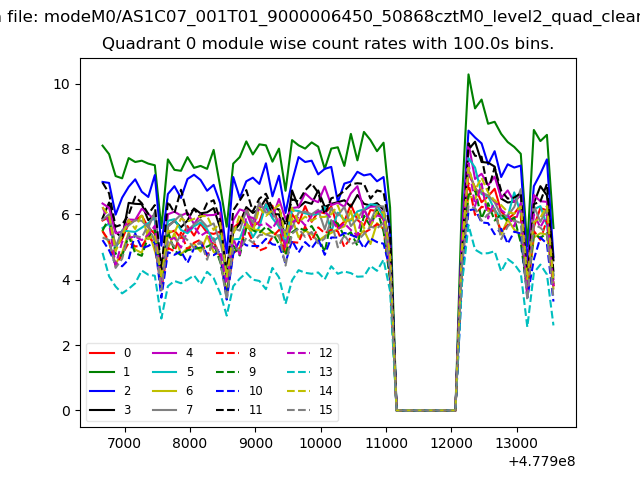 |
 |
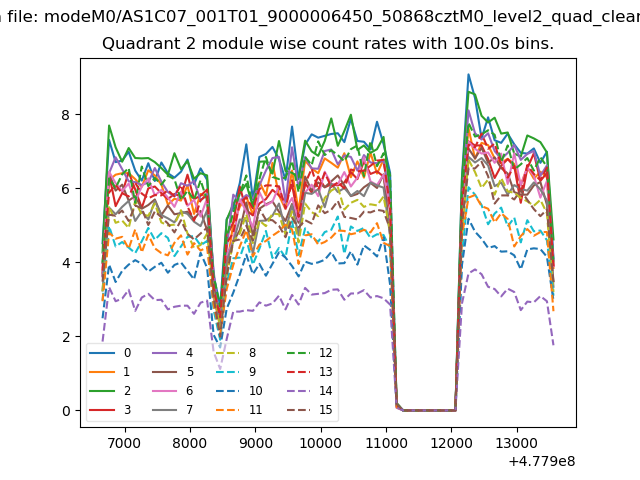
| Module-wise count rates for Quadrant B Data is divided into 100 sec bins |
 |
 |
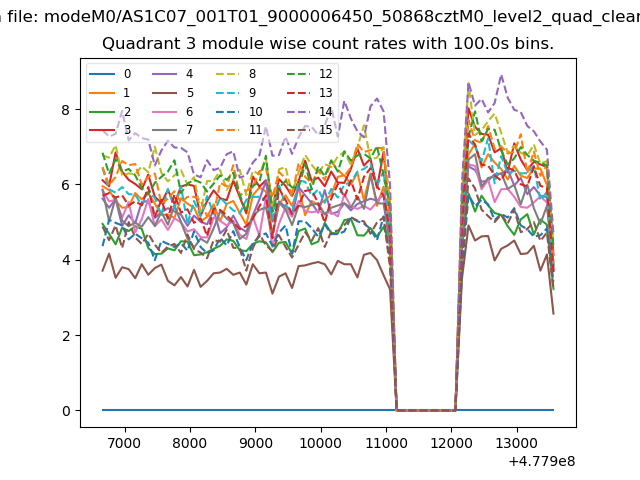
| Module-wise count rates for Quadrant C Data is divided into 100 sec bins |
 |
 |
| Module-wise count rates for Quadrant D Data is divided into 100 sec bins |
 |
 |
| Parameter | Plot |
|---|---|
| CZT HV Monitor | 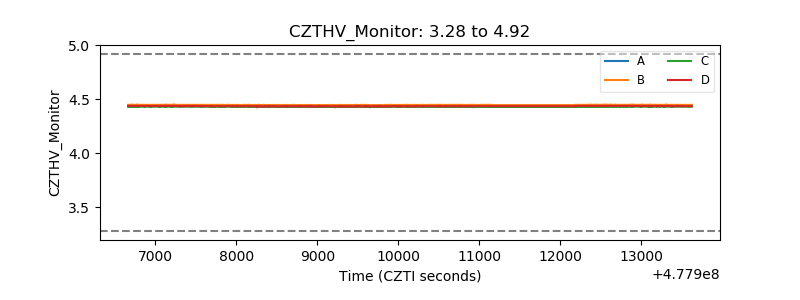 |
| D_VDD | 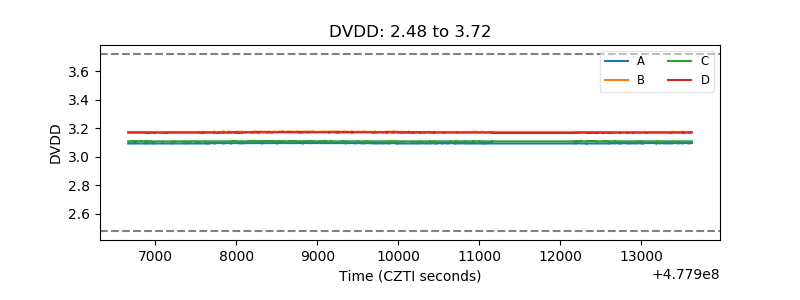 |
| Temperature 1 | 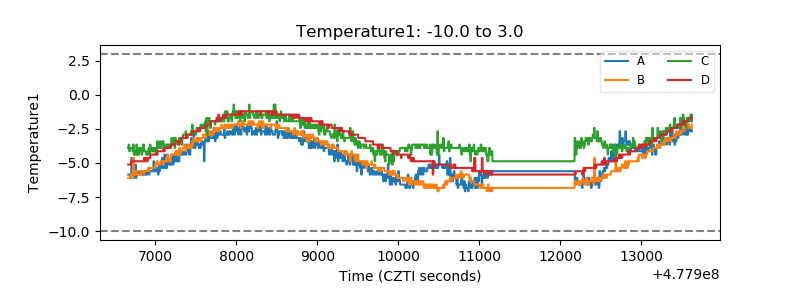 |
| Veto HV Monitor |  |
| Veto LLD | 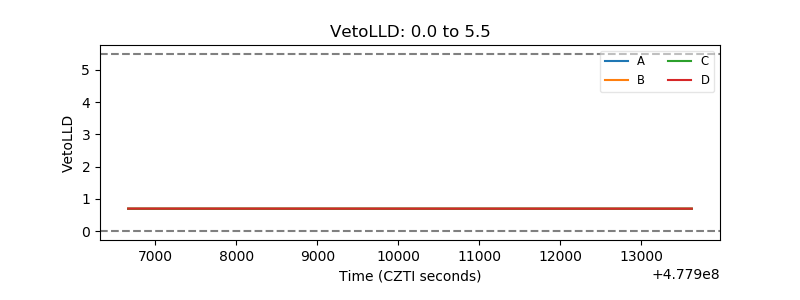 |
| Alpha Counter | 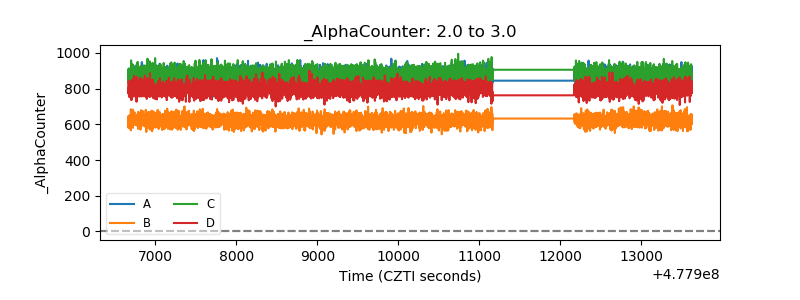 |
| _CPM_Rate | 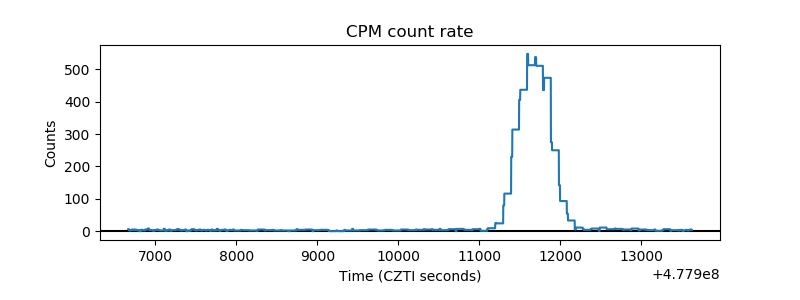 |
| CZT Counter | 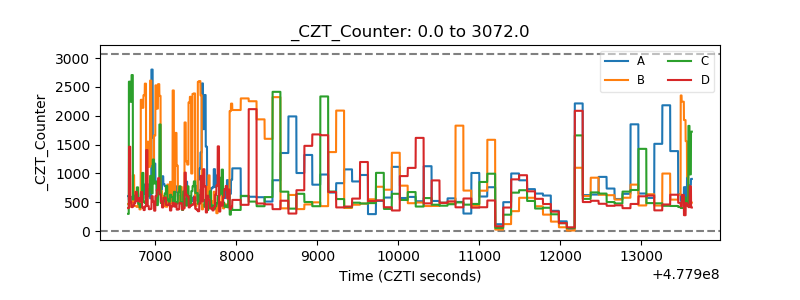 |
| +2.5 Volts monitor | 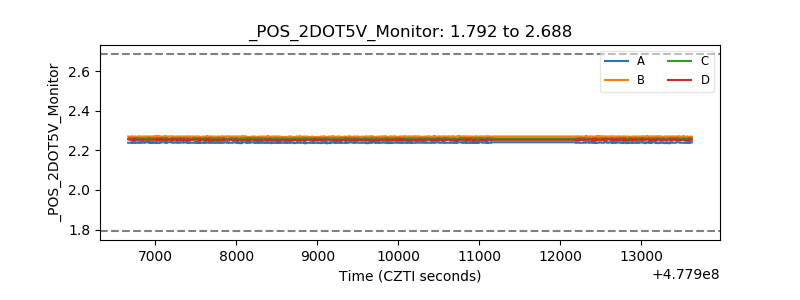 |
| +5 Volts monitor | 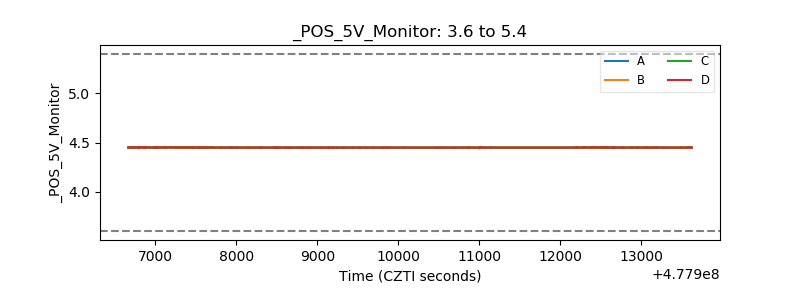 |
| _ROLL_ROT | 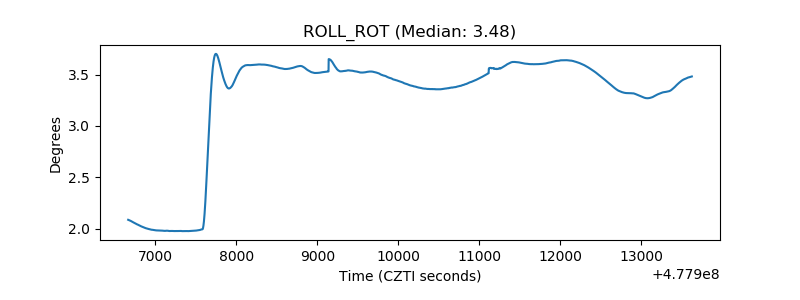 |
| _Roll_DEC | 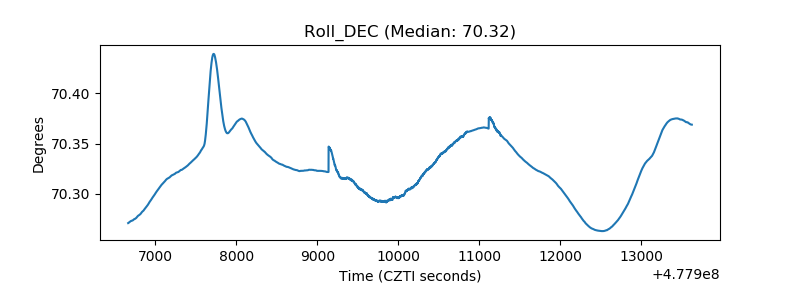 |
| _Roll_RA | 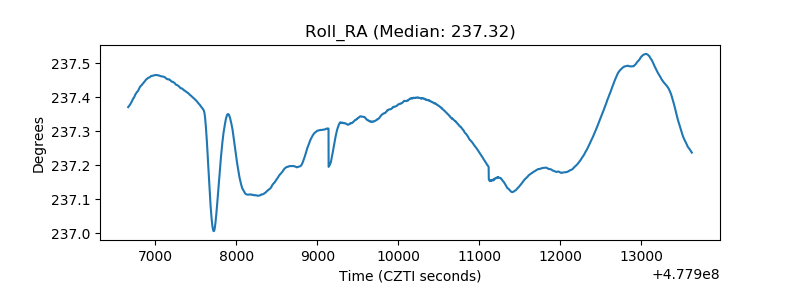 |
| Veto Counter | 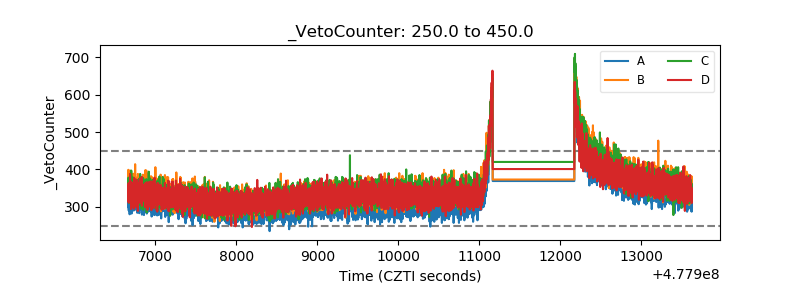 |