| Param | Original file | Final file |
|---|---|---|
| Filename | modeM0/AS1C07_001T01_9000006450_50869cztM0_level2.fits | modeM0/AS1C07_001T01_9000006450_50869cztM0_level2_quad_clean.evt |
| Size (bytes) | 578,741,760 | 85,893,120 |
| Size | 551.9 MB | 81.9 MB |
| Events in quadrant A | 6,968,471 | 544,760 |
| Events in quadrant B | 5,430,489 | 569,294 |
| Events in quadrant C | 4,410,472 | 546,709 |
| Events in quadrant D | 4,148,233 | 520,004 |
| Mode SS | |||
|---|---|---|---|
| Quadrant | BADHDUFLAG | Total packets | Discarded packets |
| A | 0 | 122 | 0 |
| B | 0 | 122 | 0 |
| C | 0 | 122 | 0 |
| D | 0 | 122 | 0 |
| Mode M0 | |||
|---|---|---|---|
| Quadrant | BADHDUFLAG | Total packets | Discarded packets |
| A | 0 | 25030 | 1 |
| B | 0 | 20165 | 1 |
| C | 0 | 17177 | 1 |
| D | 0 | 16375 | 1 |
| Mode M9 | |||
|---|---|---|---|
| Quadrant | BADHDUFLAG | Total packets | Discarded packets |
| A | 0 | 11 | 0 |
| B | 0 | 11 | 0 |
| C | 0 | 11 | 0 |
| D | 0 | 11 | 0 |
| Quadrant | Total seconds | Saturated seconds | Saturation percentage |
|---|---|---|---|
| A | 6009 | 710 | 11.815610% |
| B | 6009 | 864 | 14.378432% |
| C | 6010 | 300 | 4.991681% |
| D | 6010 | 213 | 3.544093% |
Noise dominated data is calculated using 1-second bins in cleaned event files. If a bin has >2000 counts, and if more than 50% of those come from <1% of pixels, then it is considered to be noise-dominated and hence unusable.
| Quadrant | # 1 sec bins | Bins with >0 counts | Bins with >2000 counts | High rate bins dominated by noise | Noise dominated (total time) | Noise dominated (detector-on time) | Marked lightcurve |
|---|---|---|---|---|---|---|---|
| A | 7099 | 6009 | 642 | 642 | 9.04% | 10.68% | 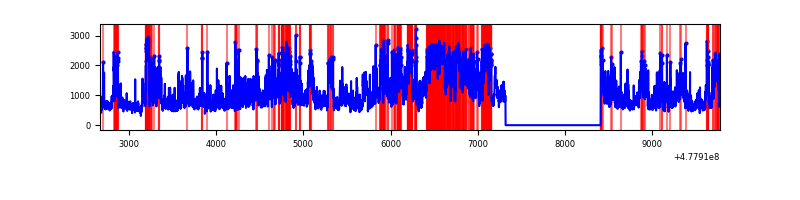 |
| B | 7099 | 6009 | 667 | 667 | 9.40% | 11.10% | 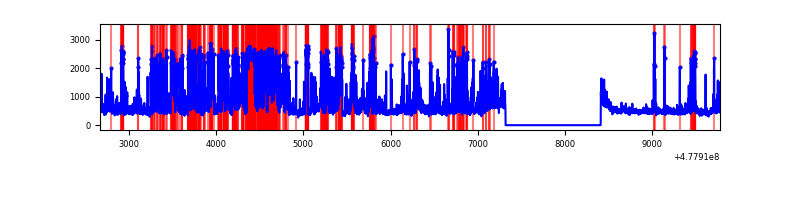 |
| C | 7100 | 6010 | 225 | 225 | 3.17% | 3.74% | 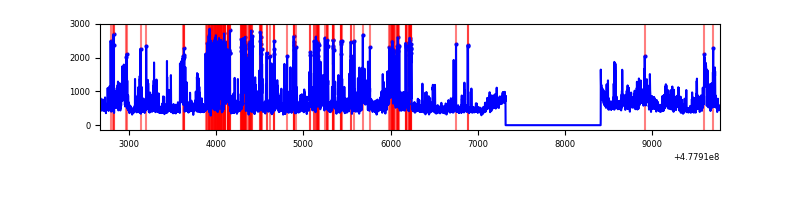 |
| D | 7100 | 6010 | 185 | 185 | 2.61% | 3.08% | 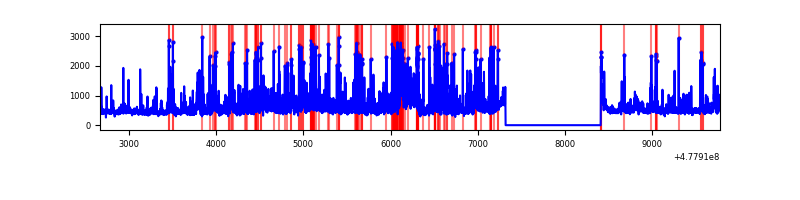 |
Top three noisy pixels from each quadrant. If the there are fewer than three noisy pixels in the level2.evt file, extra rows are filled as -1
| Pixel properties | Quadrant properties | ||||||
|---|---|---|---|---|---|---|---|
| Quadrant | DetID | PixID | Counts | Sigma | Mean | Median | Sigma |
| A | 4 | 4 | 3064138 | 19307.19 | 634 | 618 | 158.7 |
| A | 8 | 234 | 274115 | 1723.66 | 634 | 618 | 158.7 |
| A | 4 | 3 | 186598 | 1172.1 | 634 | 618 | 158.7 |
| B | 4 | 206 | 2358168 | 18086.54 | 614 | 594 | 130.3 |
| B | 8 | 128 | 153305 | 1171.55 | 614 | 594 | 130.3 |
| B | 0 | 213 | 112323 | 857.15 | 614 | 594 | 130.3 |
| C | 1 | 29 | 615127 | 3637.77 | 620 | 615 | 168.9 |
| C | 15 | 231 | 302942 | 1789.71 | 620 | 615 | 168.9 |
| C | 15 | 229 | 250110 | 1476.95 | 620 | 615 | 168.9 |
| D | 2 | 249 | 250293 | 1433.92 | 624 | 600 | 174.1 |
| D | 15 | 108 | 226886 | 1299.5 | 624 | 600 | 174.1 |
| D | 8 | 176 | 209899 | 1201.95 | 624 | 600 | 174.1 |
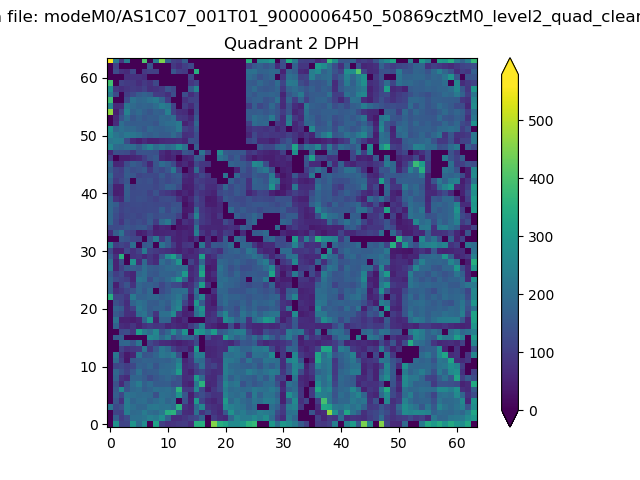
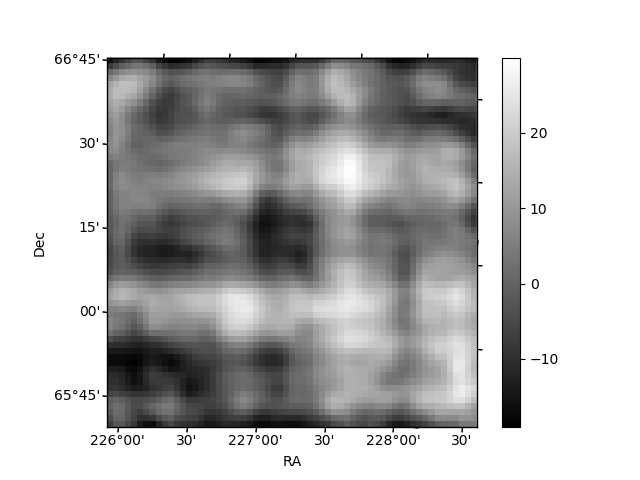
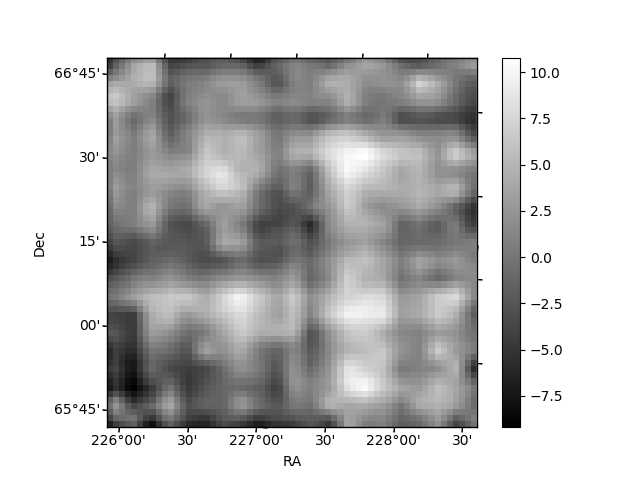
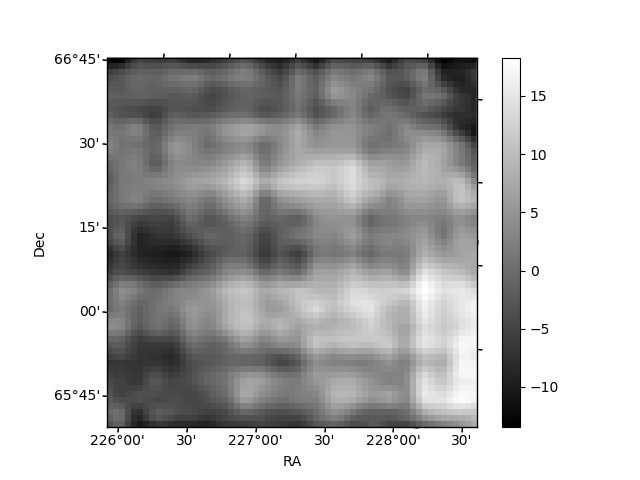
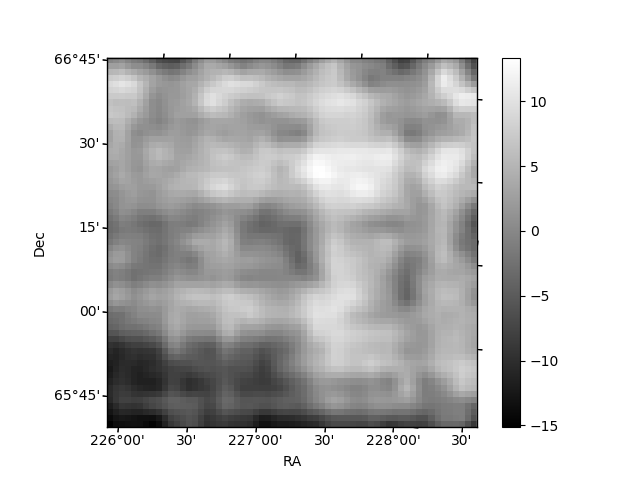
Histogram calculated using DETX and DETY for each event in the final _common_clean file
| Quadrant A | 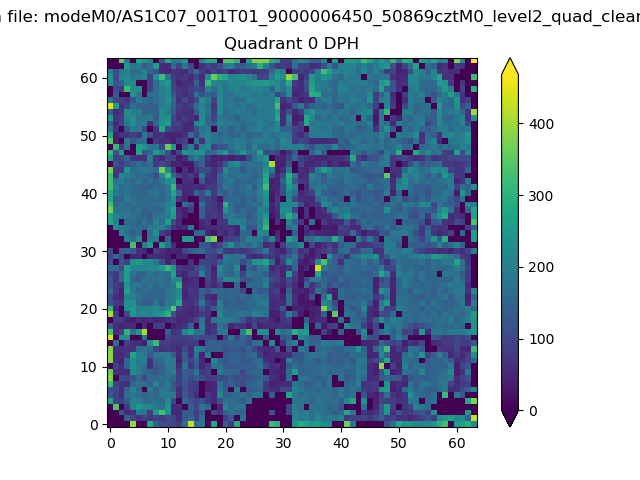 |
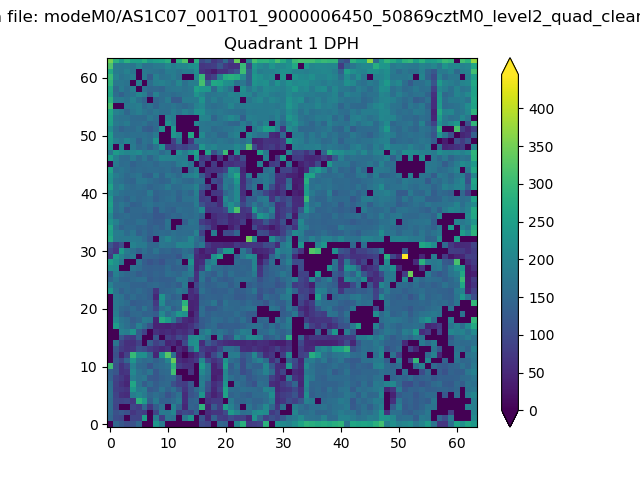 |
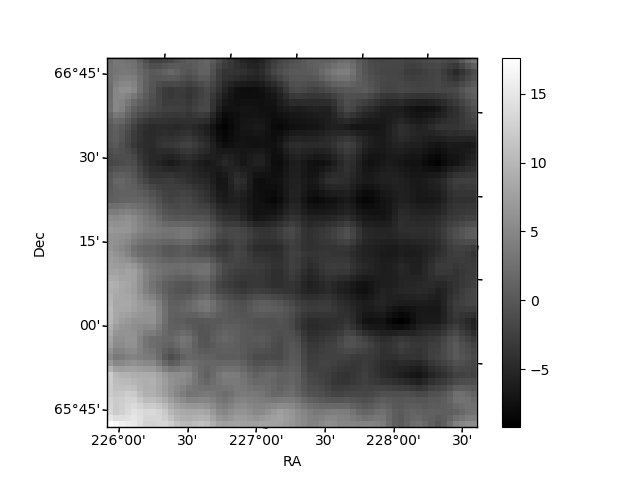
Quadrant B |
|---|---|---|---|
| Quadrant D | 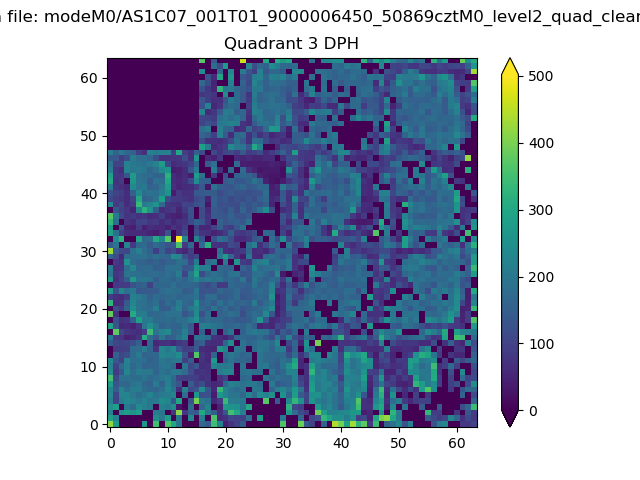 |
 |
Quadrant C |
| Plot type | Count rate plots | Images |
|---|---|---|
| Comparison with Poisson distribution Blue bars denote a histogram of data divided into 1 sec bins. Red curve is a Poisson curve with rate = median count rate of data. |
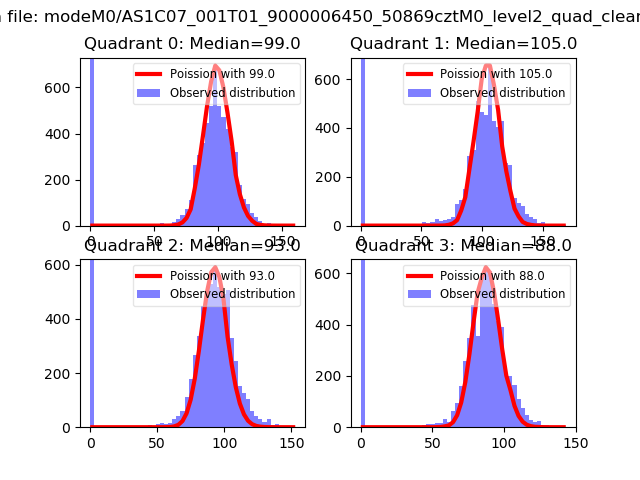 |
 |
| Quadrant-wise count rates Data is divided into 100 sec bins |
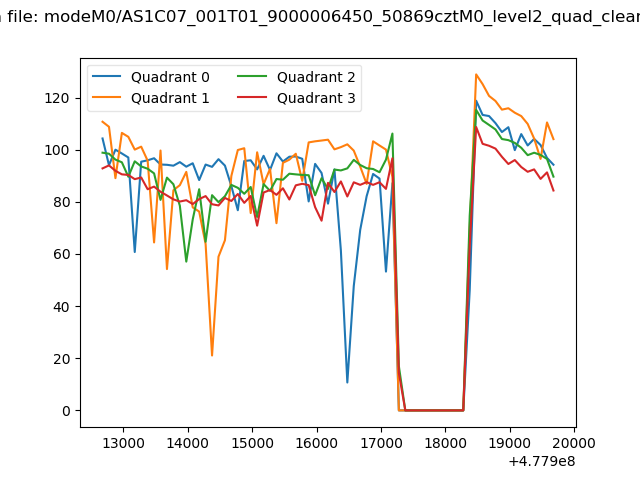 |
|
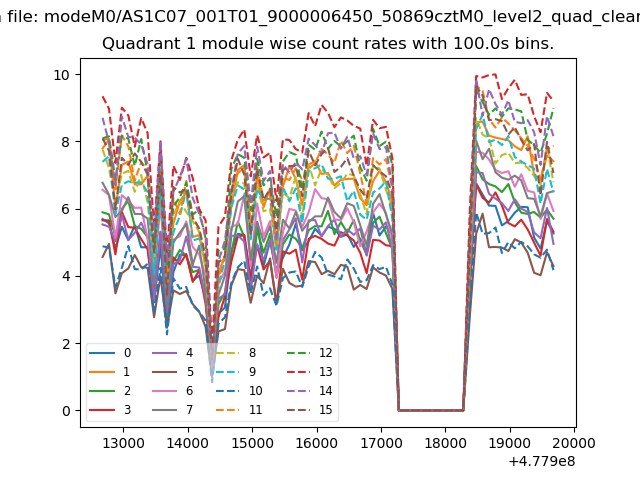
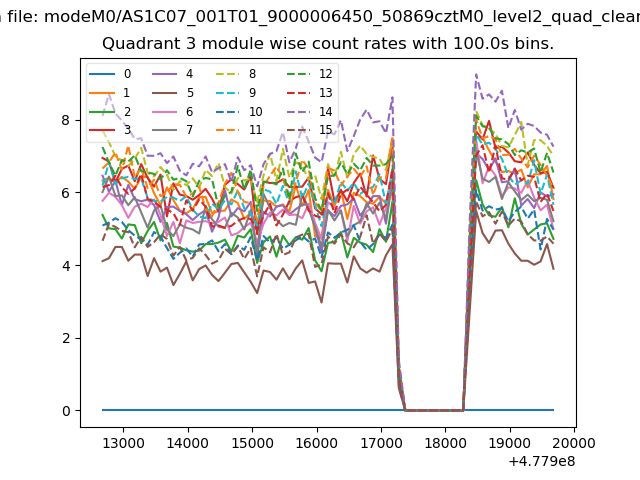
| Module-wise count rates for Quadrant A Data is divided into 100 sec bins |
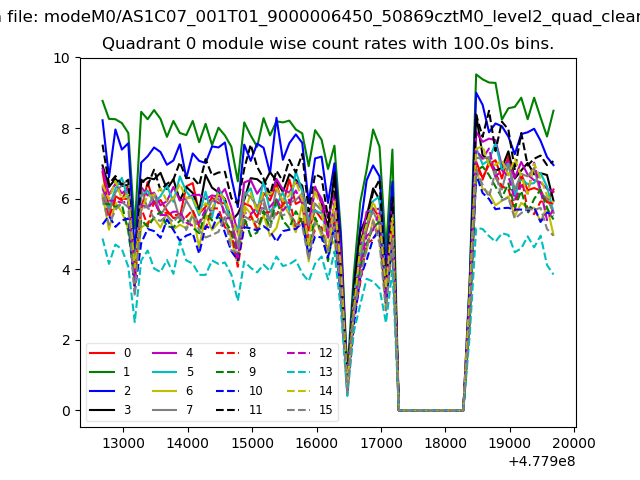 |
 |
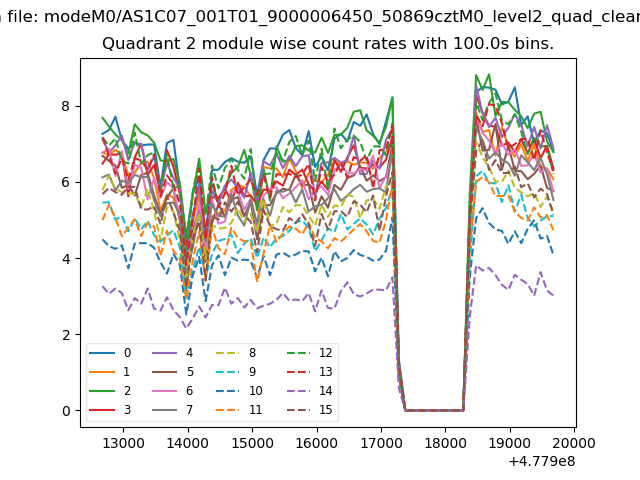
| Module-wise count rates for Quadrant B Data is divided into 100 sec bins |
 |
 |
| Module-wise count rates for Quadrant C Data is divided into 100 sec bins |
 |
 |
| Module-wise count rates for Quadrant D Data is divided into 100 sec bins |
 |
 |
| Parameter | Plot |
|---|---|
| CZT HV Monitor | 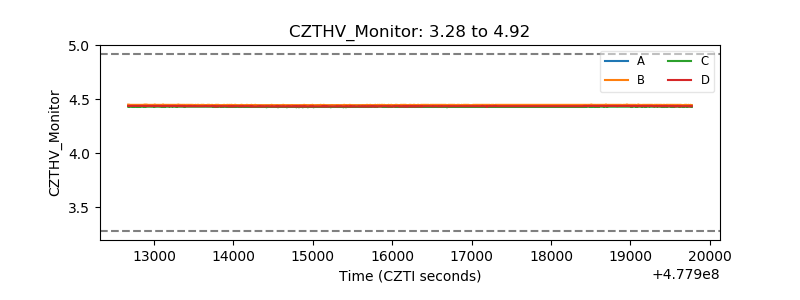 |
| D_VDD | 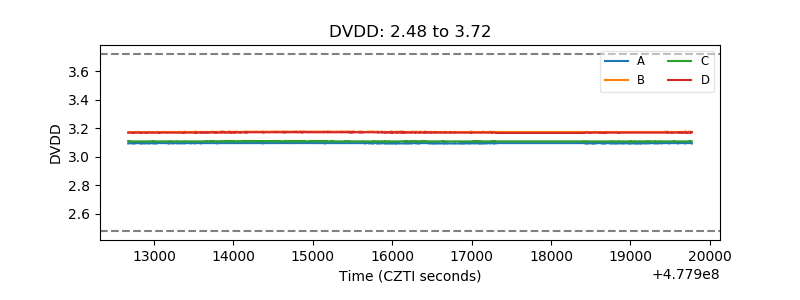 |
| Temperature 1 | 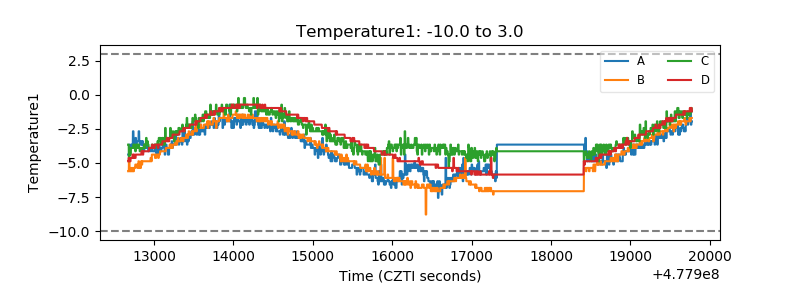 |
| Veto HV Monitor | 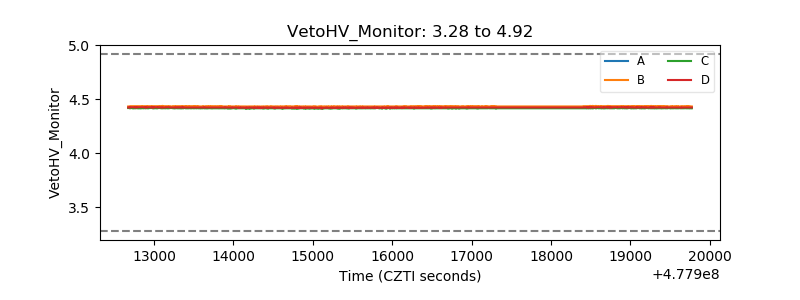 |
| Veto LLD | 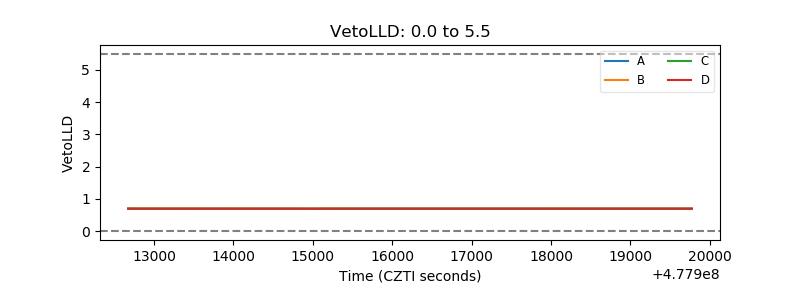 |
| Alpha Counter | 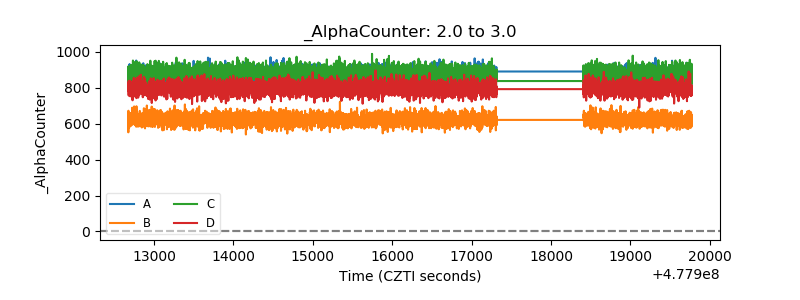 |
| _CPM_Rate | 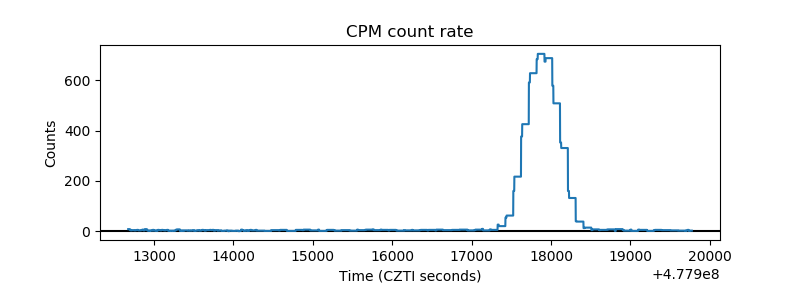 |
| CZT Counter | 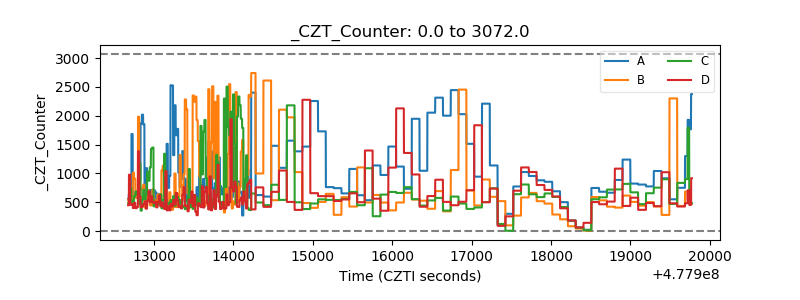 |
| +2.5 Volts monitor | 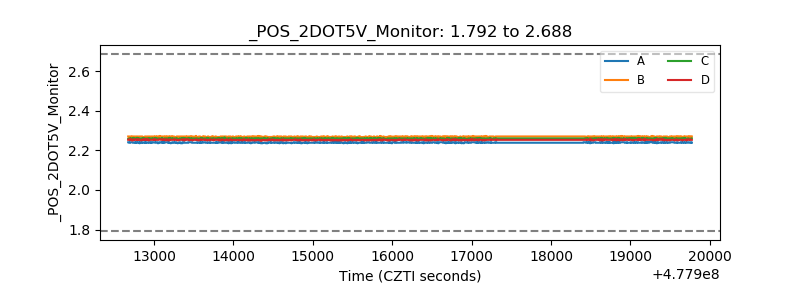 |
| +5 Volts monitor | 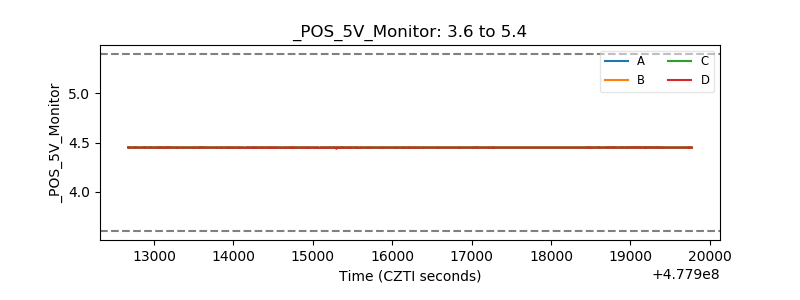 |
| _ROLL_ROT | 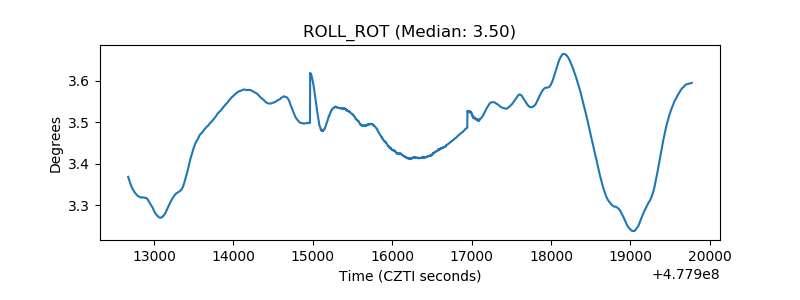 |
| _Roll_DEC | 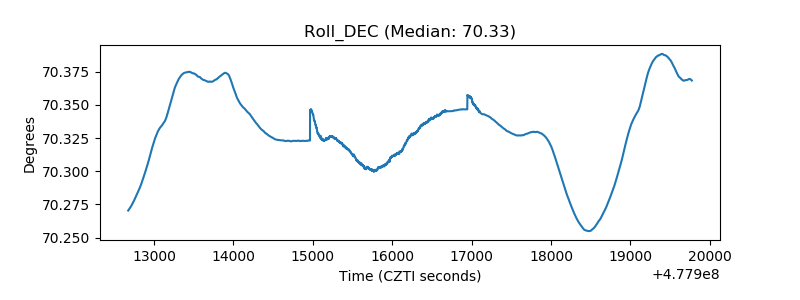 |
| _Roll_RA | 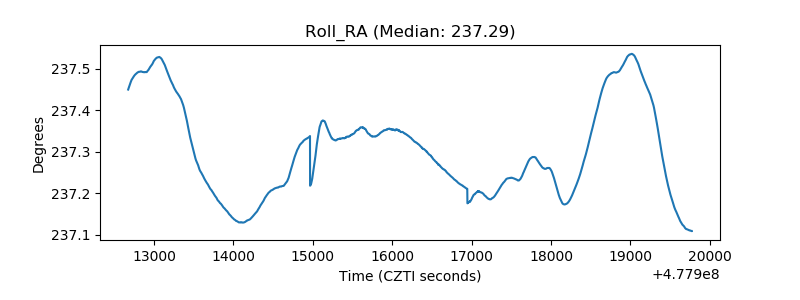 |
| Veto Counter | 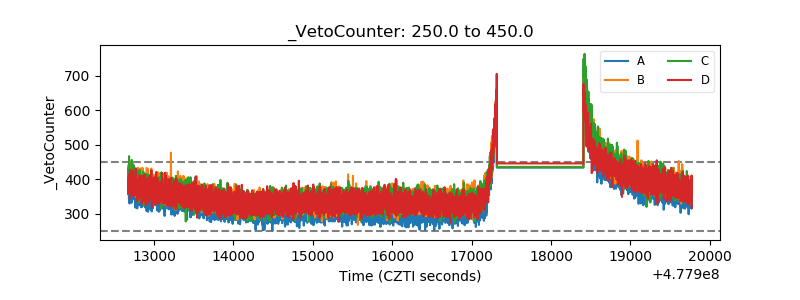 |