| Param | Original file | Final file |
|---|---|---|
| Filename | modeM0/AS1C07_001T01_9000006450_50870cztM0_level2.fits | modeM0/AS1C07_001T01_9000006450_50870cztM0_level2_quad_clean.evt |
| Size (bytes) | 634,354,560 | 94,057,920 |
| Size | 605.0 MB | 89.7 MB |
| Events in quadrant A | 8,311,612 | 559,994 |
| Events in quadrant B | 3,717,512 | 699,299 |
| Events in quadrant C | 5,859,605 | 573,425 |
| Events in quadrant D | 5,089,226 | 560,938 |
| Mode SS | |||
|---|---|---|---|
| Quadrant | BADHDUFLAG | Total packets | Discarded packets |
| A | 0 | 134 | 0 |
| B | 0 | 134 | 0 |
| C | 0 | 134 | 0 |
| D | 0 | 134 | 0 |
| Mode M0 | |||
|---|---|---|---|
| Quadrant | BADHDUFLAG | Total packets | Discarded packets |
| A | 0 | 29394 | 1 |
| B | 0 | 15354 | 1 |
| C | 0 | 21911 | 1 |
| D | 0 | 19446 | 1 |
| Mode M9 | |||
|---|---|---|---|
| Quadrant | BADHDUFLAG | Total packets | Discarded packets |
| A | 0 | 11 | 0 |
| B | 0 | 11 | 0 |
| C | 0 | 11 | 0 |
| D | 0 | 11 | 0 |
| Quadrant | Total seconds | Saturated seconds | Saturation percentage |
|---|---|---|---|
| A | 6507 | 1222 | 18.779776% |
| B | 6507 | 208 | 3.196558% |
| C | 6507 | 668 | 10.265868% |
| D | 6508 | 390 | 5.992624% |
Noise dominated data is calculated using 1-second bins in cleaned event files. If a bin has >2000 counts, and if more than 50% of those come from <1% of pixels, then it is considered to be noise-dominated and hence unusable.
| Quadrant | # 1 sec bins | Bins with >0 counts | Bins with >2000 counts | High rate bins dominated by noise | Noise dominated (total time) | Noise dominated (detector-on time) | Marked lightcurve |
|---|---|---|---|---|---|---|---|
| A | 7651 | 6506 | 1125 | 1125 | 14.70% | 17.29% | 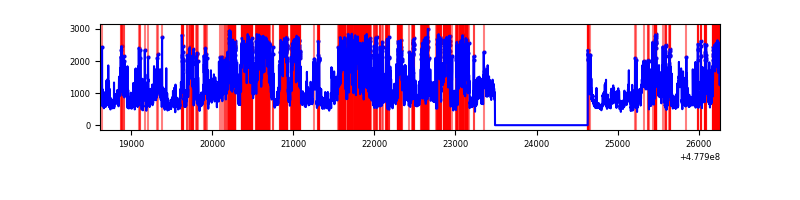 |
| B | 7652 | 6507 | 114 | 114 | 1.49% | 1.75% | 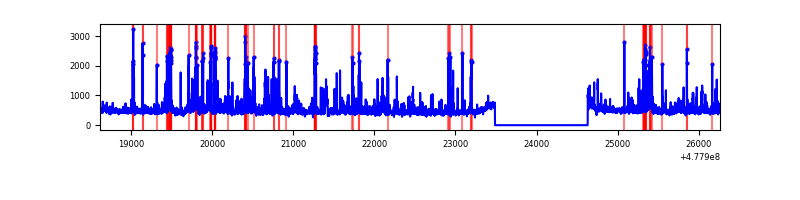 |
| C | 7652 | 6507 | 559 | 559 | 7.31% | 8.59% | 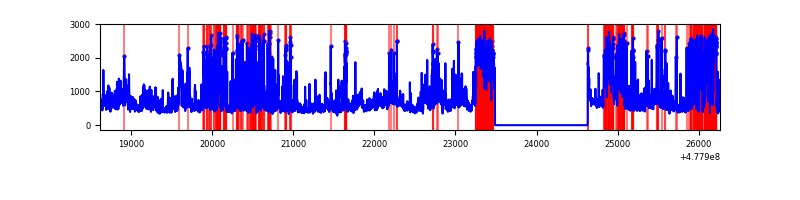 |
| D | 7653 | 6508 | 331 | 331 | 4.33% | 5.09% | 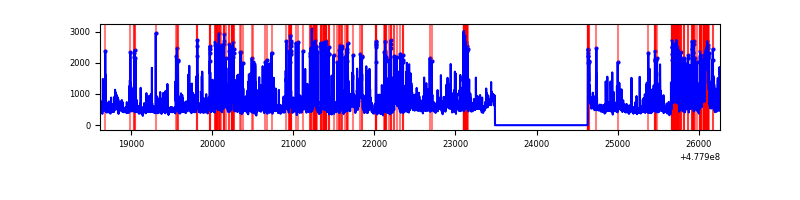 |
Top three noisy pixels from each quadrant. If the there are fewer than three noisy pixels in the level2.evt file, extra rows are filled as -1
| Pixel properties | Quadrant properties | ||||||
|---|---|---|---|---|---|---|---|
| Quadrant | DetID | PixID | Counts | Sigma | Mean | Median | Sigma |
| A | 4 | 4 | 3439310 | 20369.36 | 679 | 662 | 168.8 |
| A | 7 | 206 | 1093176 | 6471.67 | 679 | 662 | 168.8 |
| A | 8 | 234 | 247842 | 1464.21 | 679 | 662 | 168.8 |
| B | 4 | 206 | 176585 | 1184.78 | 706 | 683 | 148.5 |
| B | 0 | 213 | 147350 | 987.87 | 706 | 683 | 148.5 |
| B | 4 | 81 | 118179 | 791.39 | 706 | 683 | 148.5 |
| C | 1 | 29 | 1335891 | 7299.69 | 664 | 657 | 182.9 |
| C | 3 | 233 | 714093 | 3900.34 | 664 | 657 | 182.9 |
| C | 13 | 96 | 281216 | 1533.81 | 664 | 657 | 182.9 |
| D | 2 | 249 | 524134 | 2743.99 | 682 | 660 | 190.8 |
| D | 10 | 24 | 384091 | 2009.9 | 682 | 660 | 190.8 |
| D | 2 | 216 | 195265 | 1020.1 | 682 | 660 | 190.8 |
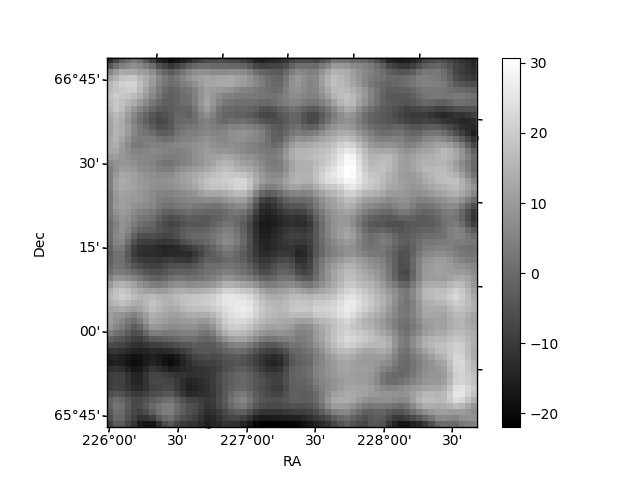
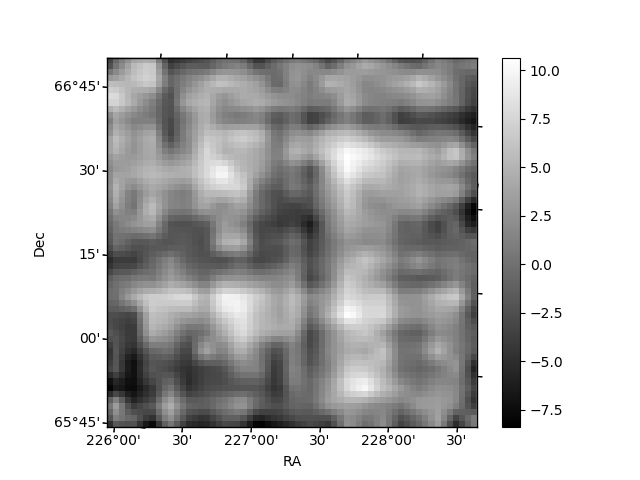
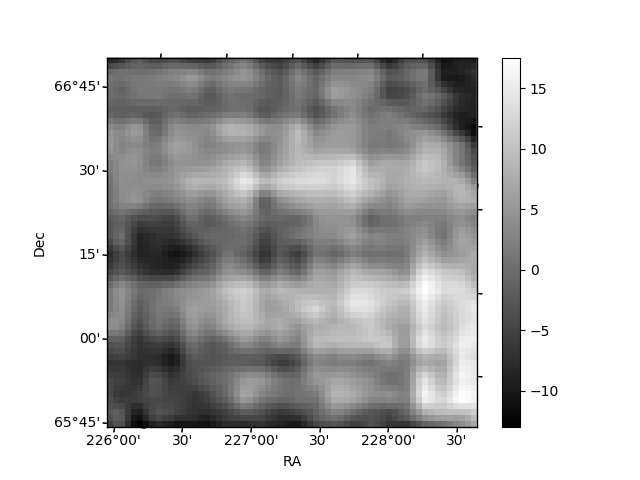
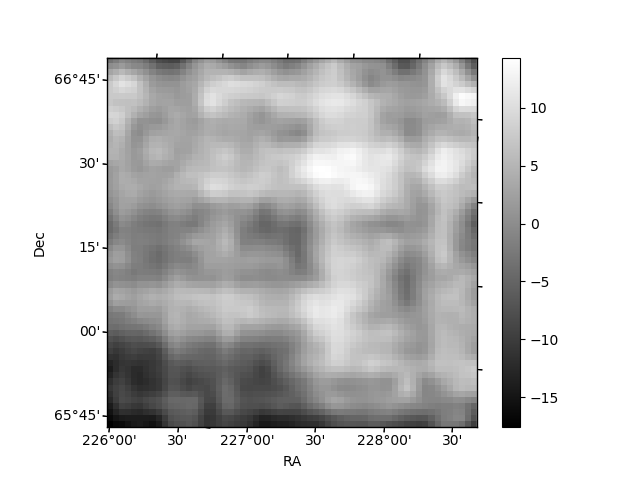
Histogram calculated using DETX and DETY for each event in the final _common_clean file
| Quadrant A | 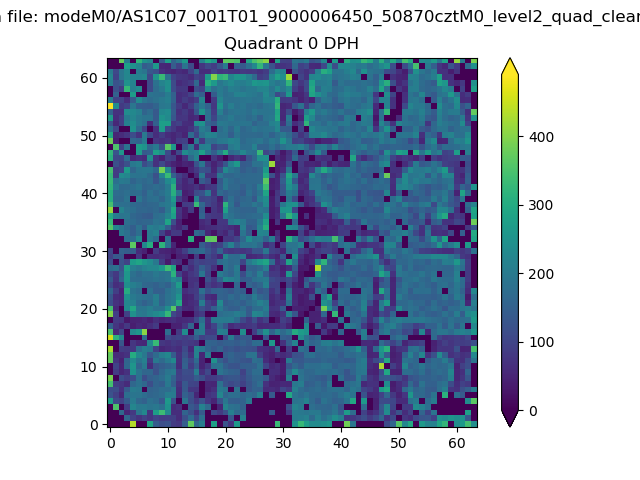 |
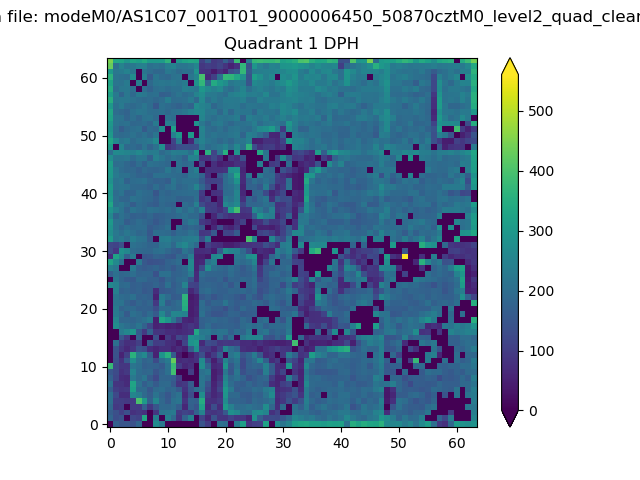 |
Quadrant B |
|---|---|---|---|
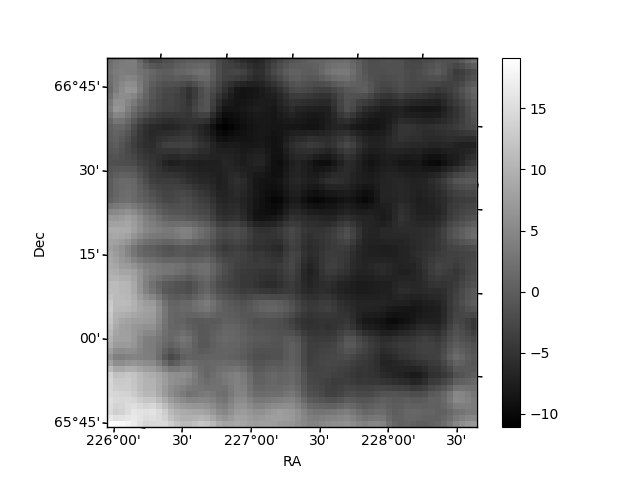
| Quadrant D | 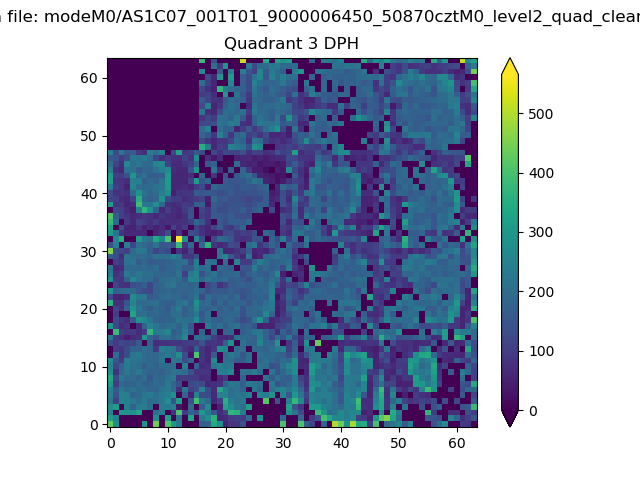 |
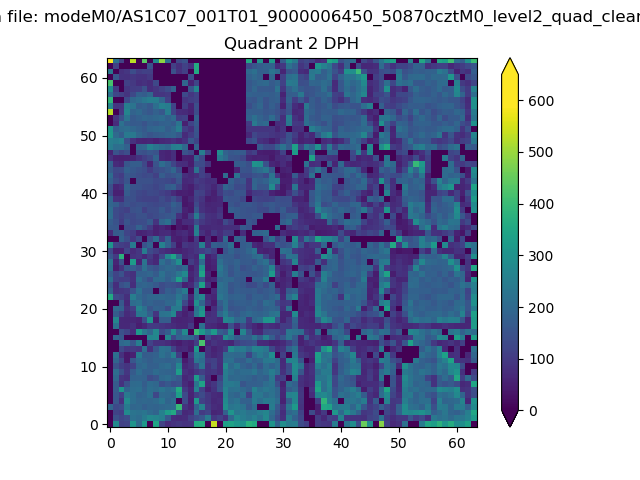 |
Quadrant C |
| Plot type | Count rate plots | Images |
|---|---|---|
| Comparison with Poisson distribution Blue bars denote a histogram of data divided into 1 sec bins. Red curve is a Poisson curve with rate = median count rate of data. |
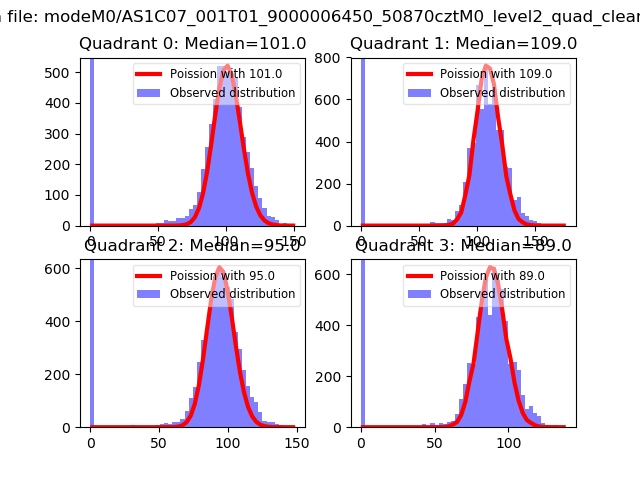 |
 |
| Quadrant-wise count rates Data is divided into 100 sec bins |
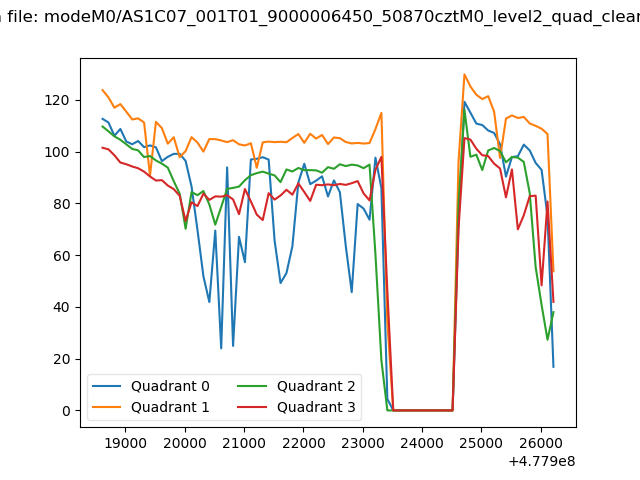 |
|
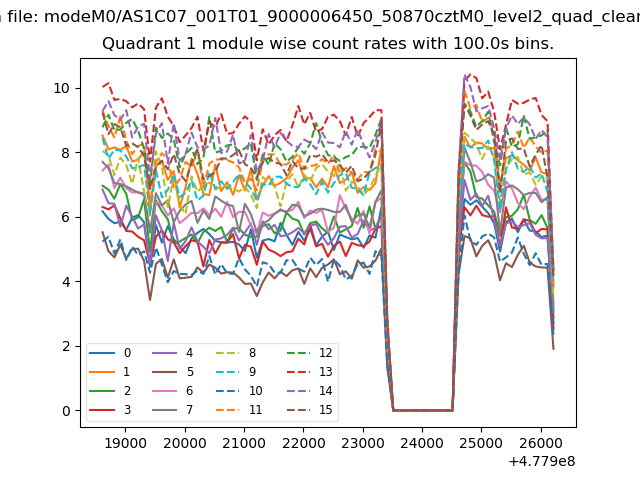
| Module-wise count rates for Quadrant A Data is divided into 100 sec bins |
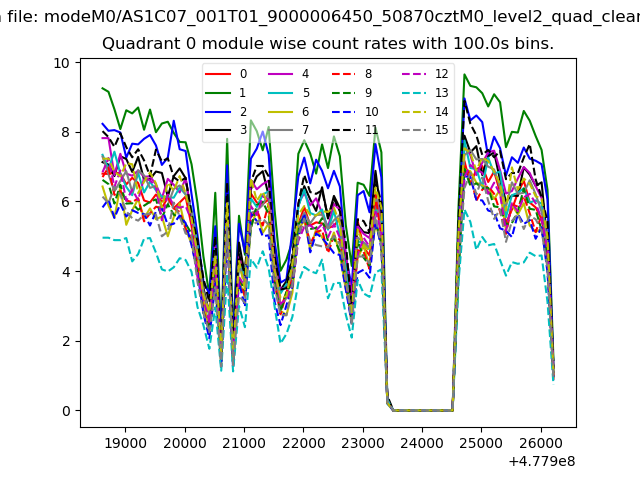 |
 |
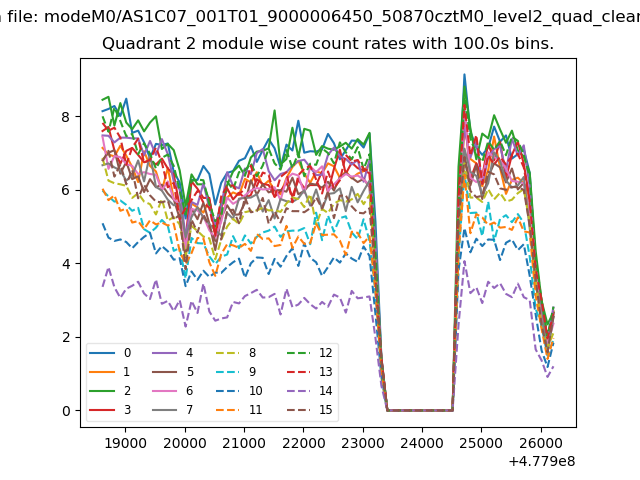
| Module-wise count rates for Quadrant B Data is divided into 100 sec bins |
 |
 |
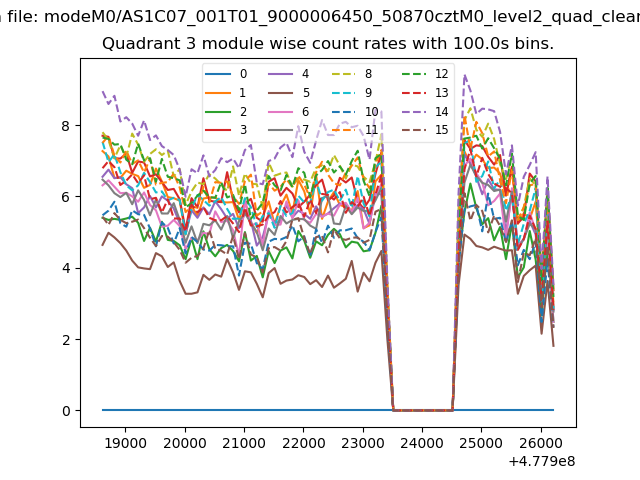
| Module-wise count rates for Quadrant C Data is divided into 100 sec bins |
 |
 |
| Module-wise count rates for Quadrant D Data is divided into 100 sec bins |
 |
 |
| Parameter | Plot |
|---|---|
| CZT HV Monitor | 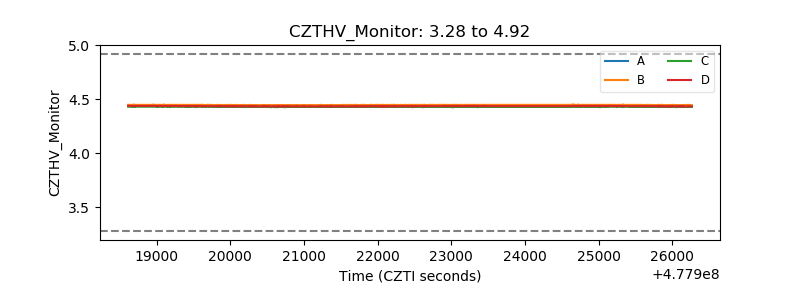 |
| D_VDD | 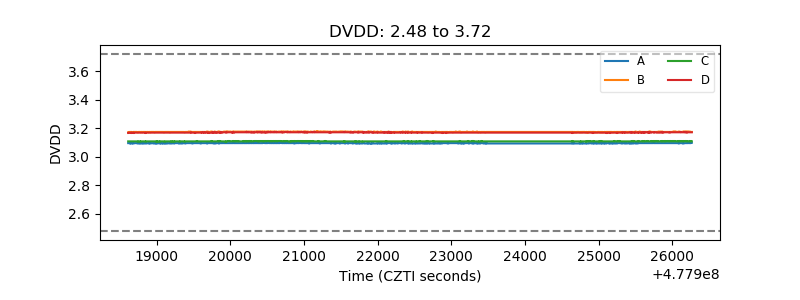 |
| Temperature 1 | 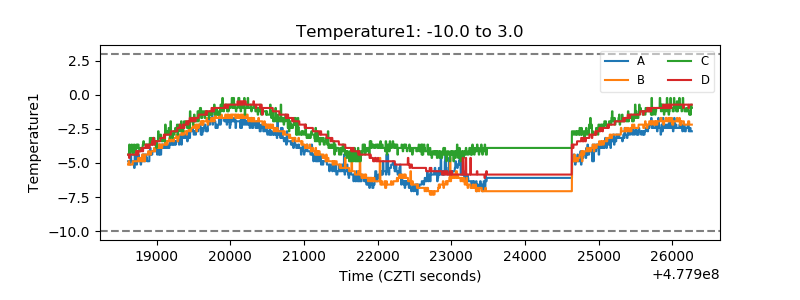 |
| Veto HV Monitor |  |
| Veto LLD | 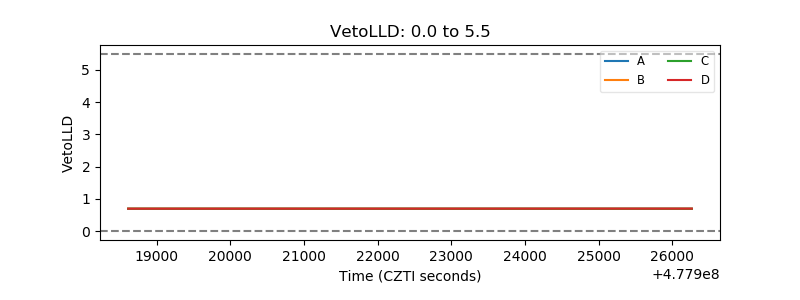 |
| Alpha Counter | 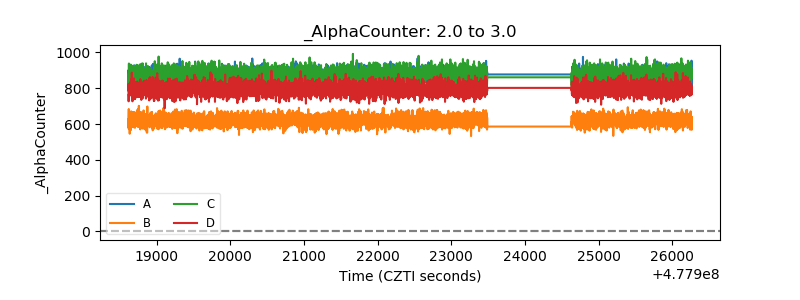 |
| _CPM_Rate | 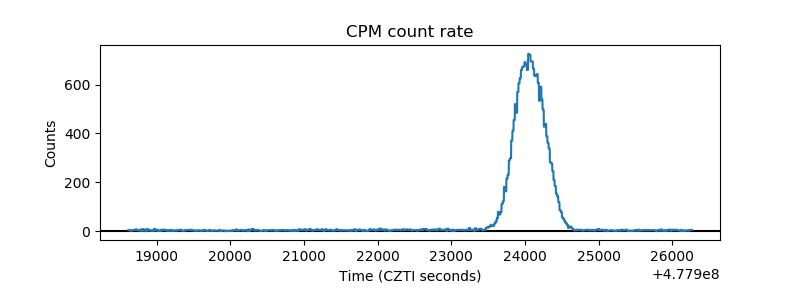 |
| CZT Counter | 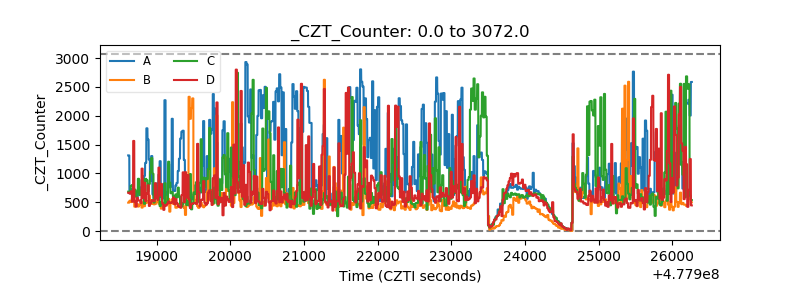 |
| +2.5 Volts monitor | 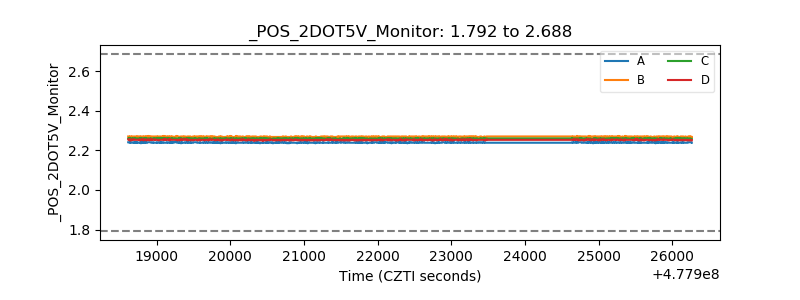 |
| +5 Volts monitor | 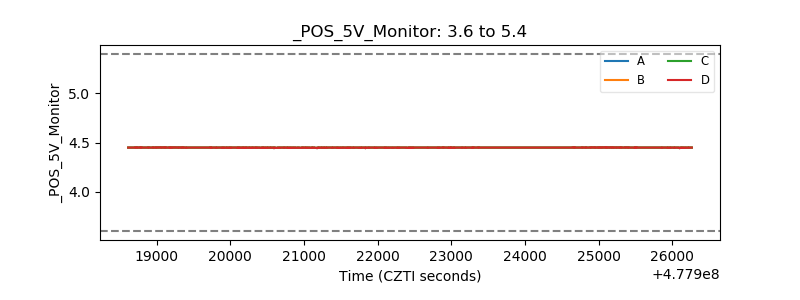 |
| _ROLL_ROT | 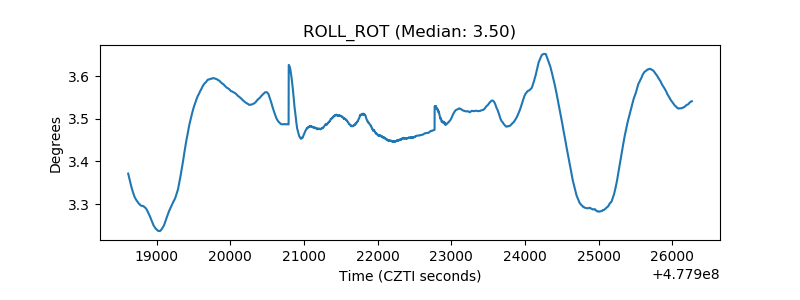 |
| _Roll_DEC | 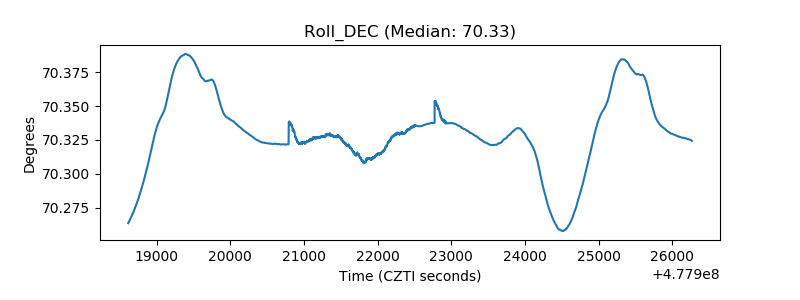 |
| _Roll_RA | 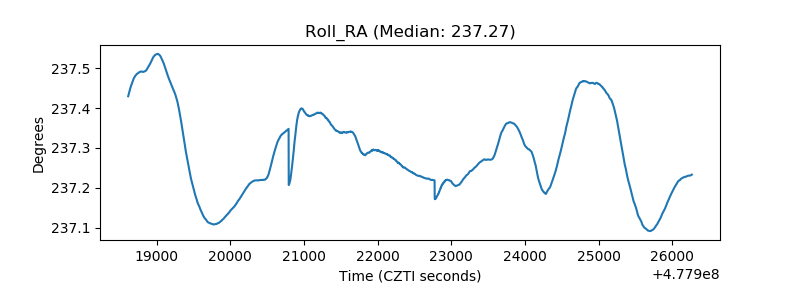 |
| Veto Counter | 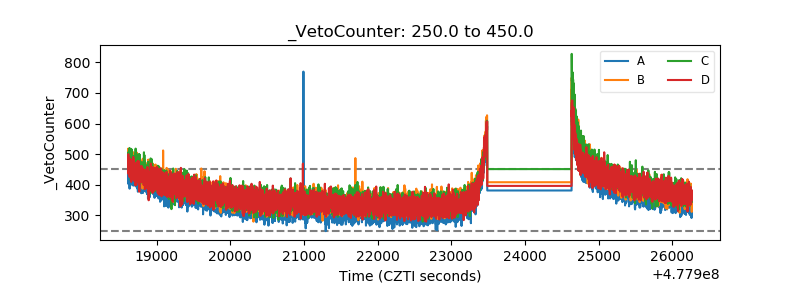 |