| Param | Original file | Final file |
|---|---|---|
| Filename | modeM0/AS1C07_001T01_9000006450_50871cztM0_level2.fits | modeM0/AS1C07_001T01_9000006450_50871cztM0_level2_quad_clean.evt |
| Size (bytes) | 551,759,040 | 84,758,400 |
| Size | 526.2 MB | 80.8 MB |
| Events in quadrant A | 6,316,720 | 532,225 |
| Events in quadrant B | 3,266,880 | 623,620 |
| Events in quadrant C | 4,729,639 | 519,333 |
| Events in quadrant D | 5,654,100 | 479,152 |
| Mode SS | |||
|---|---|---|---|
| Quadrant | BADHDUFLAG | Total packets | Discarded packets |
| A | 0 | 118 | 0 |
| B | 0 | 118 | 0 |
| C | 0 | 118 | 0 |
| D | 0 | 118 | 0 |
| Mode M0 | |||
|---|---|---|---|
| Quadrant | BADHDUFLAG | Total packets | Discarded packets |
| A | 0 | 23004 | 1 |
| B | 0 | 13749 | 1 |
| C | 0 | 17956 | 1 |
| D | 0 | 20775 | 1 |
| Mode M9 | |||
|---|---|---|---|
| Quadrant | BADHDUFLAG | Total packets | Discarded packets |
| A | 0 | 11 | 0 |
| B | 0 | 11 | 0 |
| C | 0 | 11 | 0 |
| D | 0 | 11 | 0 |
| Quadrant | Total seconds | Saturated seconds | Saturation percentage |
|---|---|---|---|
| A | 5895 | 741 | 12.569975% |
| B | 5896 | 200 | 3.392130% |
| C | 5896 | 553 | 9.379240% |
| D | 5896 | 662 | 11.227951% |
Noise dominated data is calculated using 1-second bins in cleaned event files. If a bin has >2000 counts, and if more than 50% of those come from <1% of pixels, then it is considered to be noise-dominated and hence unusable.
| Quadrant | # 1 sec bins | Bins with >0 counts | Bins with >2000 counts | High rate bins dominated by noise | Noise dominated (total time) | Noise dominated (detector-on time) | Marked lightcurve |
|---|---|---|---|---|---|---|---|
| A | 7009 | 5894 | 517 | 517 | 7.38% | 8.77% | 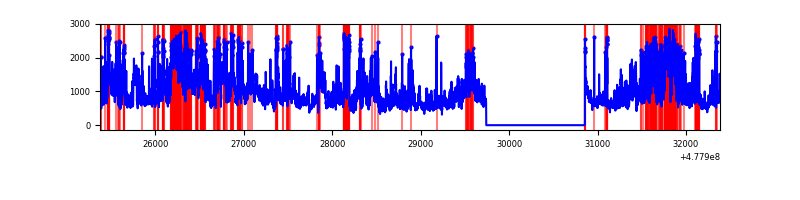 |
| B | 7010 | 5895 | 45 | 45 | 0.64% | 0.76% | 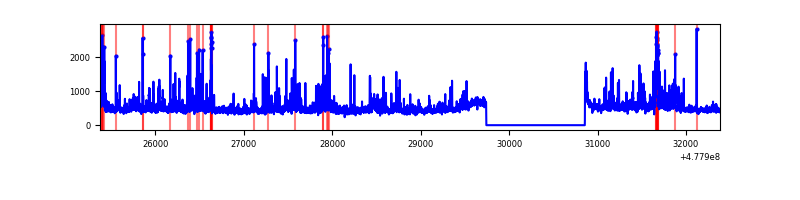 |
| C | 7010 | 5895 | 428 | 428 | 6.11% | 7.26% | 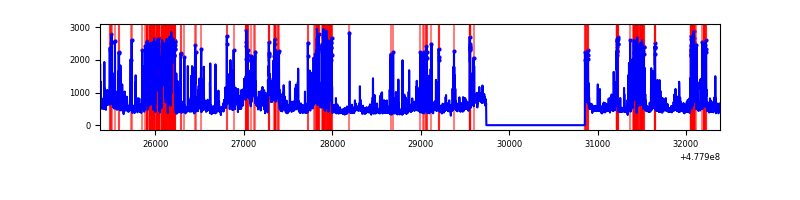 |
| D | 7010 | 5895 | 586 | 586 | 8.36% | 9.94% | 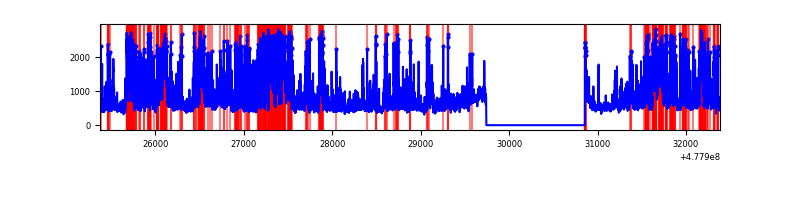 |
Top three noisy pixels from each quadrant. If the there are fewer than three noisy pixels in the level2.evt file, extra rows are filled as -1
| Pixel properties | Quadrant properties | ||||||
|---|---|---|---|---|---|---|---|
| Quadrant | DetID | PixID | Counts | Sigma | Mean | Median | Sigma |
| A | 4 | 4 | 1846522 | 11917.36 | 621 | 606 | 154.9 |
| A | 4 | 249 | 574793 | 3706.99 | 621 | 606 | 154.9 |
| A | 7 | 206 | 517838 | 3339.29 | 621 | 606 | 154.9 |
| B | 4 | 81 | 184281 | 1366.48 | 637 | 615 | 134.4 |
| B | 4 | 206 | 183315 | 1359.3 | 637 | 615 | 134.4 |
| B | 0 | 213 | 70967 | 523.42 | 637 | 615 | 134.4 |
| C | 1 | 29 | 666681 | 4055.46 | 609 | 604 | 164.2 |
| C | 3 | 233 | 339855 | 2065.56 | 609 | 604 | 164.2 |
| C | 15 | 229 | 246617 | 1497.87 | 609 | 604 | 164.2 |
| D | 2 | 216 | 924081 | 5471.58 | 603 | 580 | 168.8 |
| D | 2 | 249 | 508077 | 3006.83 | 603 | 580 | 168.8 |
| D | 10 | 24 | 504159 | 2983.62 | 603 | 580 | 168.8 |
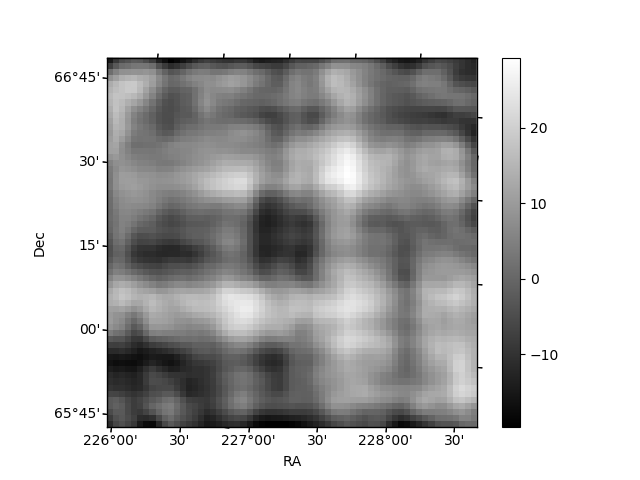
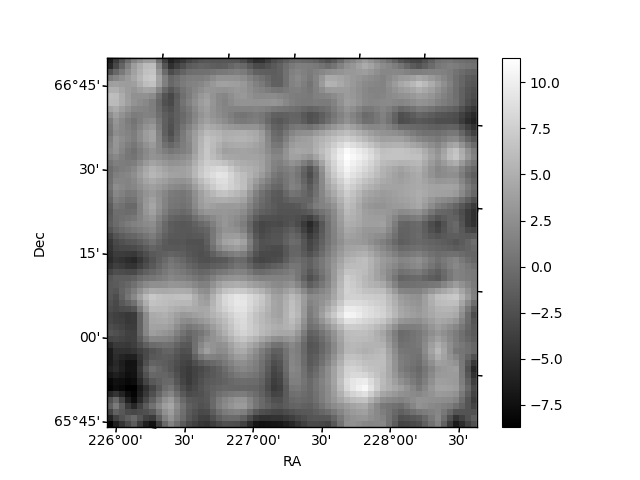
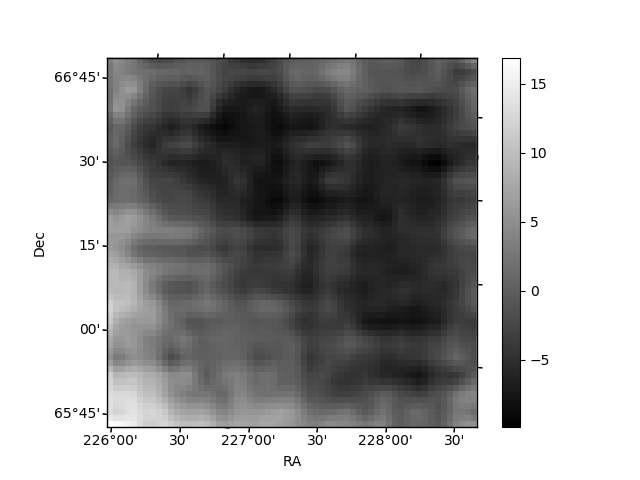
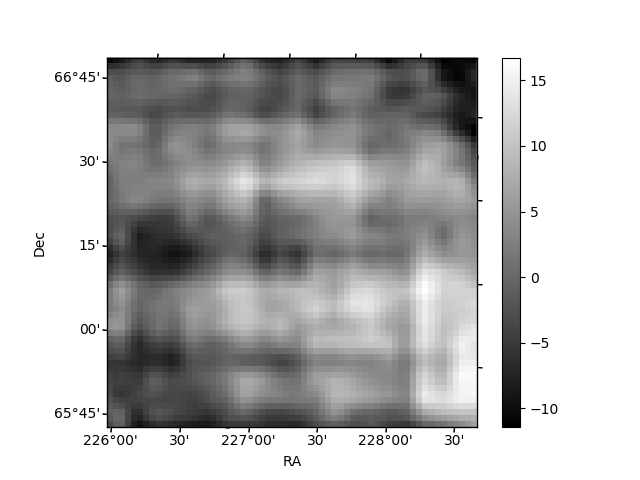
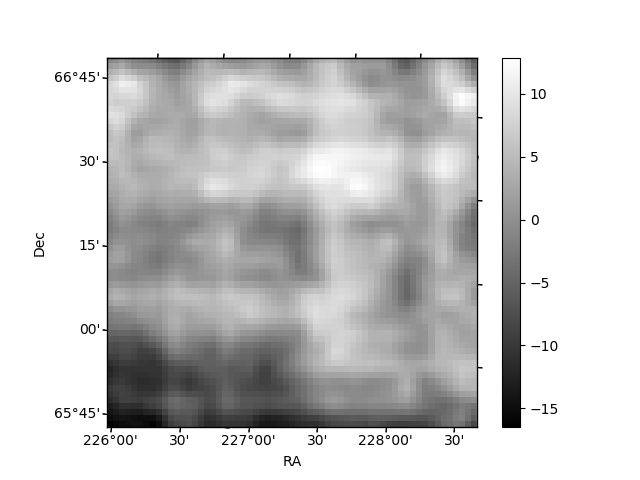
Histogram calculated using DETX and DETY for each event in the final _common_clean file
| Quadrant A | 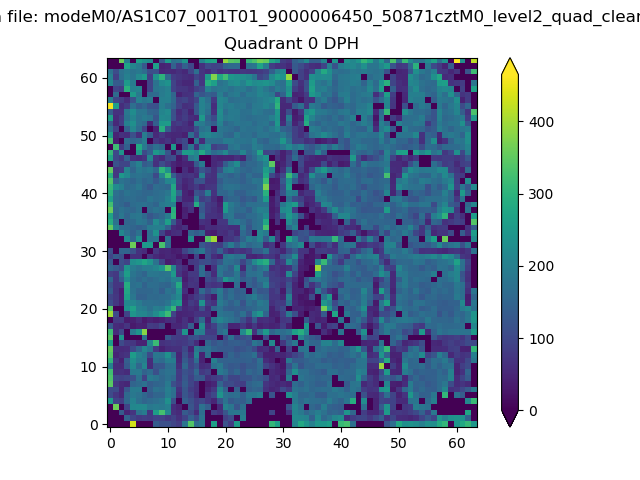 |
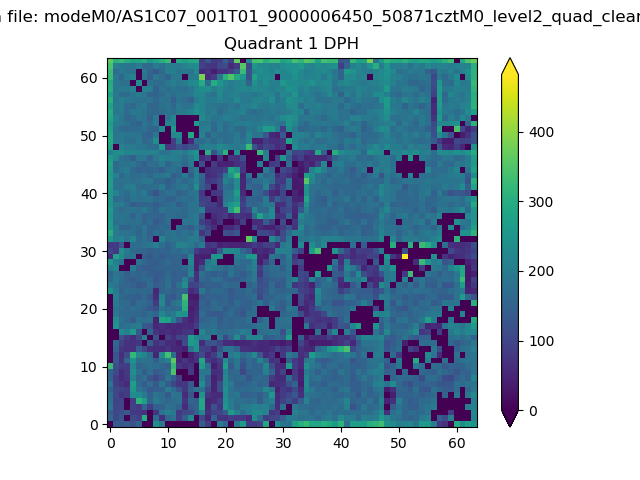 |
Quadrant B |
|---|---|---|---|
| Quadrant D | 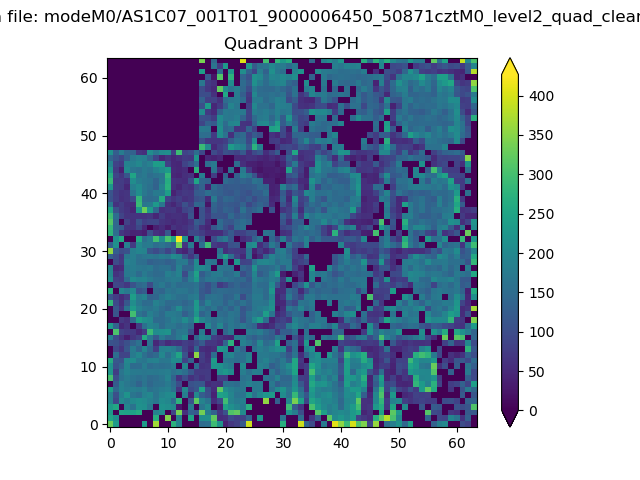 |
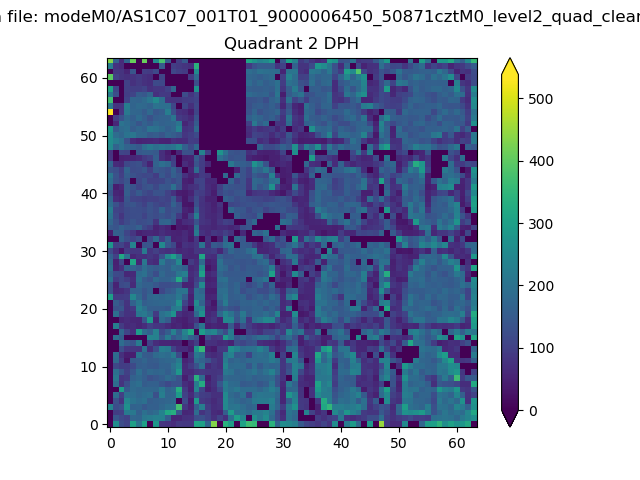 |
Quadrant C |
| Plot type | Count rate plots | Images |
|---|---|---|
| Comparison with Poisson distribution Blue bars denote a histogram of data divided into 1 sec bins. Red curve is a Poisson curve with rate = median count rate of data. |
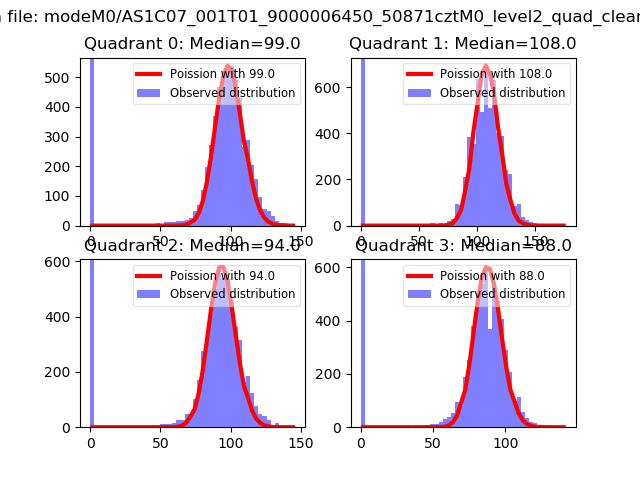 |
 |
| Quadrant-wise count rates Data is divided into 100 sec bins |
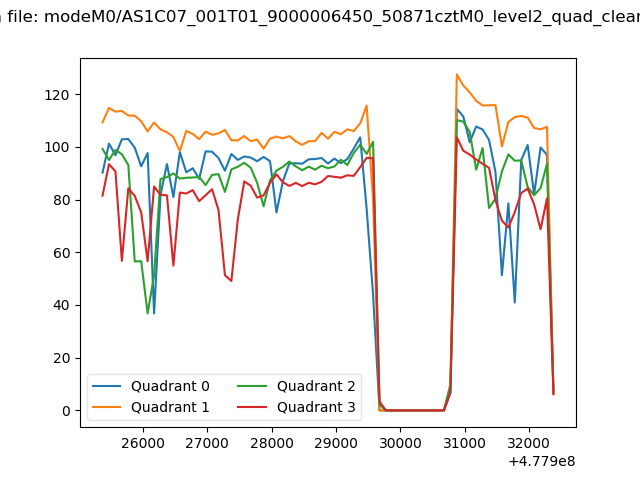 |
|
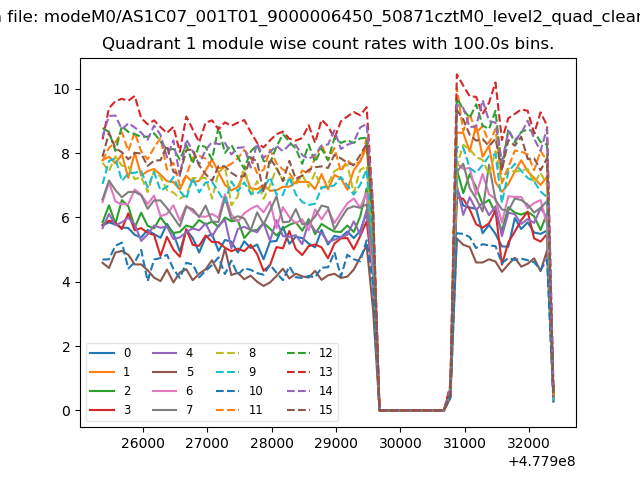
| Module-wise count rates for Quadrant A Data is divided into 100 sec bins |
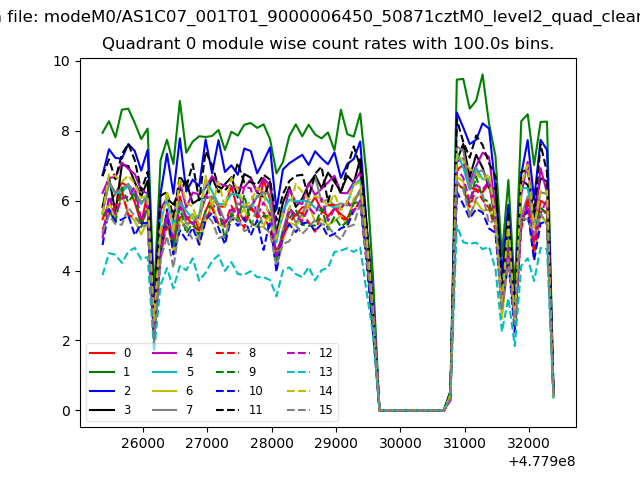 |
 |
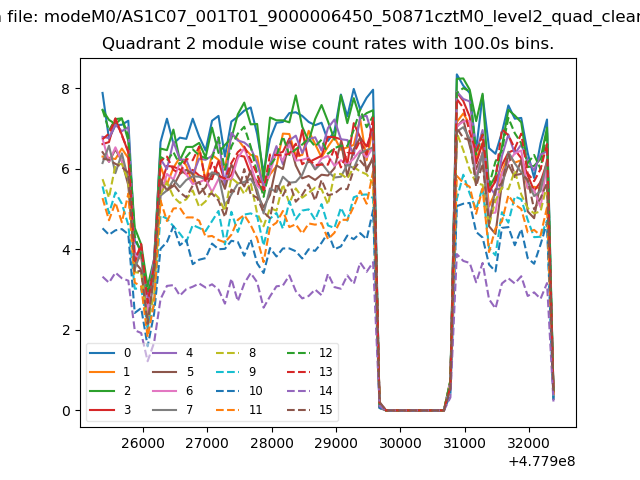
| Module-wise count rates for Quadrant B Data is divided into 100 sec bins |
 |
 |
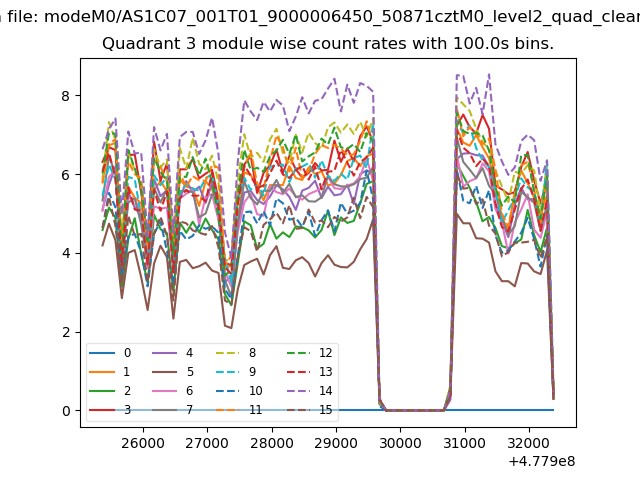
| Module-wise count rates for Quadrant C Data is divided into 100 sec bins |
 |
 |
| Module-wise count rates for Quadrant D Data is divided into 100 sec bins |
 |
 |
| Parameter | Plot |
|---|---|
| CZT HV Monitor | 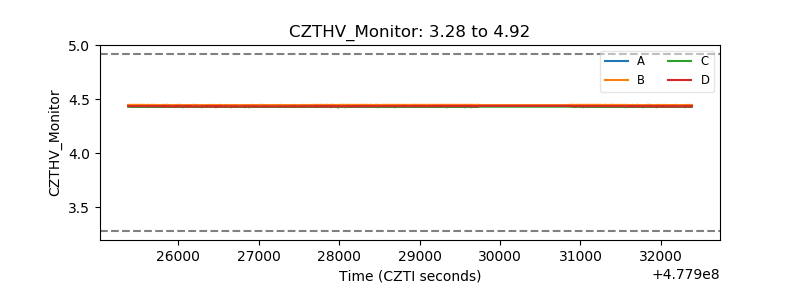 |
| D_VDD | 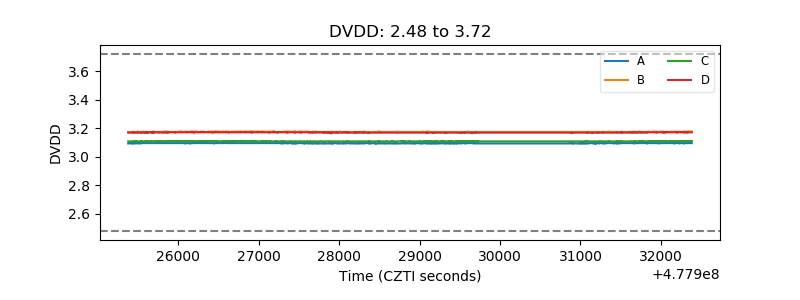 |
| Temperature 1 | 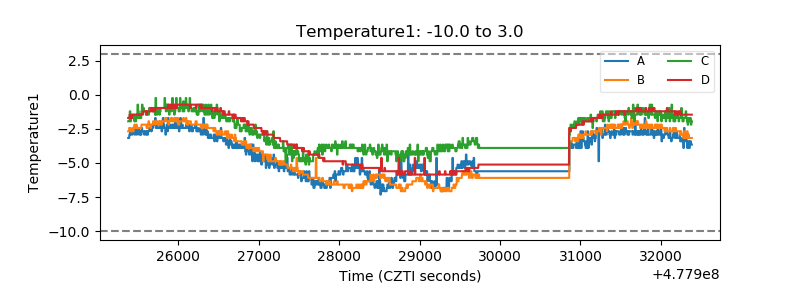 |
| Veto HV Monitor | 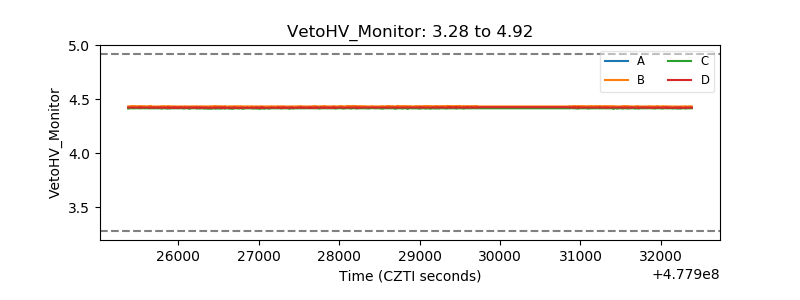 |
| Veto LLD | 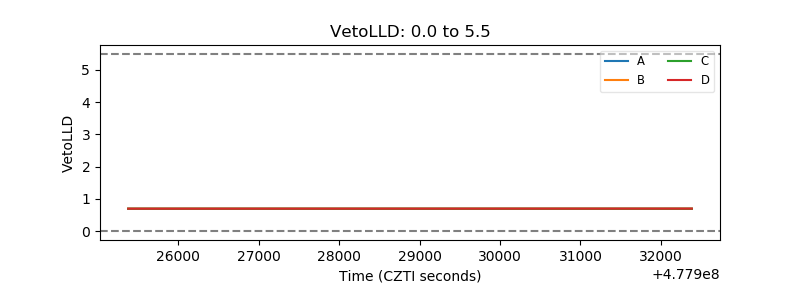 |
| Alpha Counter | 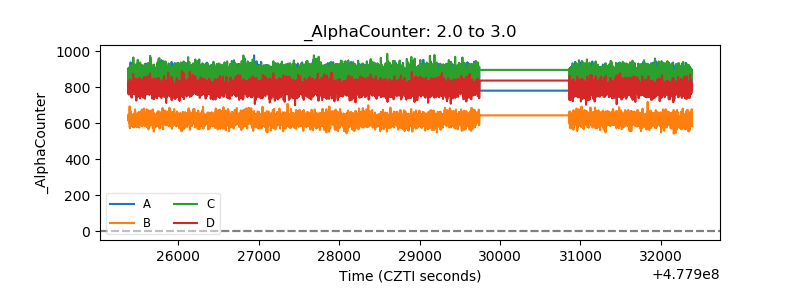 |
| _CPM_Rate | 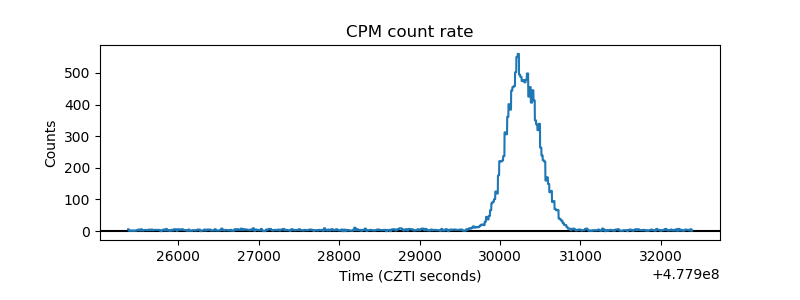 |
| CZT Counter | 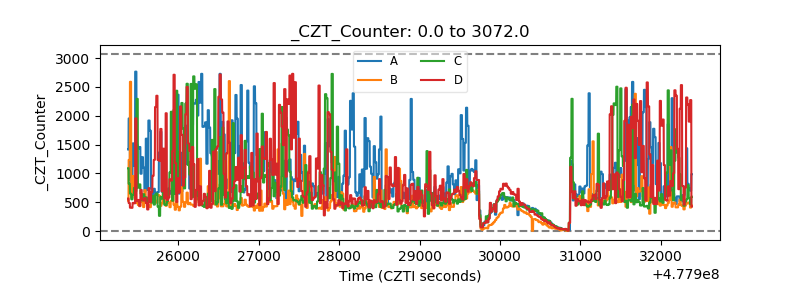 |
| +2.5 Volts monitor | 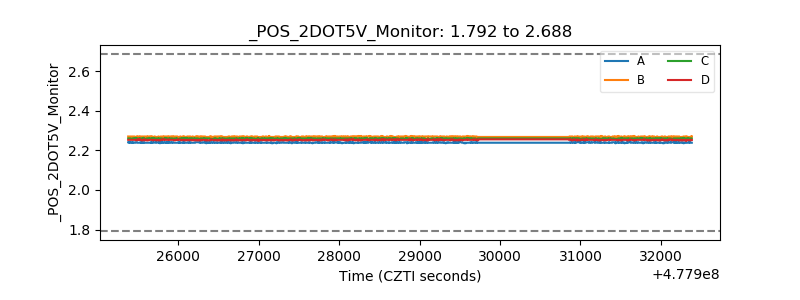 |
| +5 Volts monitor | 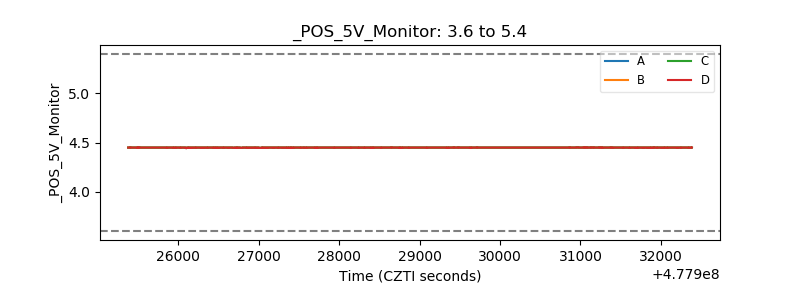 |
| _ROLL_ROT | 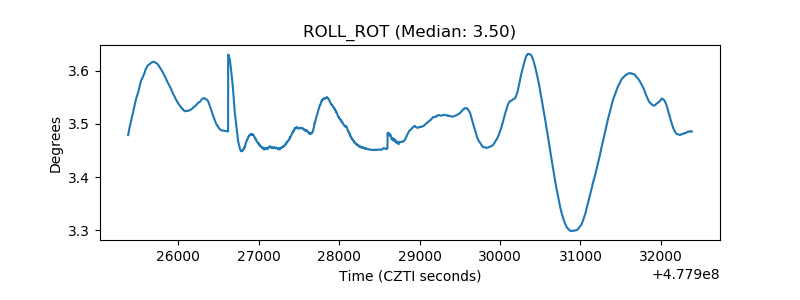 |
| _Roll_DEC | 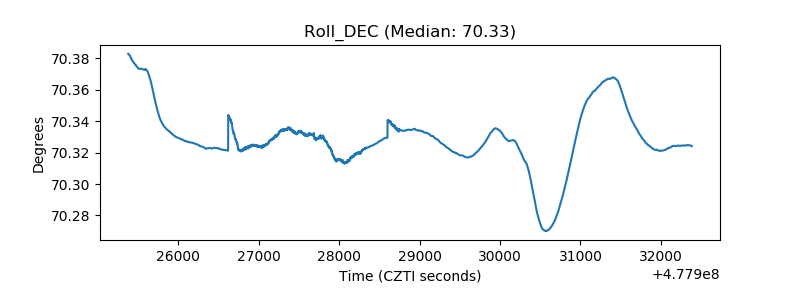 |
| _Roll_RA | 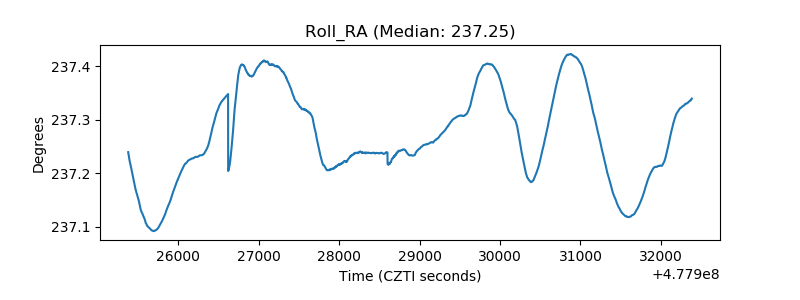 |
| Veto Counter | 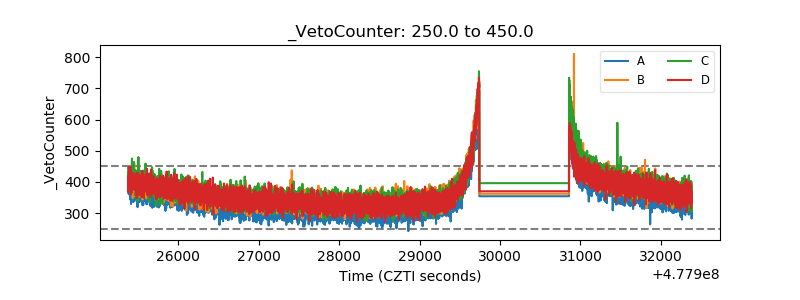 |