| Param | Original file | Final file |
|---|---|---|
| Filename | modeM0/AS1C07_001T01_9000006450_50872cztM0_level2.fits | modeM0/AS1C07_001T01_9000006450_50872cztM0_level2_quad_clean.evt |
| Size (bytes) | 522,570,240 | 85,230,720 |
| Size | 498.4 MB | 81.3 MB |
| Events in quadrant A | 4,404,407 | 561,473 |
| Events in quadrant B | 3,590,265 | 624,180 |
| Events in quadrant C | 5,048,399 | 491,153 |
| Events in quadrant D | 5,831,530 | 481,994 |
| Mode SS | |||
|---|---|---|---|
| Quadrant | BADHDUFLAG | Total packets | Discarded packets |
| A | 0 | 122 | 0 |
| B | 0 | 122 | 0 |
| C | 0 | 122 | 0 |
| D | 0 | 122 | 0 |
| Mode M0 | |||
|---|---|---|---|
| Quadrant | BADHDUFLAG | Total packets | Discarded packets |
| A | 0 | 16963 | 1 |
| B | 0 | 14911 | 4 |
| C | 0 | 19021 | 1 |
| D | 0 | 21511 | 1 |
| Mode M9 | |||
|---|---|---|---|
| Quadrant | BADHDUFLAG | Total packets | Discarded packets |
| A | 0 | 11 | 0 |
| B | 0 | 11 | 0 |
| C | 0 | 11 | 0 |
| D | 0 | 11 | 0 |
| Quadrant | Total seconds | Saturated seconds | Saturation percentage |
|---|---|---|---|
| A | 6044 | 412 | 6.816678% |
| B | 6043 | 253 | 4.186662% |
| C | 6044 | 819 | 13.550629% |
| D | 6044 | 714 | 11.813369% |
Noise dominated data is calculated using 1-second bins in cleaned event files. If a bin has >2000 counts, and if more than 50% of those come from <1% of pixels, then it is considered to be noise-dominated and hence unusable.
| Quadrant | # 1 sec bins | Bins with >0 counts | Bins with >2000 counts | High rate bins dominated by noise | Noise dominated (total time) | Noise dominated (detector-on time) | Marked lightcurve |
|---|---|---|---|---|---|---|---|
| A | 7098 | 6044 | 262 | 262 | 3.69% | 4.33% | 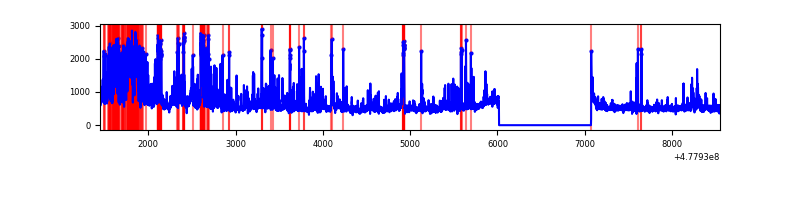 |
| B | 7097 | 6043 | 87 | 87 | 1.23% | 1.44% | 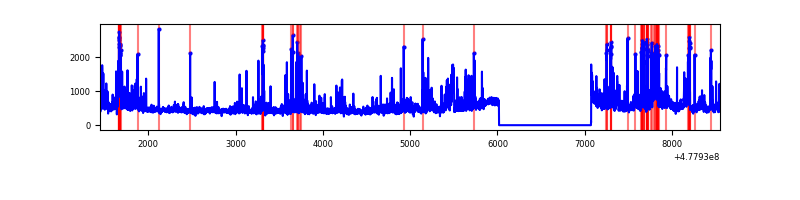 |
| C | 7098 | 6044 | 582 | 582 | 8.20% | 9.63% | 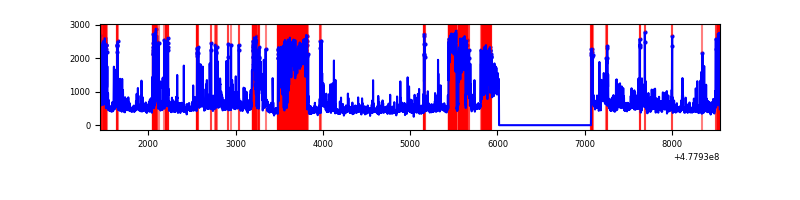 |
| D | 7098 | 6044 | 639 | 639 | 9.00% | 10.57% | 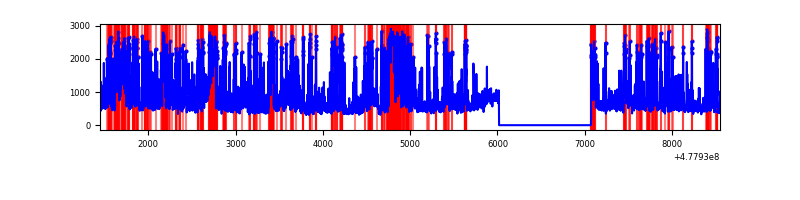 |
Top three noisy pixels from each quadrant. If the there are fewer than three noisy pixels in the level2.evt file, extra rows are filled as -1
| Pixel properties | Quadrant properties | ||||||
|---|---|---|---|---|---|---|---|
| Quadrant | DetID | PixID | Counts | Sigma | Mean | Median | Sigma |
| A | 4 | 249 | 569201 | 3598.34 | 640 | 623 | 158.0 |
| A | 4 | 4 | 450214 | 2845.31 | 640 | 623 | 158.0 |
| A | 7 | 206 | 175405 | 1106.14 | 640 | 623 | 158.0 |
| B | 4 | 206 | 337686 | 2497.68 | 643 | 622 | 135.0 |
| B | 4 | 81 | 276673 | 2045.57 | 643 | 622 | 135.0 |
| B | 10 | 247 | 98621 | 726.18 | 643 | 622 | 135.0 |
| C | 1 | 29 | 1022469 | 6348.62 | 592 | 587 | 161.0 |
| C | 12 | 247 | 446952 | 2773.12 | 592 | 587 | 161.0 |
| C | 15 | 229 | 253408 | 1570.69 | 592 | 587 | 161.0 |
| D | 2 | 216 | 870333 | 5211.26 | 608 | 586 | 166.9 |
| D | 15 | 108 | 448358 | 2682.91 | 608 | 586 | 166.9 |
| D | 2 | 249 | 422422 | 2527.51 | 608 | 586 | 166.9 |
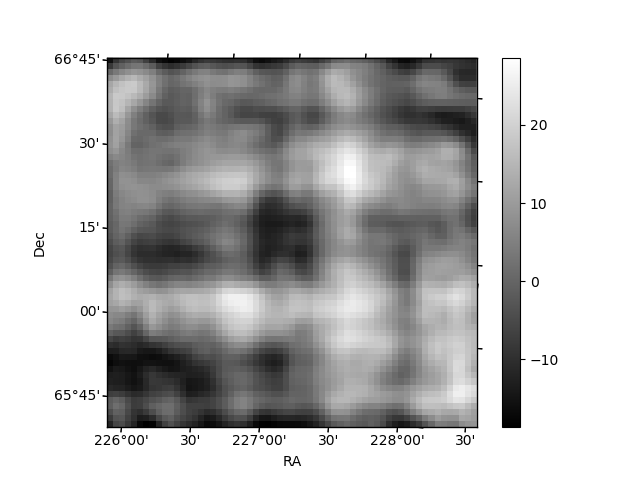
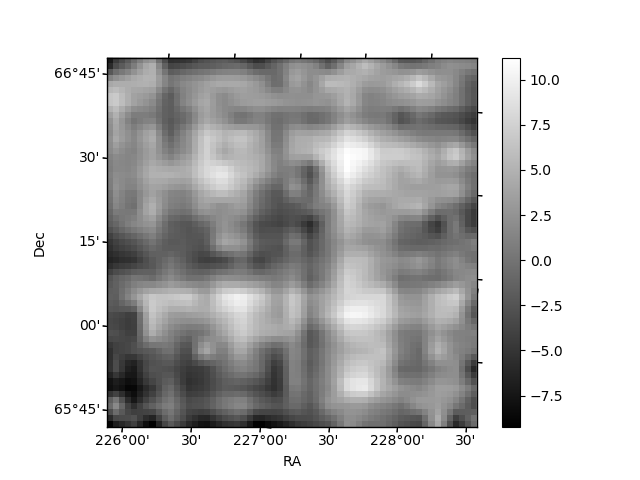
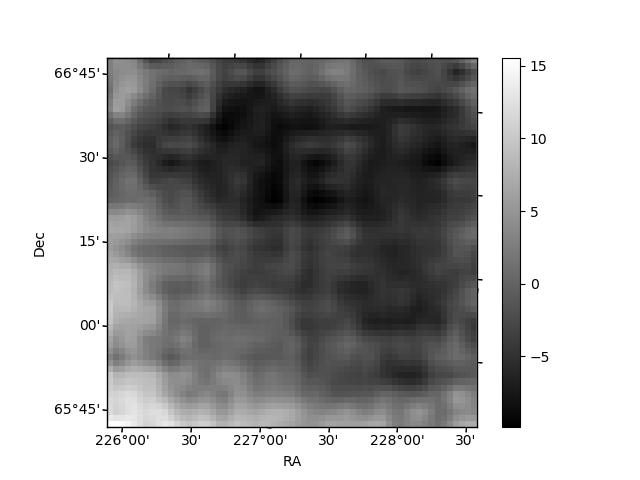
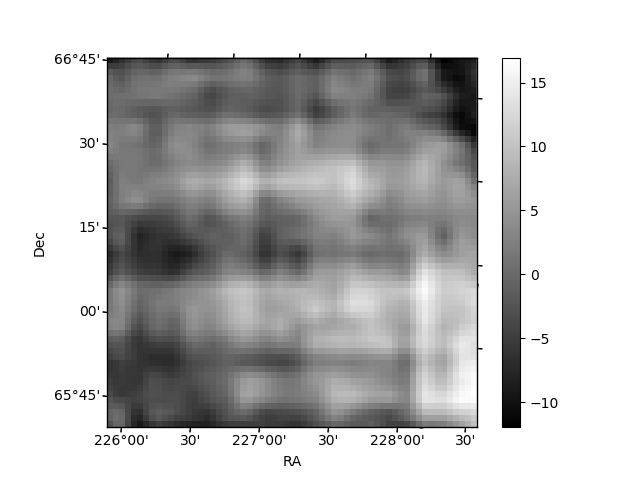
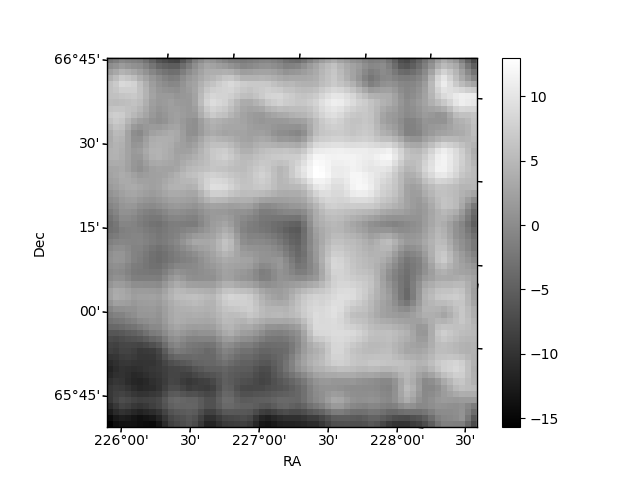
Histogram calculated using DETX and DETY for each event in the final _common_clean file
| Quadrant A | 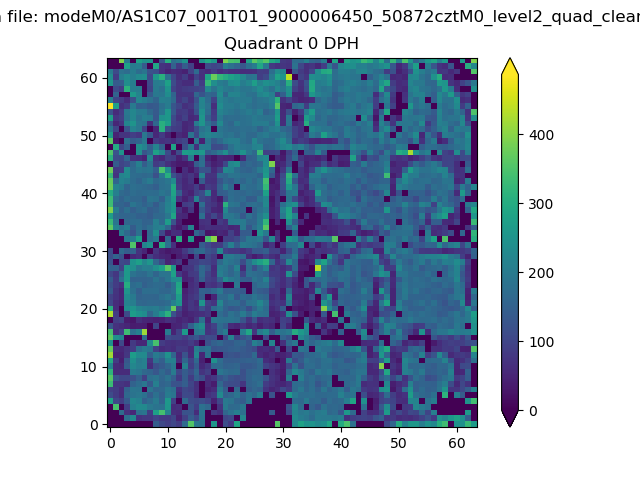 |
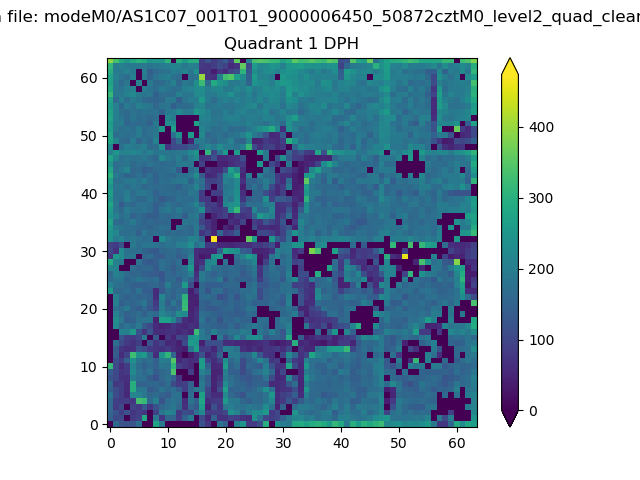 |
Quadrant B |
|---|---|---|---|
| Quadrant D | 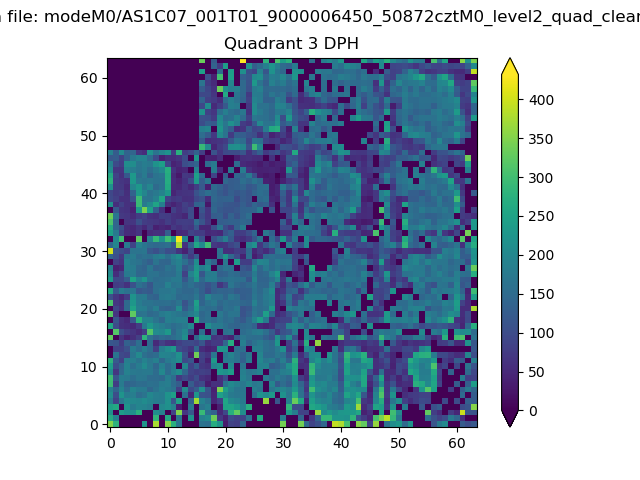 |
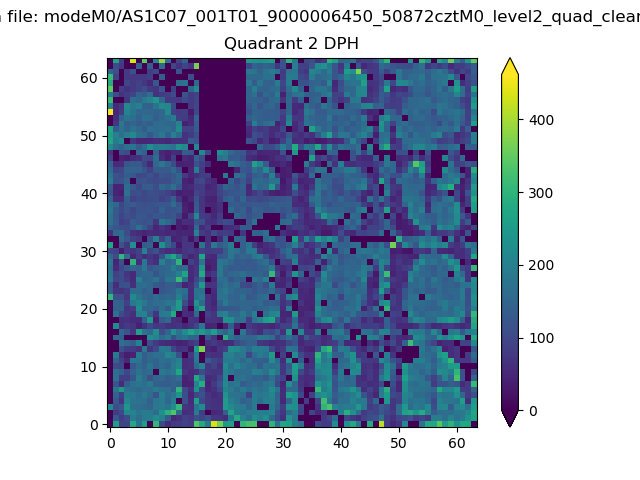 |
Quadrant C |
| Plot type | Count rate plots | Images |
|---|---|---|
| Comparison with Poisson distribution Blue bars denote a histogram of data divided into 1 sec bins. Red curve is a Poisson curve with rate = median count rate of data. |
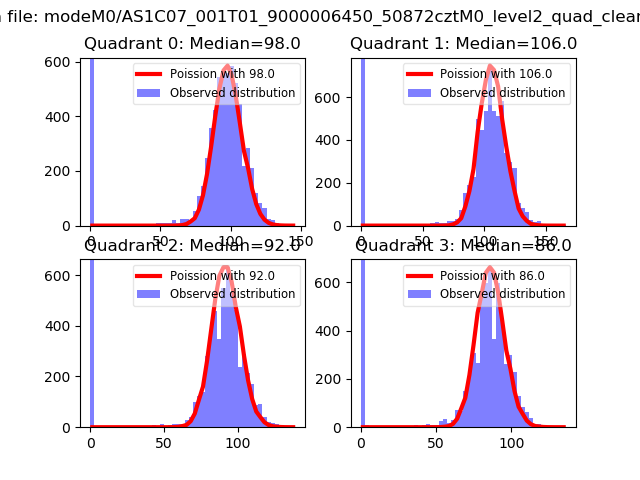 |
 |
| Quadrant-wise count rates Data is divided into 100 sec bins |
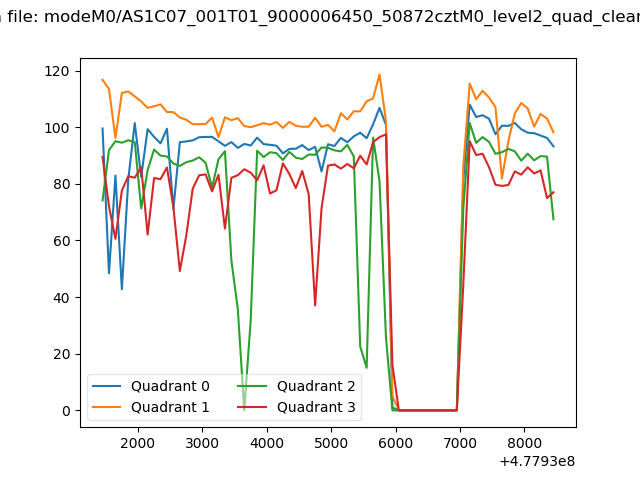 |
|
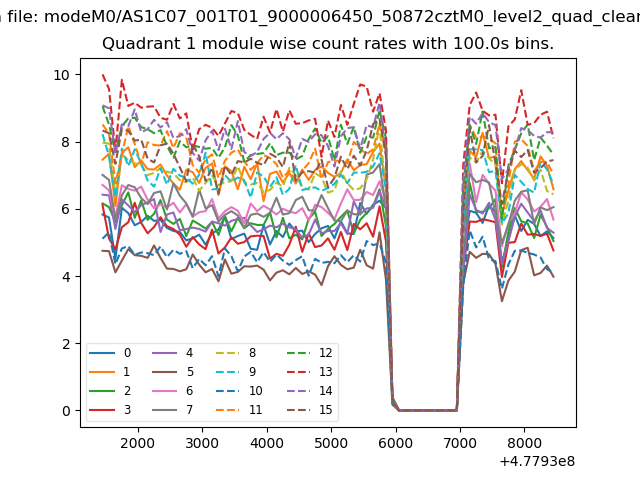
| Module-wise count rates for Quadrant A Data is divided into 100 sec bins |
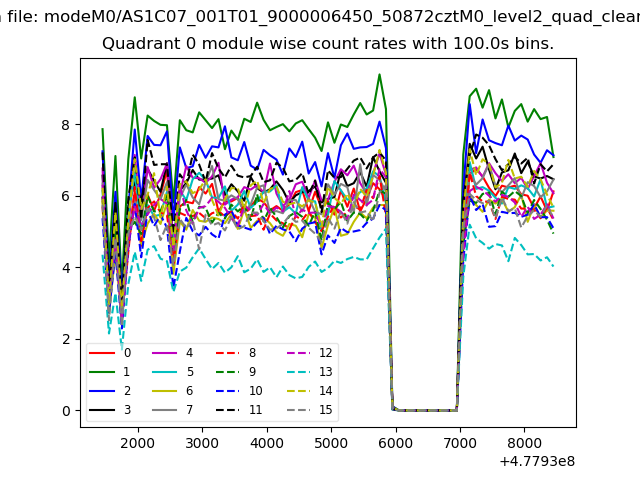 |
 |
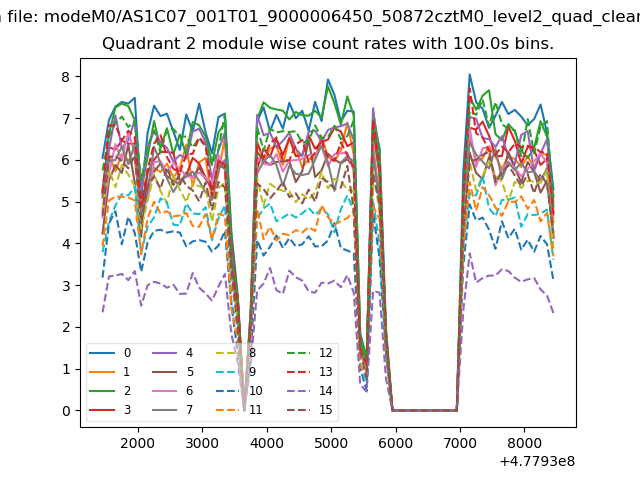
| Module-wise count rates for Quadrant B Data is divided into 100 sec bins |
 |
 |
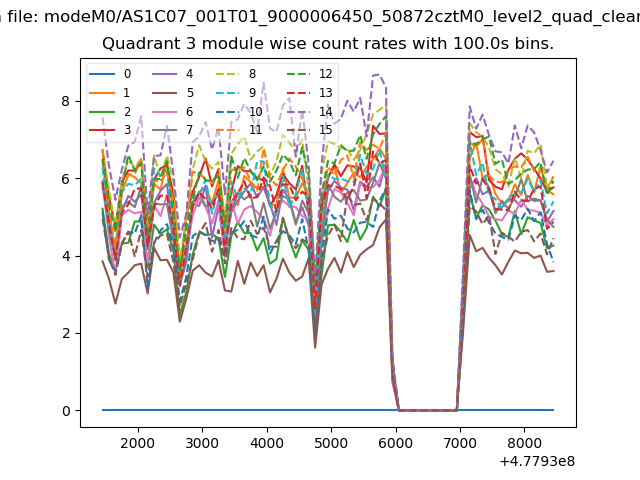
| Module-wise count rates for Quadrant C Data is divided into 100 sec bins |
 |
 |
| Module-wise count rates for Quadrant D Data is divided into 100 sec bins |
 |
 |
| Parameter | Plot |
|---|---|
| CZT HV Monitor | 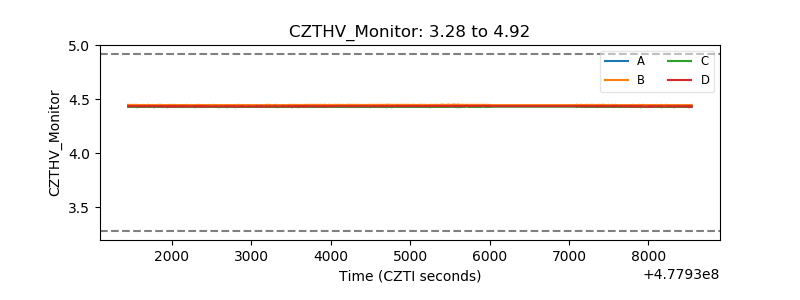 |
| D_VDD | 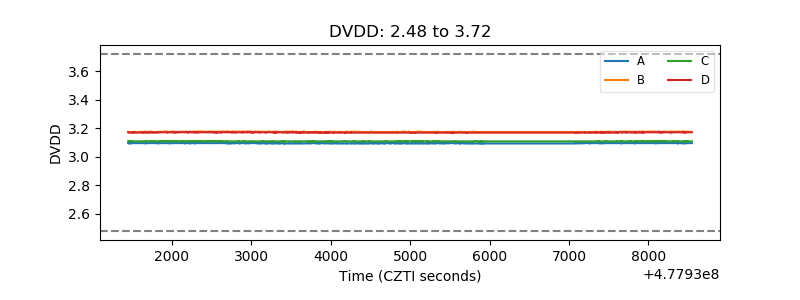 |
| Temperature 1 | 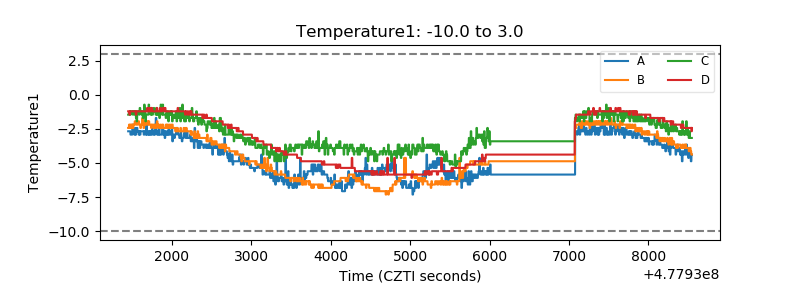 |
| Veto HV Monitor | 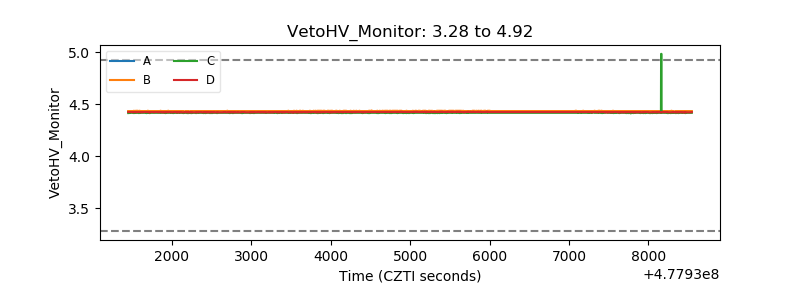 |
| Veto LLD | 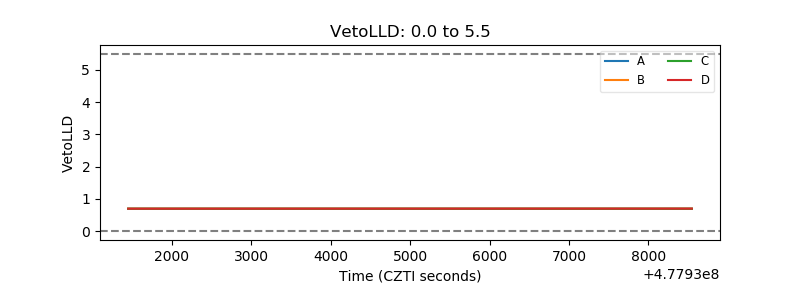 |
| Alpha Counter | 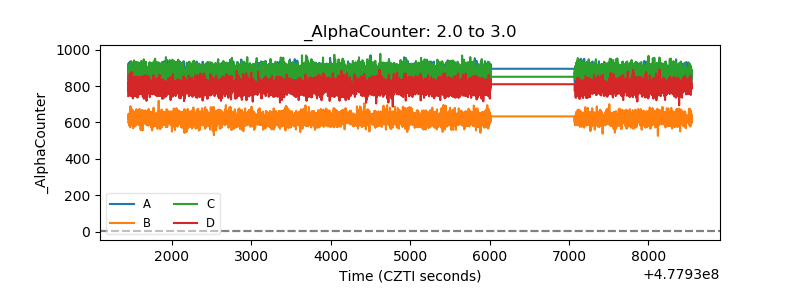 |
| _CPM_Rate | 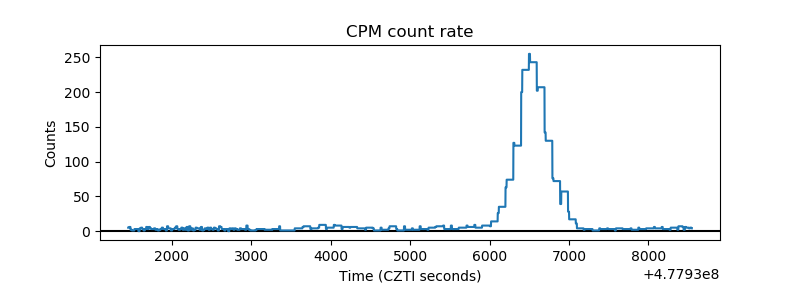 |
| CZT Counter | 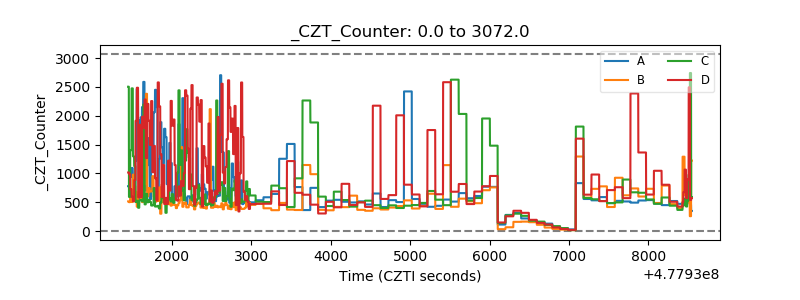 |
| +2.5 Volts monitor | 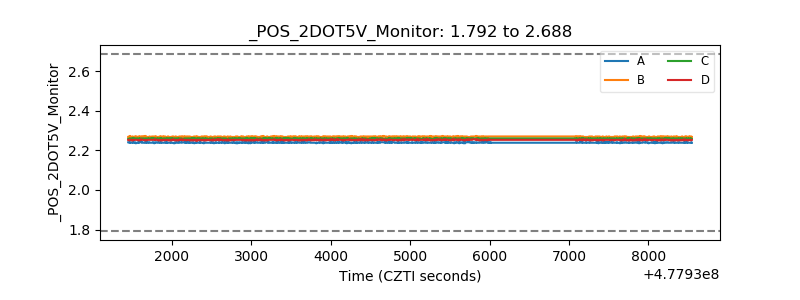 |
| +5 Volts monitor | 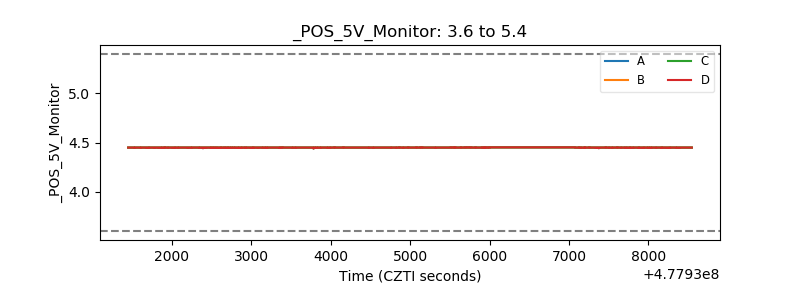 |
| _ROLL_ROT | 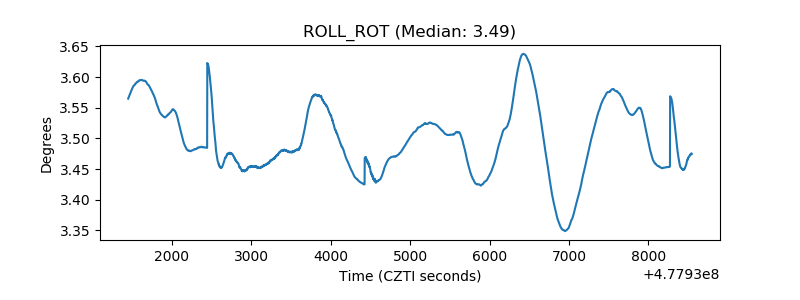 |
| _Roll_DEC | 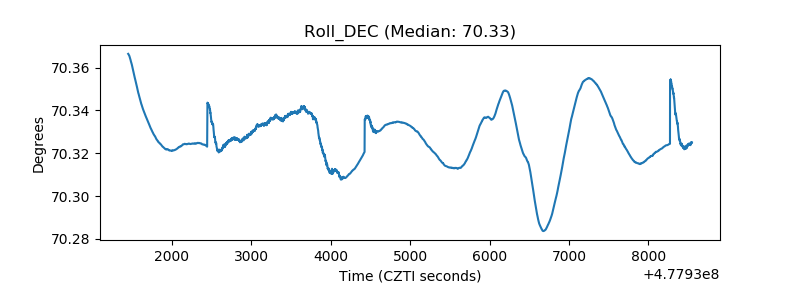 |
| _Roll_RA | 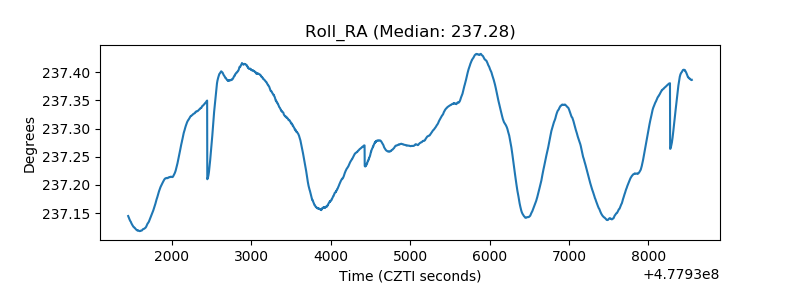 |
| Veto Counter | 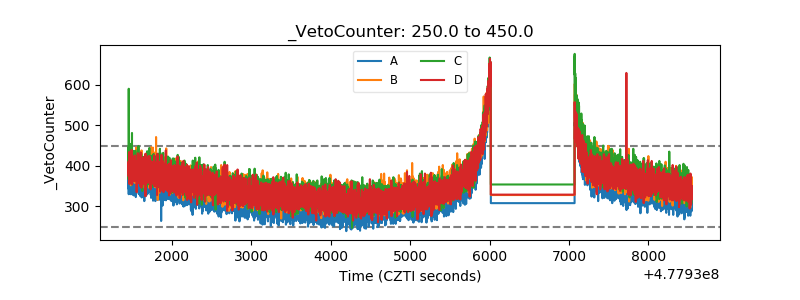 |