| Param | Original file | Final file |
|---|---|---|
| Filename | modeM0/AS1C07_001T01_9000006450_50873cztM0_level2.fits | modeM0/AS1C07_001T01_9000006450_50873cztM0_level2_quad_clean.evt |
| Size (bytes) | 487,488,960 | 90,521,280 |
| Size | 464.9 MB | 86.3 MB |
| Events in quadrant A | 5,217,493 | 567,032 |
| Events in quadrant B | 3,753,627 | 639,036 |
| Events in quadrant C | 4,256,072 | 565,131 |
| Events in quadrant D | 4,324,260 | 526,032 |
| Mode SS | |||
|---|---|---|---|
| Quadrant | BADHDUFLAG | Total packets | Discarded packets |
| A | 0 | 128 | 0 |
| B | 0 | 128 | 0 |
| C | 0 | 128 | 0 |
| D | 0 | 128 | 0 |
| Mode M0 | |||
|---|---|---|---|
| Quadrant | BADHDUFLAG | Total packets | Discarded packets |
| A | 0 | 19731 | 1 |
| B | 0 | 15597 | 1 |
| C | 0 | 16886 | 1 |
| D | 0 | 17285 | 5 |
| Mode M9 | |||
|---|---|---|---|
| Quadrant | BADHDUFLAG | Total packets | Discarded packets |
| A | 0 | 8 | 0 |
| B | 0 | 8 | 0 |
| C | 0 | 8 | 0 |
| D | 0 | 8 | 0 |
| Quadrant | Total seconds | Saturated seconds | Saturation percentage |
|---|---|---|---|
| A | 6359 | 573 | 9.010851% |
| B | 6360 | 282 | 4.433962% |
| C | 6360 | 249 | 3.915094% |
| D | 6359 | 339 | 5.331027% |
Noise dominated data is calculated using 1-second bins in cleaned event files. If a bin has >2000 counts, and if more than 50% of those come from <1% of pixels, then it is considered to be noise-dominated and hence unusable.
| Quadrant | # 1 sec bins | Bins with >0 counts | Bins with >2000 counts | High rate bins dominated by noise | Noise dominated (total time) | Noise dominated (detector-on time) | Marked lightcurve |
|---|---|---|---|---|---|---|---|
| A | 7129 | 6361 | 457 | 457 | 6.41% | 7.18% | 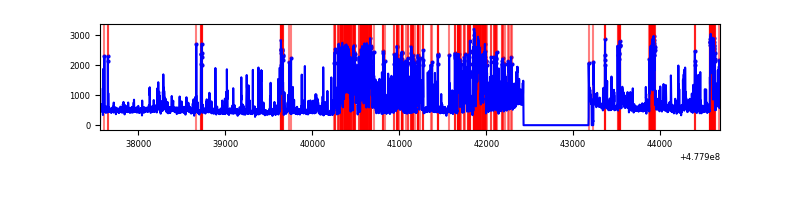 |
| B | 7130 | 6362 | 116 | 116 | 1.63% | 1.82% | 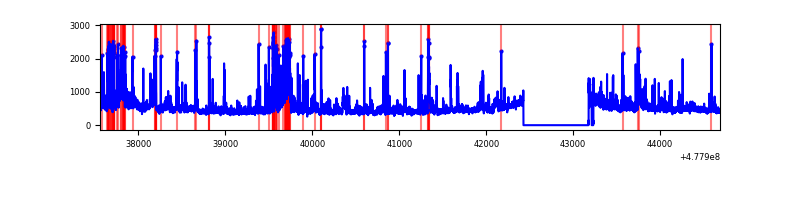 |
| C | 7130 | 6362 | 157 | 157 | 2.20% | 2.47% | 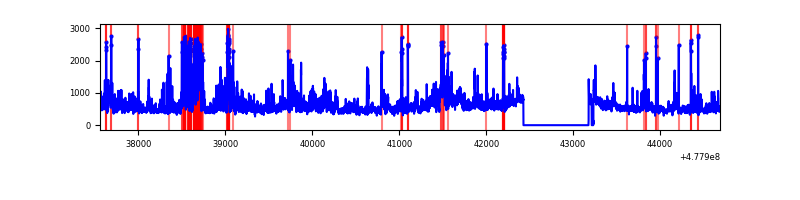 |
| D | 7129 | 6361 | 226 | 226 | 3.17% | 3.55% | 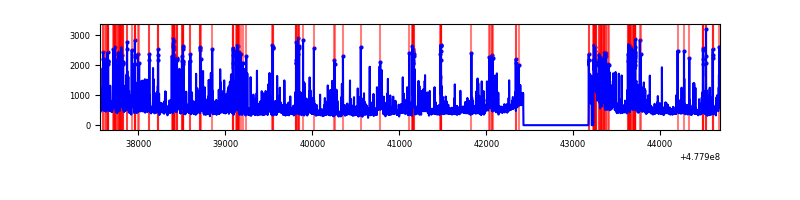 |
Top three noisy pixels from each quadrant. If the there are fewer than three noisy pixels in the level2.evt file, extra rows are filled as -1
| Pixel properties | Quadrant properties | ||||||
|---|---|---|---|---|---|---|---|
| Quadrant | DetID | PixID | Counts | Sigma | Mean | Median | Sigma |
| A | 4 | 156 | 783170 | 4862.77 | 657 | 639 | 160.9 |
| A | 7 | 206 | 539888 | 3350.98 | 657 | 639 | 160.9 |
| A | 4 | 249 | 426030 | 2643.45 | 657 | 639 | 160.9 |
| B | 4 | 206 | 367893 | 2606.84 | 667 | 645 | 140.9 |
| B | 4 | 170 | 156386 | 1105.5 | 667 | 645 | 140.9 |
| B | 4 | 81 | 114798 | 810.29 | 667 | 645 | 140.9 |
| C | 5 | 10 | 465005 | 2598.97 | 658 | 651 | 178.7 |
| C | 15 | 229 | 297587 | 1661.94 | 658 | 651 | 178.7 |
| C | 10 | 171 | 255318 | 1425.36 | 658 | 651 | 178.7 |
| D | 2 | 249 | 337324 | 1883.69 | 645 | 620 | 178.7 |
| D | 2 | 153 | 231553 | 1291.96 | 645 | 620 | 178.7 |
| D | 8 | 48 | 215441 | 1201.82 | 645 | 620 | 178.7 |
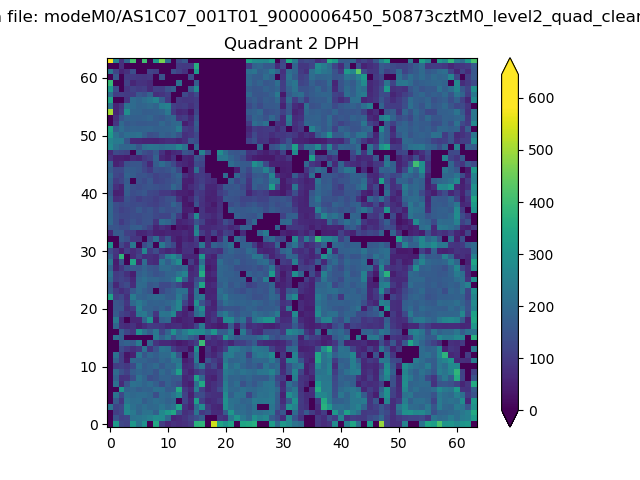
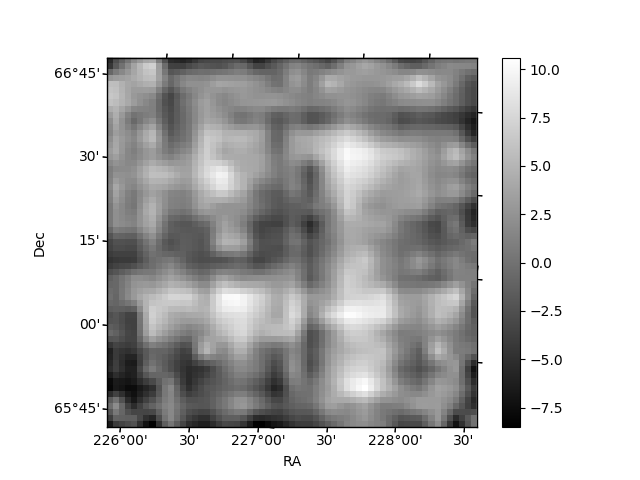
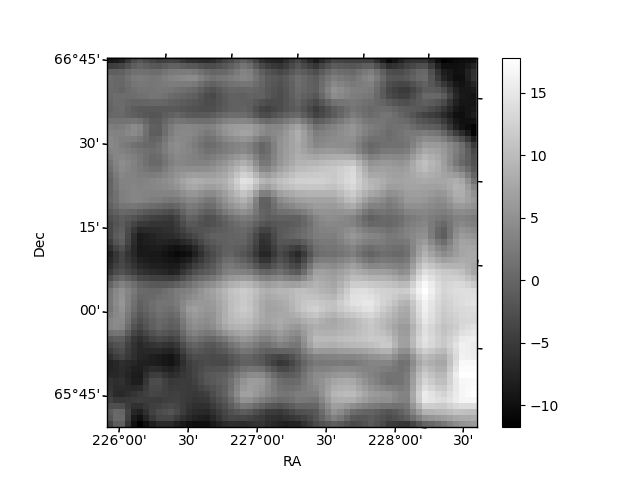
Histogram calculated using DETX and DETY for each event in the final _common_clean file
| Quadrant A | 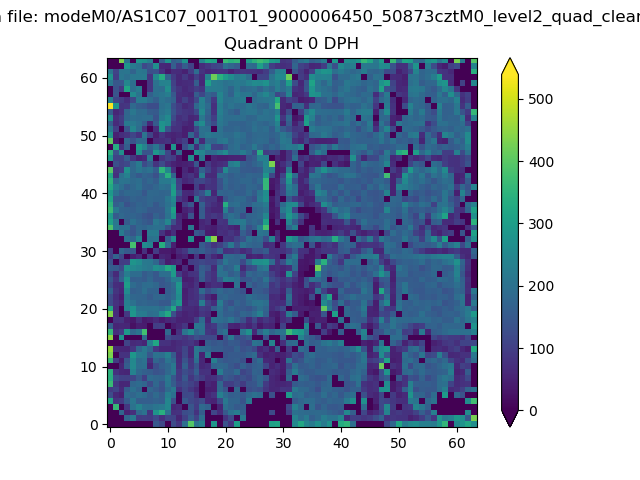 |
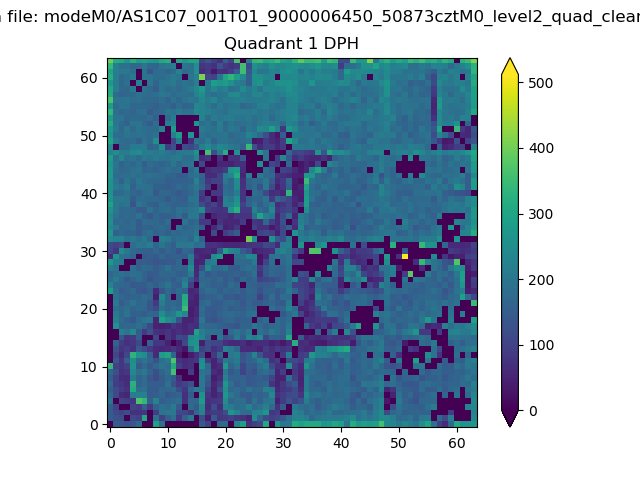 |
Quadrant B |
|---|---|---|---|
| Quadrant D | 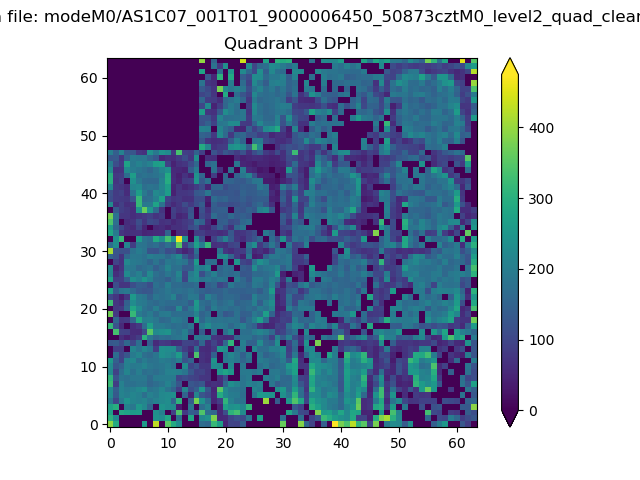 |
 |
Quadrant C |
| Plot type | Count rate plots | Images |
|---|---|---|
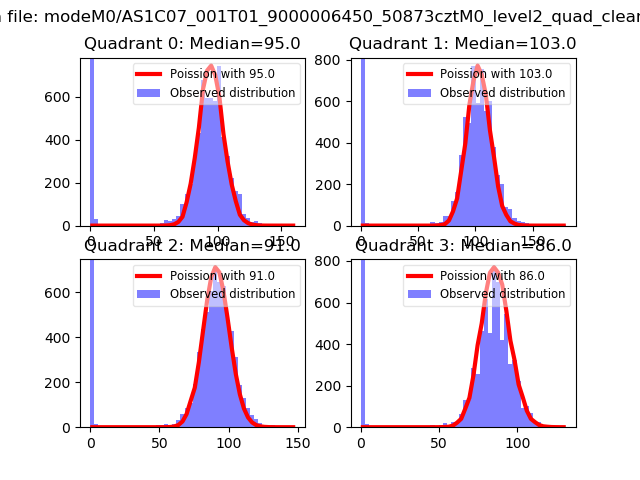
| Comparison with Poisson distribution Blue bars denote a histogram of data divided into 1 sec bins. Red curve is a Poisson curve with rate = median count rate of data. |
 |
 |
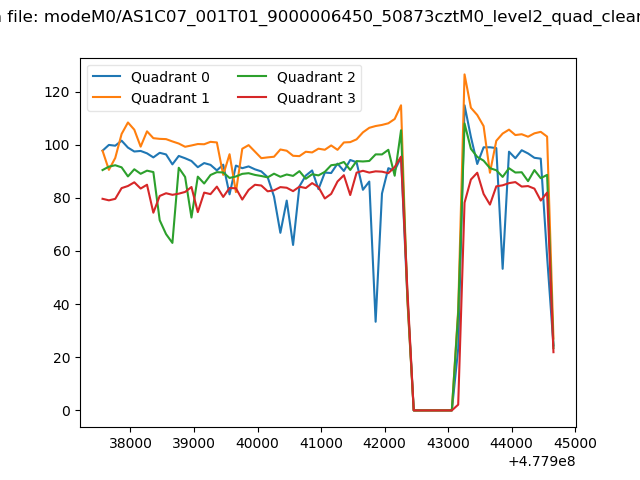
| Quadrant-wise count rates Data is divided into 100 sec bins |
 |
|
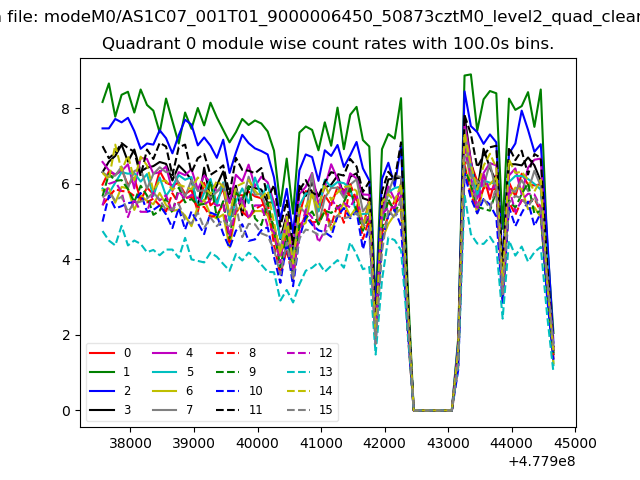
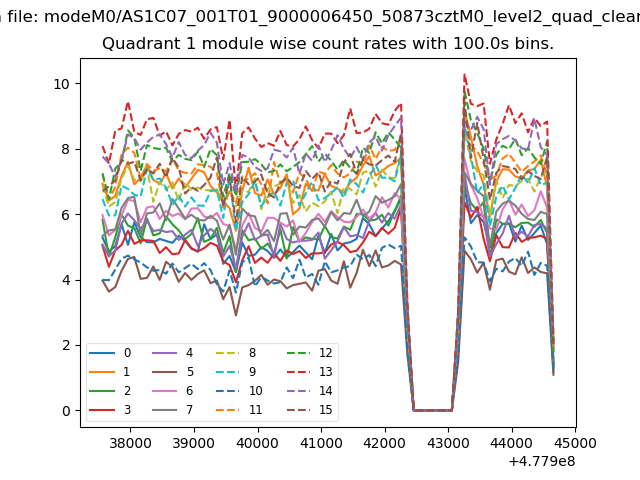
| Module-wise count rates for Quadrant A Data is divided into 100 sec bins |
 |
 |
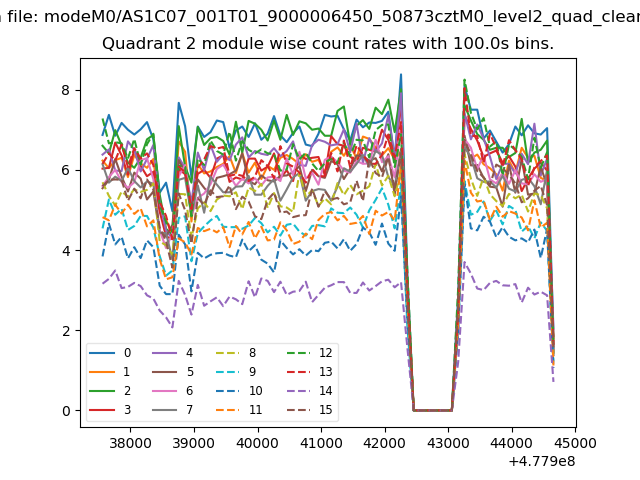
| Module-wise count rates for Quadrant B Data is divided into 100 sec bins |
 |
 |
| Module-wise count rates for Quadrant C Data is divided into 100 sec bins |
 |
 |
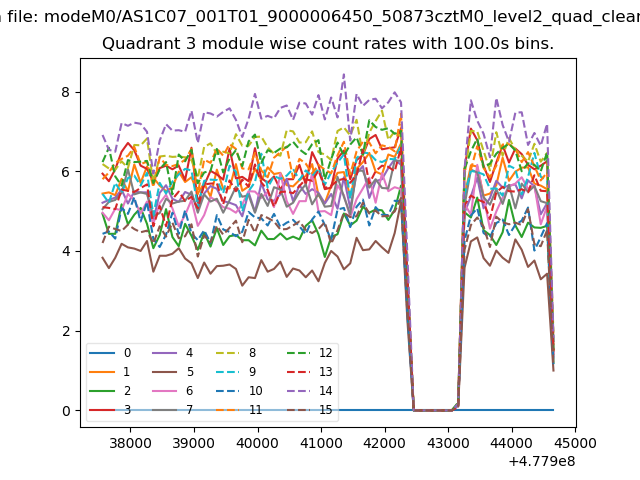
| Module-wise count rates for Quadrant D Data is divided into 100 sec bins |
 |
 |
| Parameter | Plot |
|---|---|
| CZT HV Monitor | 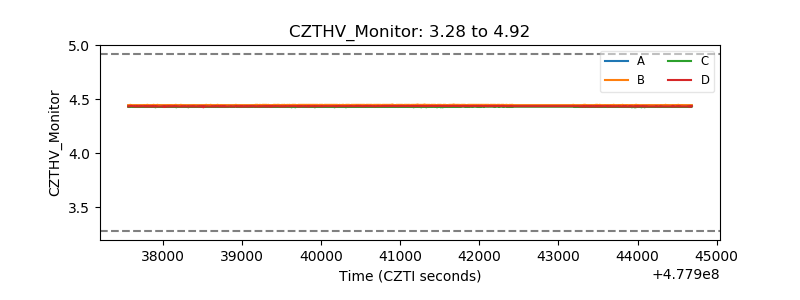 |
| D_VDD | 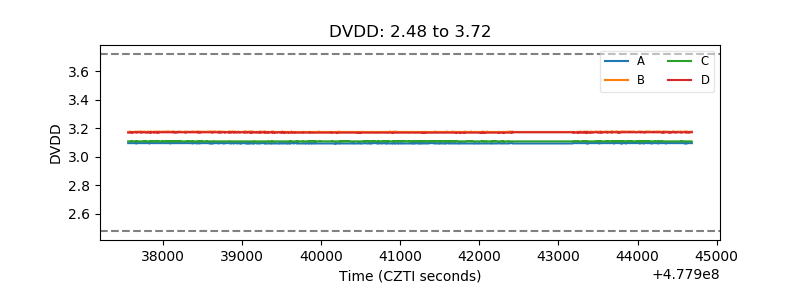 |
| Temperature 1 | 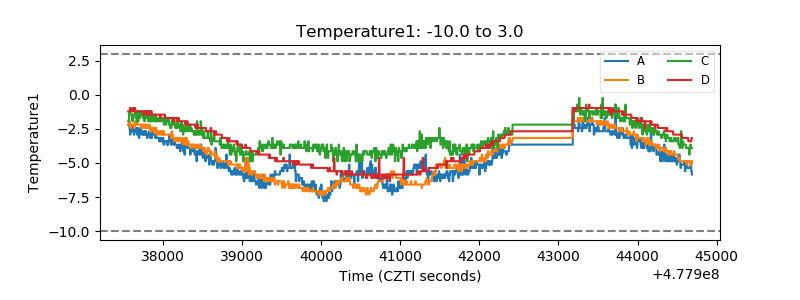 |
| Veto HV Monitor | 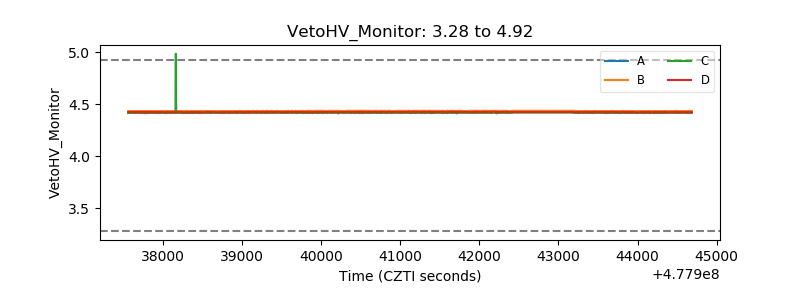 |
| Veto LLD | 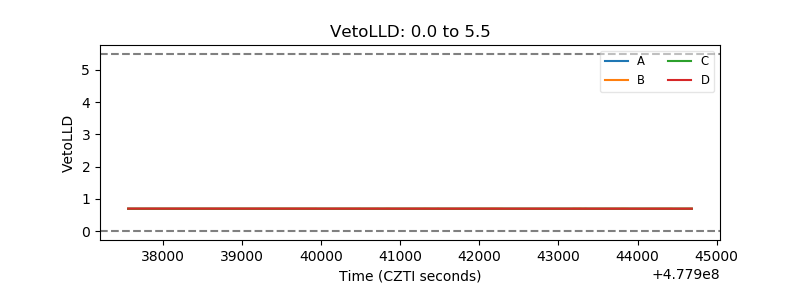 |
| Alpha Counter | 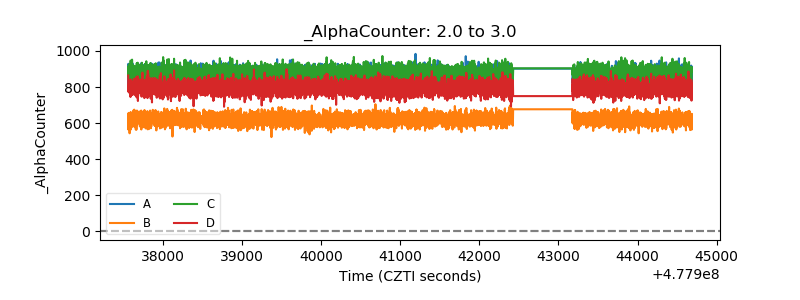 |
| _CPM_Rate | 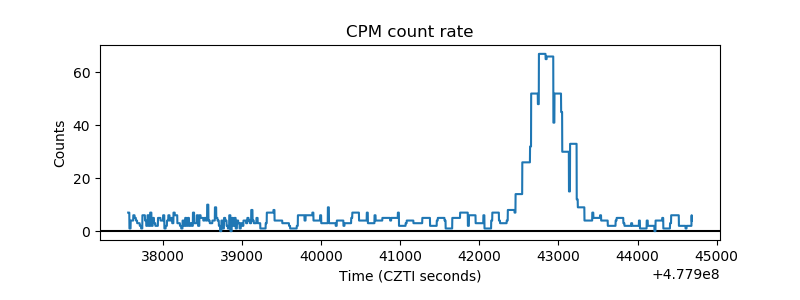 |
| CZT Counter | 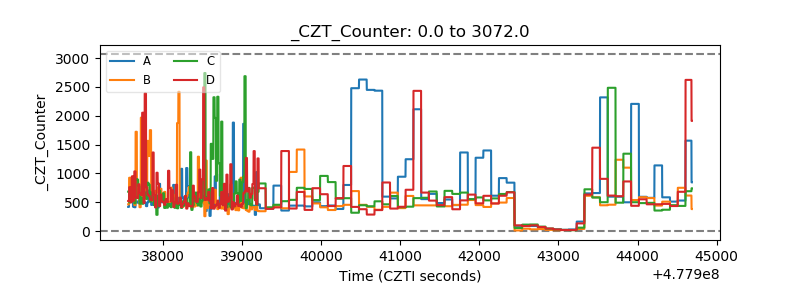 |
| +2.5 Volts monitor | 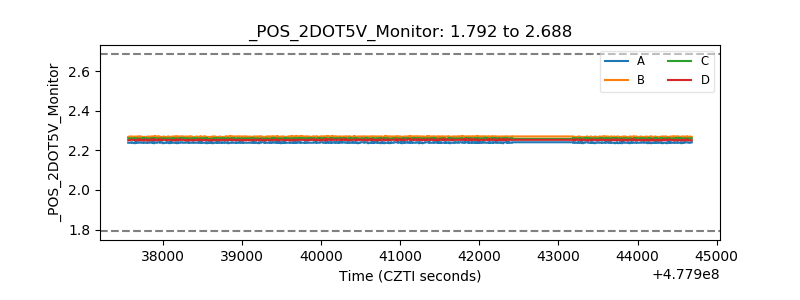 |
| +5 Volts monitor |  |
| _ROLL_ROT | 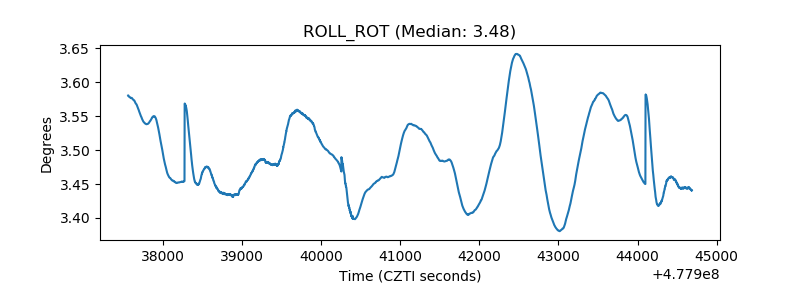 |
| _Roll_DEC | 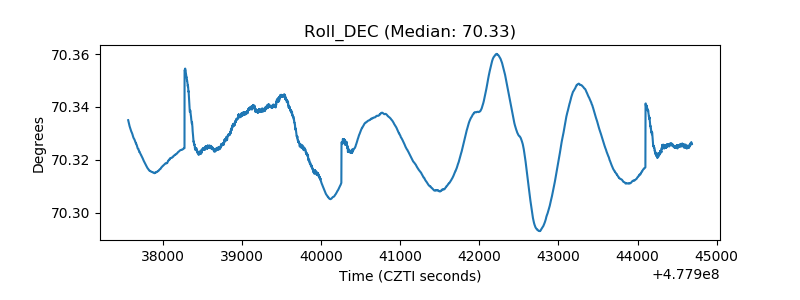 |
| _Roll_RA | 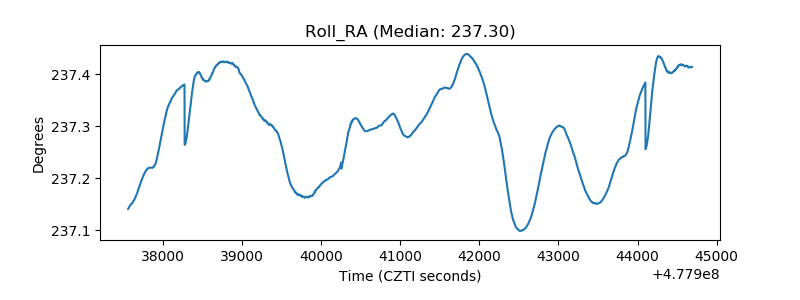 |
| Veto Counter | 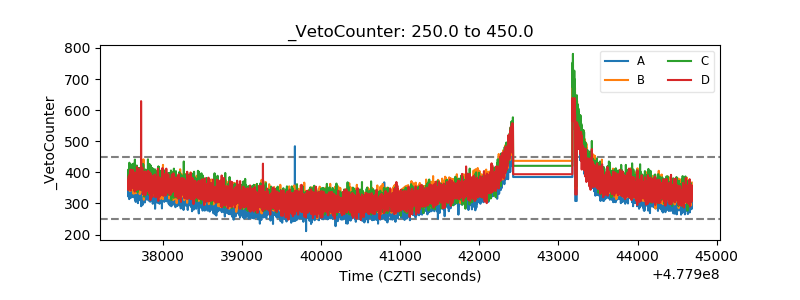 |