| Param | Original file | Final file |
|---|---|---|
| Filename | modeM0/AS1C07_001T01_9000006450_50874cztM0_level2.fits | modeM0/AS1C07_001T01_9000006450_50874cztM0_level2_quad_clean.evt |
| Size (bytes) | 624,608,640 | 107,971,200 |
| Size | 595.7 MB | 103.0 MB |
| Events in quadrant A | 6,714,667 | 678,954 |
| Events in quadrant B | 4,428,405 | 781,578 |
| Events in quadrant C | 5,161,913 | 663,555 |
| Events in quadrant D | 6,218,439 | 609,184 |
| Mode SS | |||
|---|---|---|---|
| Quadrant | BADHDUFLAG | Total packets | Discarded packets |
| A | 0 | 156 | 0 |
| B | 0 | 156 | 0 |
| C | 0 | 156 | 0 |
| D | 0 | 156 | 0 |
| Mode M0 | |||
|---|---|---|---|
| Quadrant | BADHDUFLAG | Total packets | Discarded packets |
| A | 0 | 25357 | 2 |
| B | 0 | 18560 | 2 |
| C | 0 | 20679 | 2 |
| D | 0 | 23861 | 2 |
| Mode M9 | |||
|---|---|---|---|
| Quadrant | BADHDUFLAG | Total packets | Discarded packets |
| A | 0 | 4 | 0 |
| B | 0 | 4 | 0 |
| C | 0 | 5 | 0 |
| D | 0 | 5 | 0 |
| Quadrant | Total seconds | Saturated seconds | Saturation percentage |
|---|---|---|---|
| A | 7704 | 787 | 10.215472% |
| B | 7704 | 330 | 4.283489% |
| C | 7704 | 555 | 7.204050% |
| D | 7704 | 749 | 9.722222% |
Noise dominated data is calculated using 1-second bins in cleaned event files. If a bin has >2000 counts, and if more than 50% of those come from <1% of pixels, then it is considered to be noise-dominated and hence unusable.
| Quadrant | # 1 sec bins | Bins with >0 counts | Bins with >2000 counts | High rate bins dominated by noise | Noise dominated (total time) | Noise dominated (detector-on time) | Marked lightcurve |
|---|---|---|---|---|---|---|---|
| A | 7844 | 7707 | 596 | 596 | 7.60% | 7.73% | 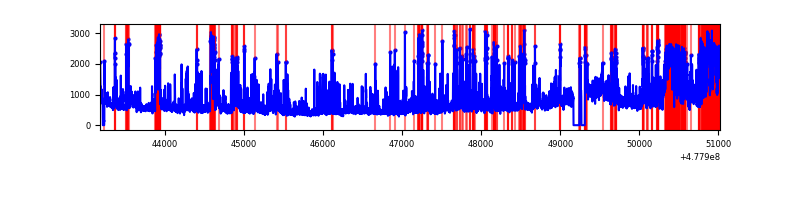 |
| B | 7844 | 7707 | 97 | 97 | 1.24% | 1.26% | 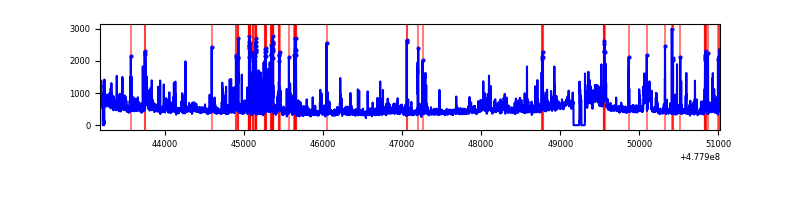 |
| C | 7844 | 7707 | 231 | 231 | 2.94% | 3.00% | 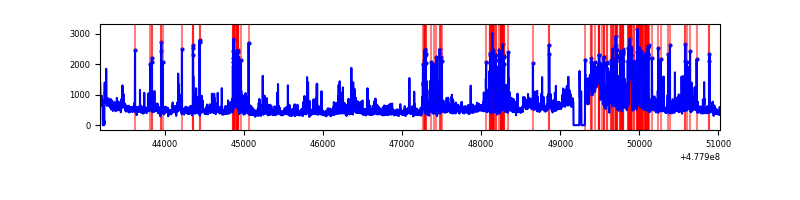 |
| D | 7844 | 7707 | 473 | 473 | 6.03% | 6.14% | 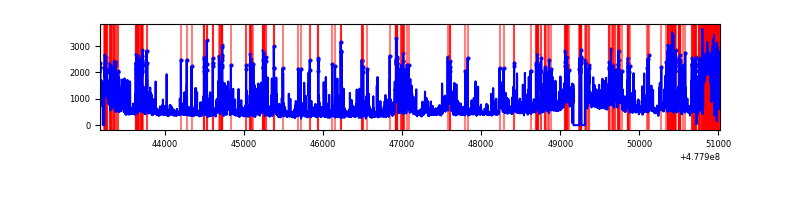 |
Top three noisy pixels from each quadrant. If the there are fewer than three noisy pixels in the level2.evt file, extra rows are filled as -1
| Pixel properties | Quadrant properties | ||||||
|---|---|---|---|---|---|---|---|
| Quadrant | DetID | PixID | Counts | Sigma | Mean | Median | Sigma |
| A | 4 | 4 | 661514 | 3310.36 | 811 | 790 | 199.6 |
| A | 7 | 206 | 512155 | 2562.04 | 811 | 790 | 199.6 |
| A | 12 | 80 | 440158 | 2201.32 | 811 | 790 | 199.6 |
| B | 0 | 172 | 162160 | 909.05 | 831 | 798 | 177.5 |
| B | 4 | 206 | 152010 | 851.87 | 831 | 798 | 177.5 |
| B | 10 | 247 | 142615 | 798.94 | 831 | 798 | 177.5 |
| C | 1 | 29 | 1040022 | 4745.2 | 807 | 799 | 219.0 |
| C | 5 | 10 | 329284 | 1499.9 | 807 | 799 | 219.0 |
| C | 10 | 171 | 199433 | 906.98 | 807 | 799 | 219.0 |
| D | 2 | 249 | 648252 | 2939.47 | 785 | 758 | 220.3 |
| D | 11 | 245 | 560328 | 2540.32 | 785 | 758 | 220.3 |
| D | 8 | 48 | 415643 | 1883.48 | 785 | 758 | 220.3 |
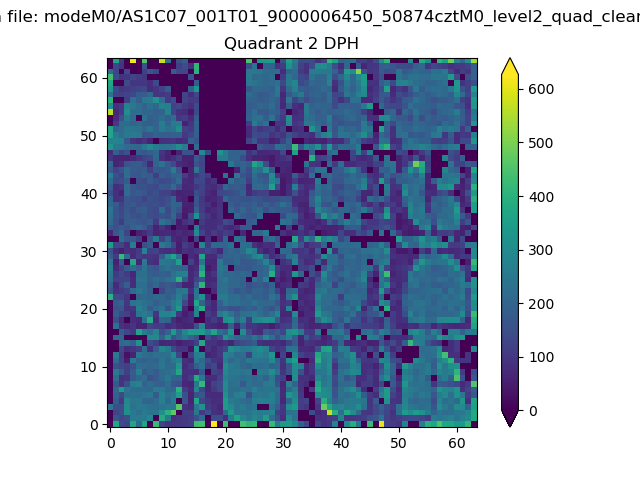
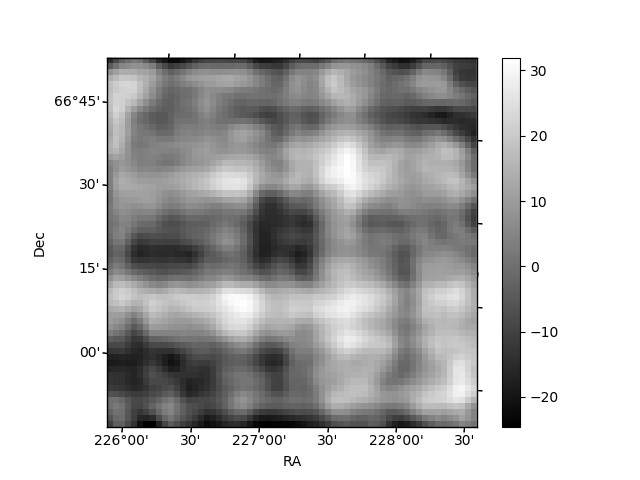
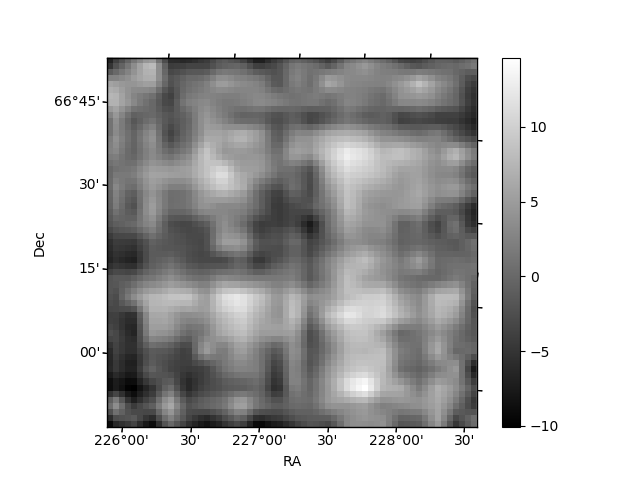
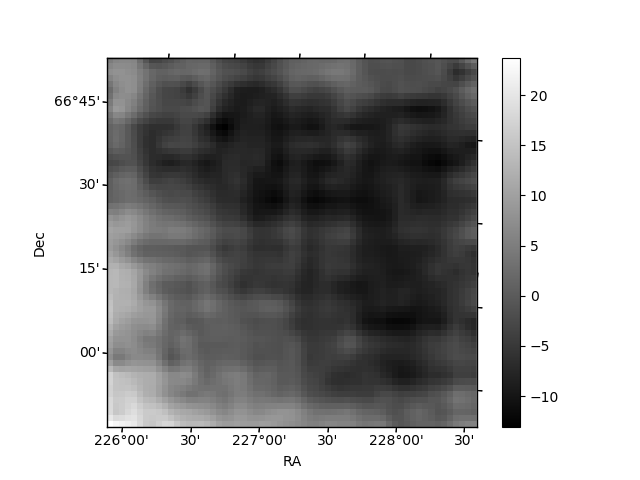
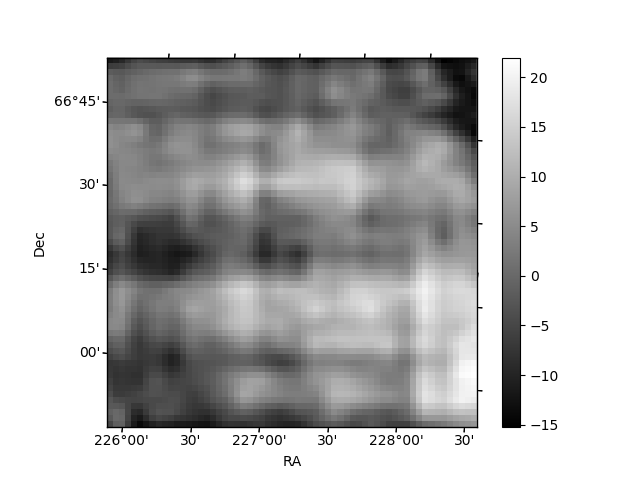
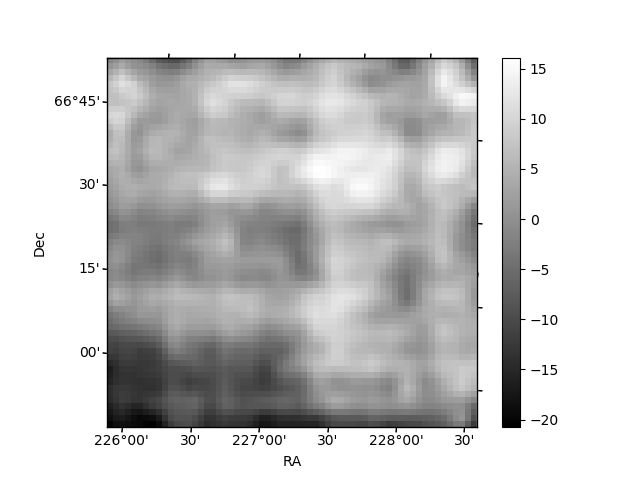
Histogram calculated using DETX and DETY for each event in the final _common_clean file
| Quadrant A | 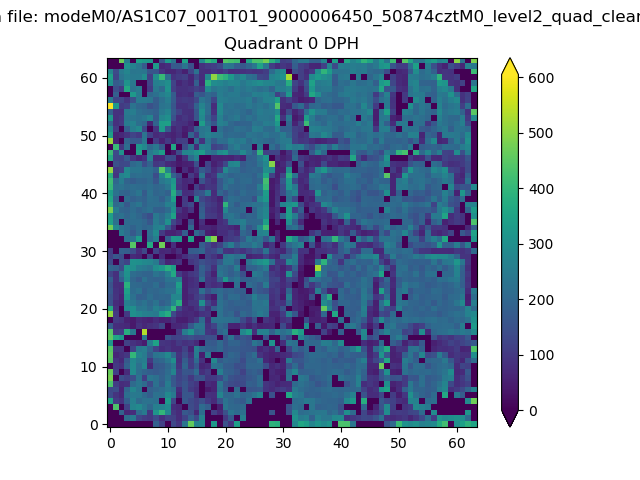 |
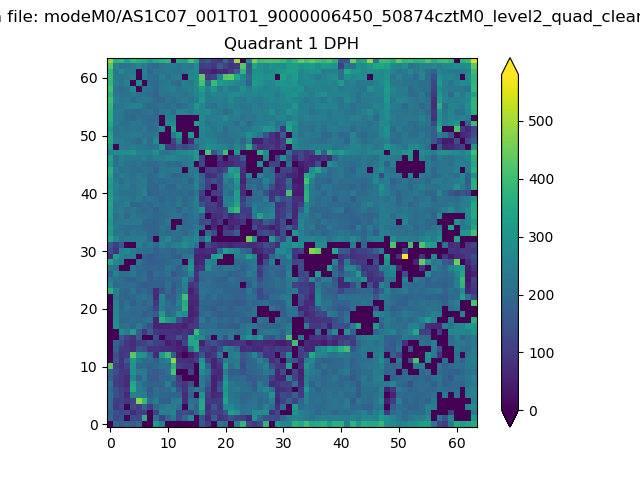 |
Quadrant B |
|---|---|---|---|
| Quadrant D | 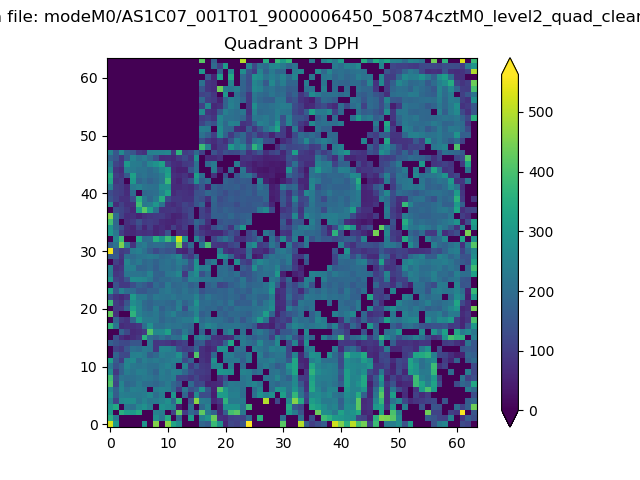 |
 |
Quadrant C |
| Plot type | Count rate plots | Images |
|---|---|---|
| Comparison with Poisson distribution Blue bars denote a histogram of data divided into 1 sec bins. Red curve is a Poisson curve with rate = median count rate of data. |
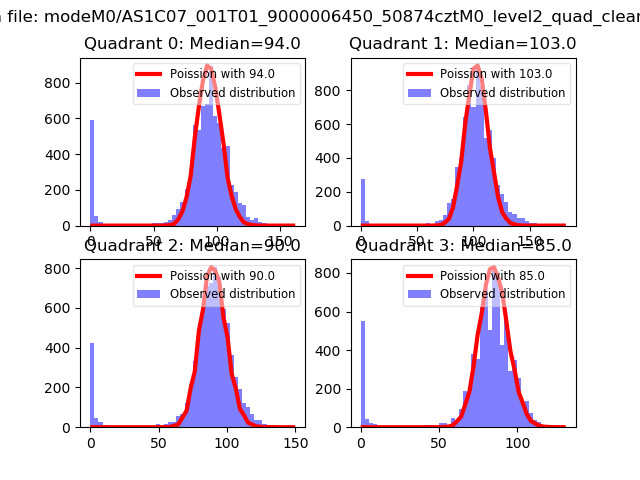 |
 |
| Quadrant-wise count rates Data is divided into 100 sec bins |
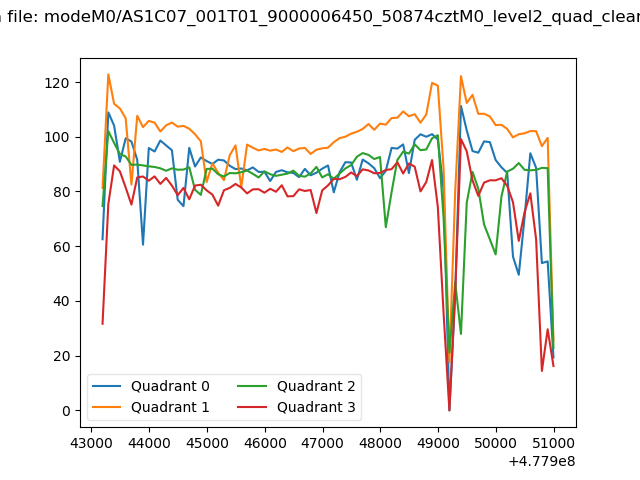 |
|
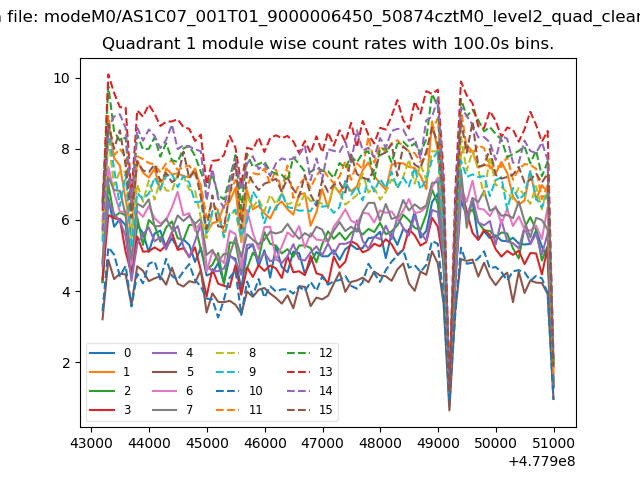
| Module-wise count rates for Quadrant A Data is divided into 100 sec bins |
 |
 |
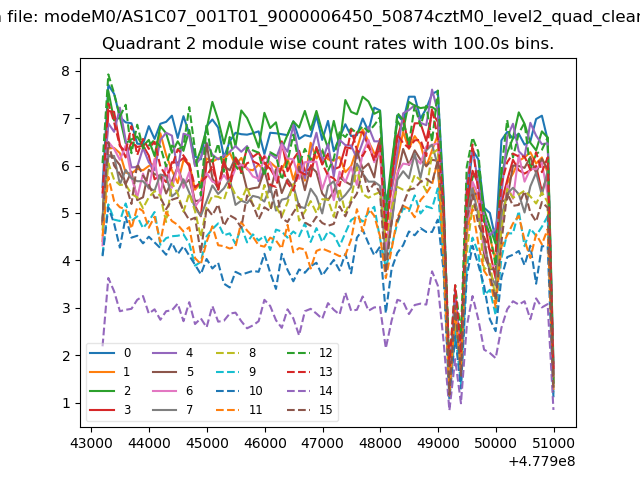
| Module-wise count rates for Quadrant B Data is divided into 100 sec bins |
 |
 |
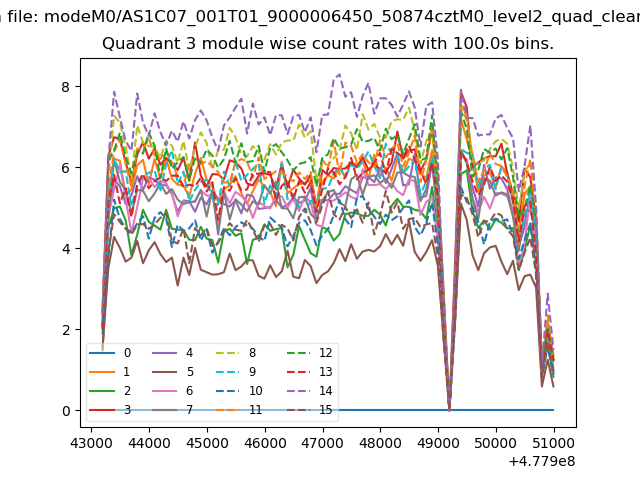
| Module-wise count rates for Quadrant C Data is divided into 100 sec bins |
 |
 |
| Module-wise count rates for Quadrant D Data is divided into 100 sec bins |
 |
 |
| Parameter | Plot |
|---|---|
| CZT HV Monitor | 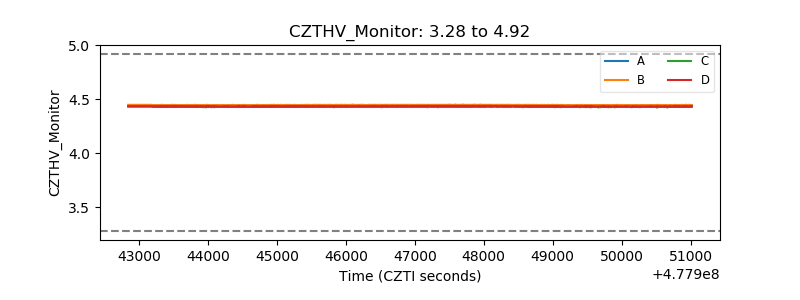 |
| D_VDD | 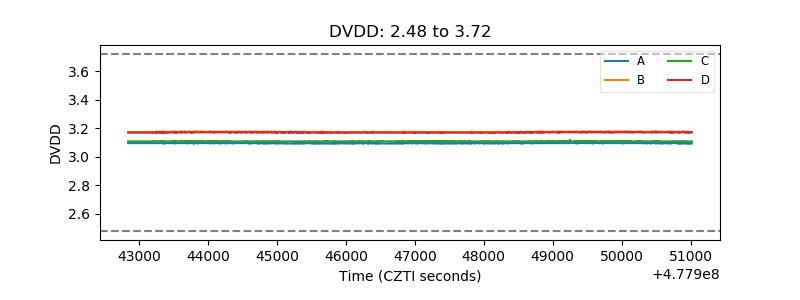 |
| Temperature 1 | 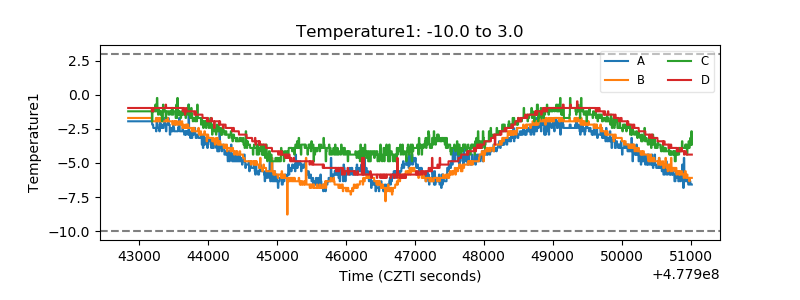 |
| Veto HV Monitor | 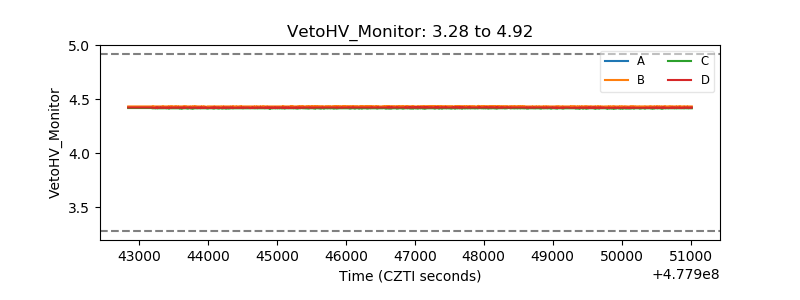 |
| Veto LLD | 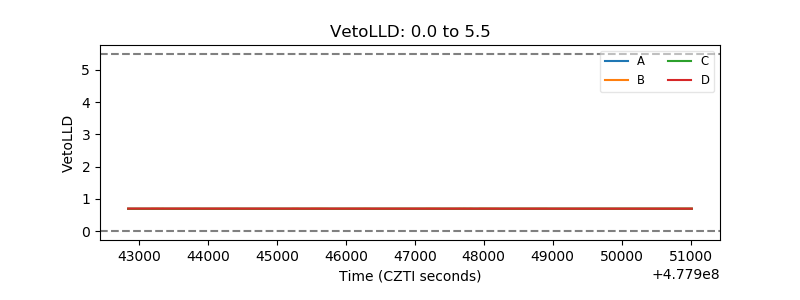 |
| Alpha Counter | 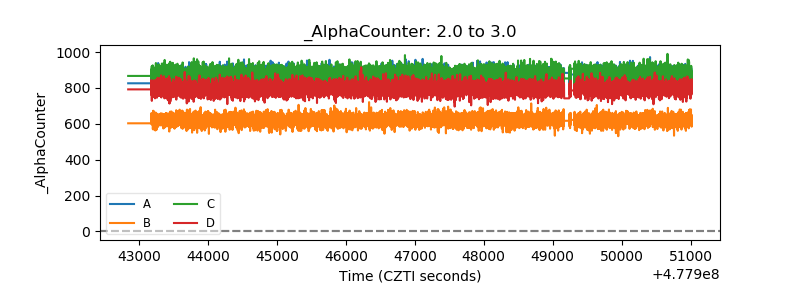 |
| _CPM_Rate | 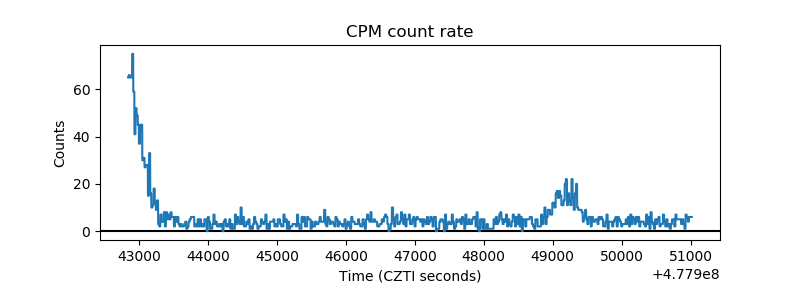 |
| CZT Counter | 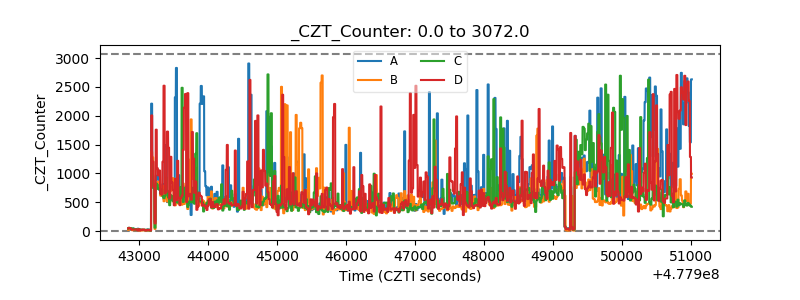 |
| +2.5 Volts monitor | 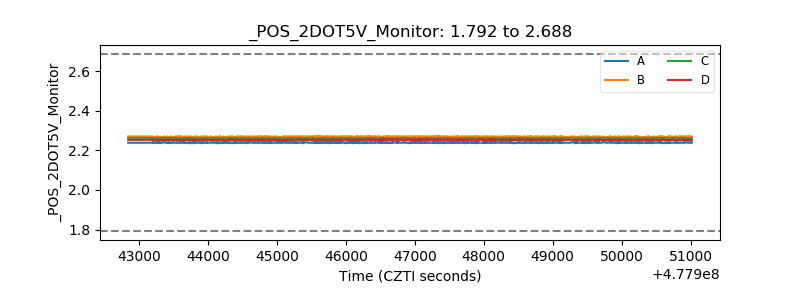 |
| +5 Volts monitor | 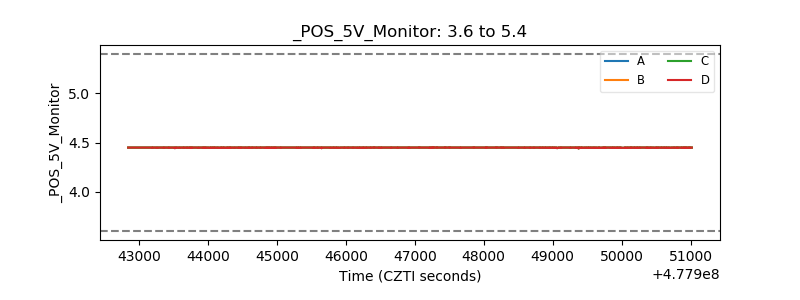 |
| _ROLL_ROT | 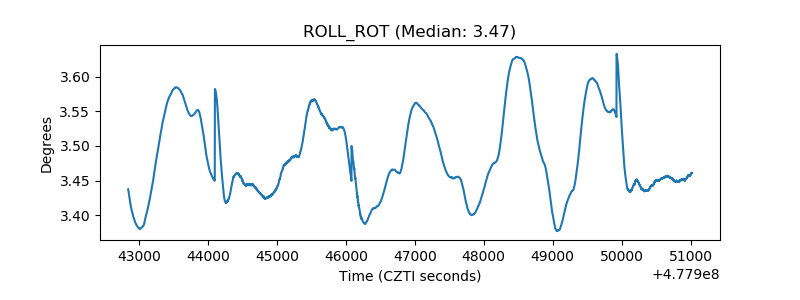 |
| _Roll_DEC | 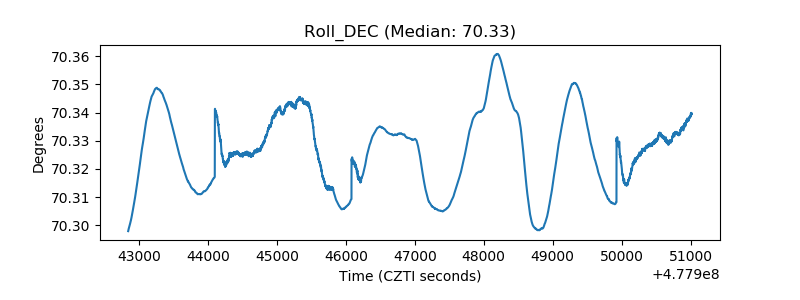 |
| _Roll_RA | 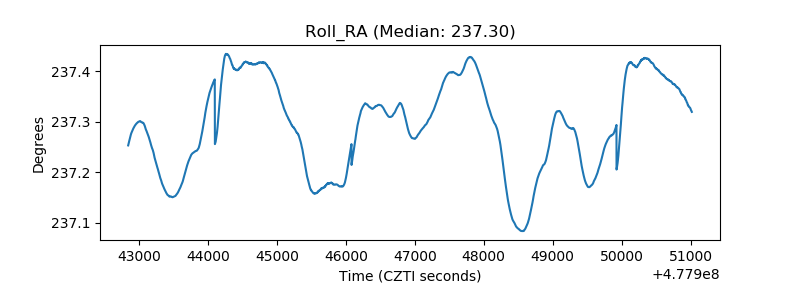 |
| Veto Counter | 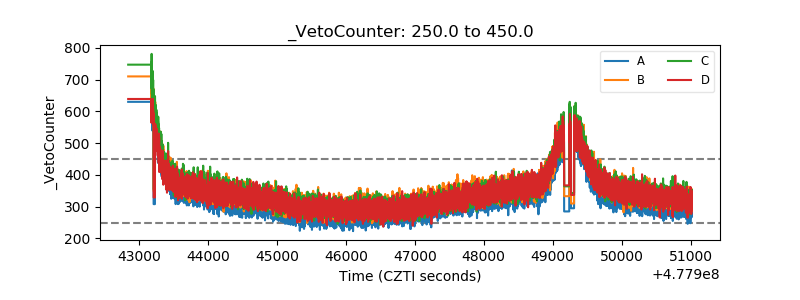 |