| Param | Original file | Final file |
|---|---|---|
| Filename | modeM0/AS1C07_001T01_9000006450_50875cztM0_level2.fits | modeM0/AS1C07_001T01_9000006450_50875cztM0_level2_quad_clean.evt |
| Size (bytes) | 716,235,840 | 104,250,240 |
| Size | 683.1 MB | 99.4 MB |
| Events in quadrant A | 8,592,961 | 633,429 |
| Events in quadrant B | 4,312,947 | 762,971 |
| Events in quadrant C | 5,490,604 | 649,190 |
| Events in quadrant D | 7,529,773 | 582,990 |
| Mode SS | |||
|---|---|---|---|
| Quadrant | BADHDUFLAG | Total packets | Discarded packets |
| A | 0 | 152 | 0 |
| B | 0 | 152 | 0 |
| C | 0 | 152 | 0 |
| D | 0 | 152 | 0 |
| Mode M0 | |||
|---|---|---|---|
| Quadrant | BADHDUFLAG | Total packets | Discarded packets |
| A | 0 | 30788 | 1 |
| B | 0 | 18053 | 0 |
| C | 0 | 21678 | 0 |
| D | 0 | 27719 | 0 |
| Quadrant | Total seconds | Saturated seconds | Saturation percentage |
|---|---|---|---|
| A | 7582 | 1136 | 14.982854% |
| B | 7583 | 181 | 2.386918% |
| C | 7583 | 465 | 6.132138% |
| D | 7583 | 768 | 10.127918% |
Noise dominated data is calculated using 1-second bins in cleaned event files. If a bin has >2000 counts, and if more than 50% of those come from <1% of pixels, then it is considered to be noise-dominated and hence unusable.
| Quadrant | # 1 sec bins | Bins with >0 counts | Bins with >2000 counts | High rate bins dominated by noise | Noise dominated (total time) | Noise dominated (detector-on time) | Marked lightcurve |
|---|---|---|---|---|---|---|---|
| A | 7582 | 7582 | 1029 | 1029 | 13.57% | 13.57% | 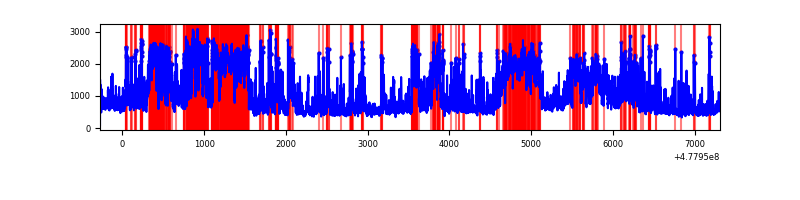 |
| B | 7583 | 7583 | 118 | 118 | 1.56% | 1.56% | 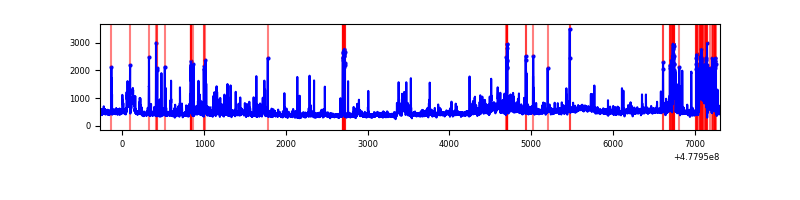 |
| C | 7583 | 7583 | 356 | 356 | 4.69% | 4.69% | 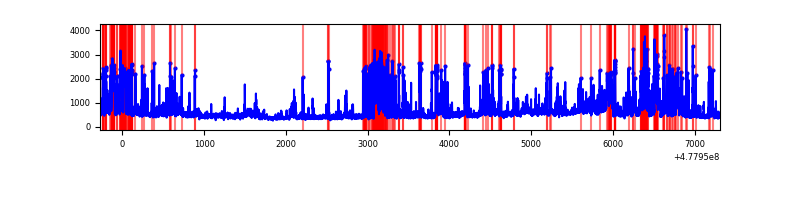 |
| D | 7583 | 7583 | 767 | 767 | 10.11% | 10.11% | 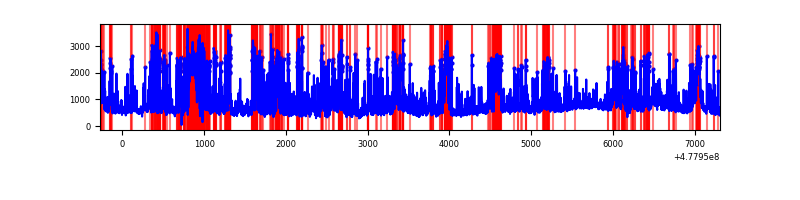 |
Top three noisy pixels from each quadrant. If the there are fewer than three noisy pixels in the level2.evt file, extra rows are filled as -1
| Pixel properties | Quadrant properties | ||||||
|---|---|---|---|---|---|---|---|
| Quadrant | DetID | PixID | Counts | Sigma | Mean | Median | Sigma |
| A | 12 | 80 | 2411343 | 12663.21 | 771 | 753 | 190.4 |
| A | 3 | 98 | 761123 | 3994.34 | 771 | 753 | 190.4 |
| A | 4 | 4 | 566375 | 2971.3 | 771 | 753 | 190.4 |
| B | 4 | 206 | 286892 | 1677.68 | 793 | 765 | 170.5 |
| B | 4 | 170 | 252388 | 1475.37 | 793 | 765 | 170.5 |
| B | 4 | 81 | 172247 | 1005.47 | 793 | 765 | 170.5 |
| C | 1 | 29 | 1058025 | 4980.79 | 768 | 759 | 212.3 |
| C | 5 | 10 | 274958 | 1291.75 | 768 | 759 | 212.3 |
| C | 13 | 3 | 240611 | 1129.94 | 768 | 759 | 212.3 |
| D | 11 | 245 | 853271 | 4122.65 | 747 | 724 | 206.8 |
| D | 2 | 216 | 547381 | 2643.46 | 747 | 724 | 206.8 |
| D | 2 | 62 | 473072 | 2284.13 | 747 | 724 | 206.8 |
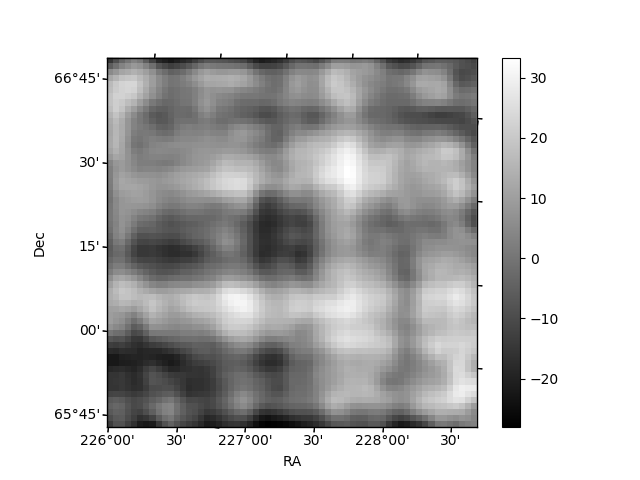
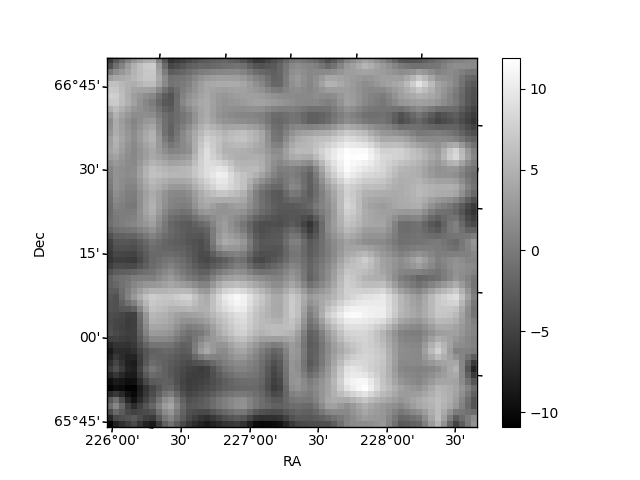
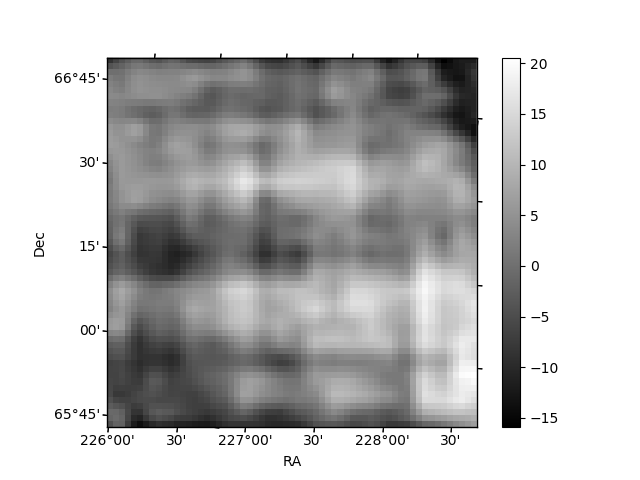
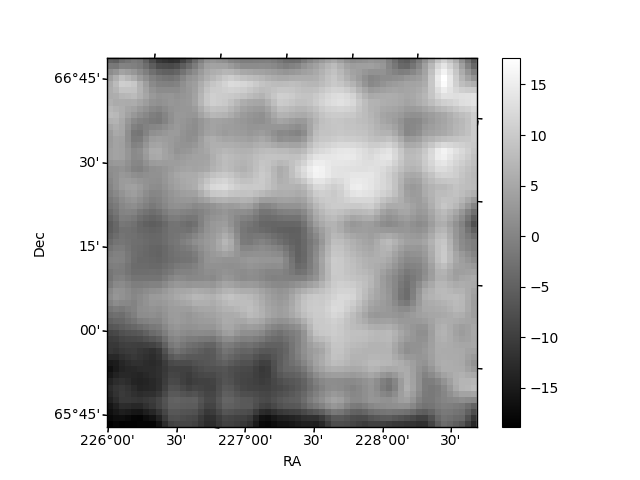
Histogram calculated using DETX and DETY for each event in the final _common_clean file
| Quadrant A | 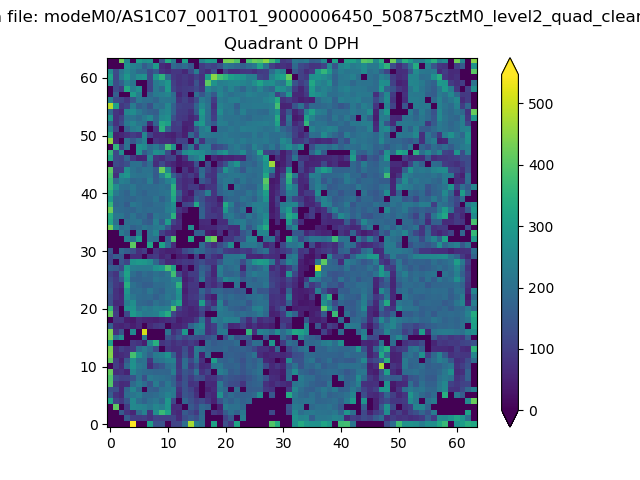 |
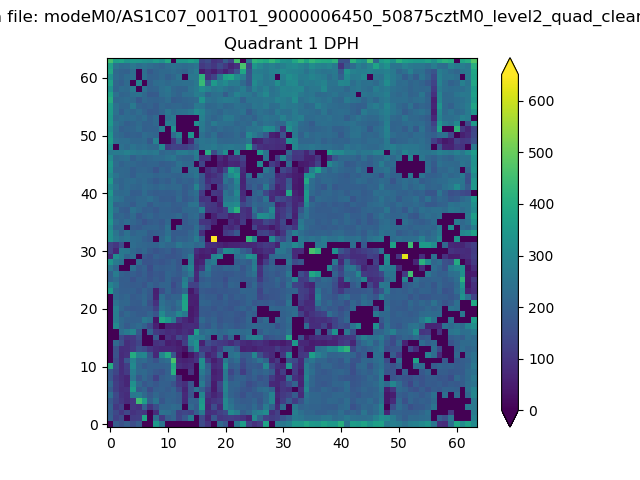 |
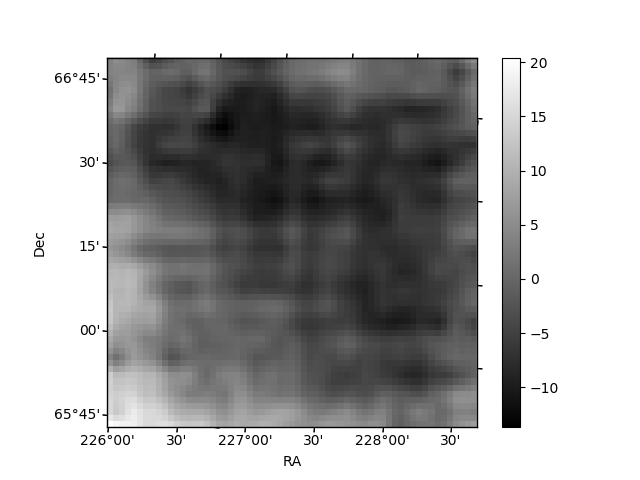
Quadrant B |
|---|---|---|---|
| Quadrant D | 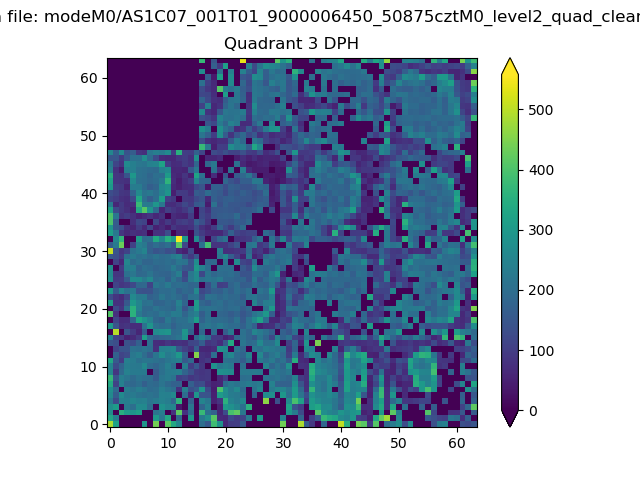 |
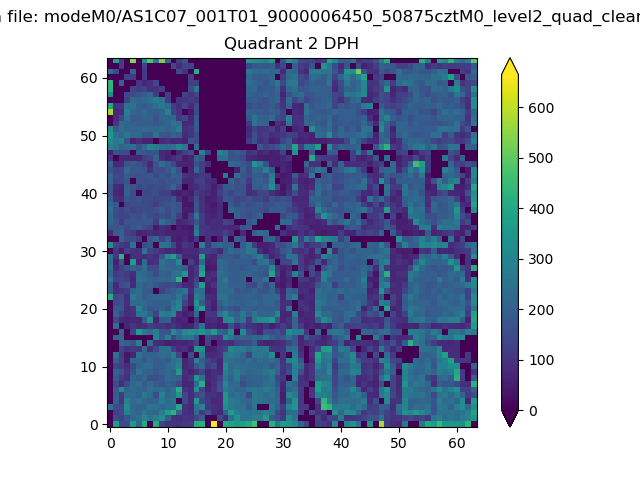 |
Quadrant C |
| Plot type | Count rate plots | Images |
|---|---|---|
| Comparison with Poisson distribution Blue bars denote a histogram of data divided into 1 sec bins. Red curve is a Poisson curve with rate = median count rate of data. |
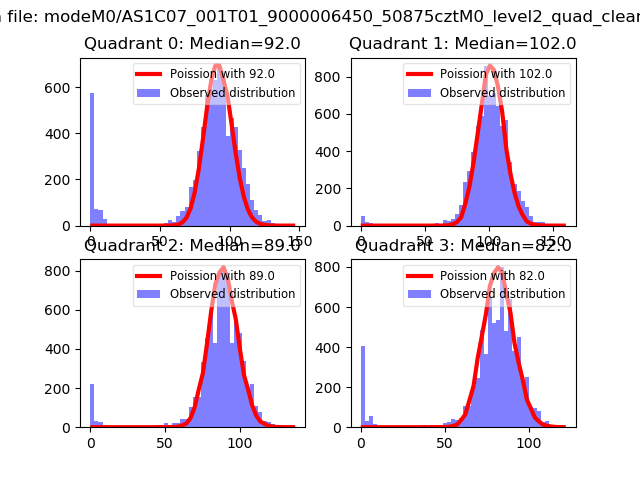 |
 |
| Quadrant-wise count rates Data is divided into 100 sec bins |
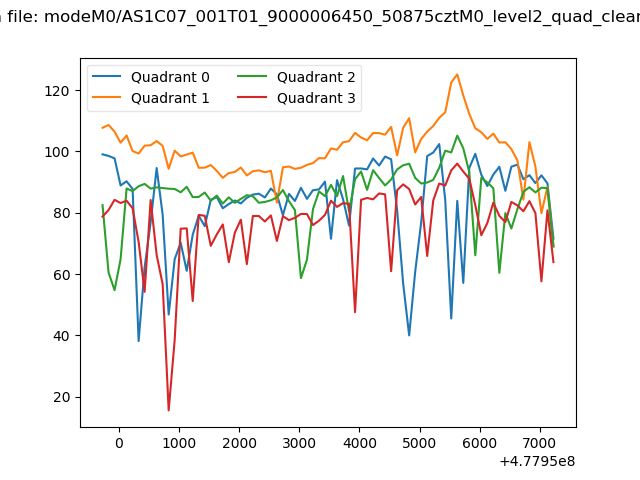 |
|
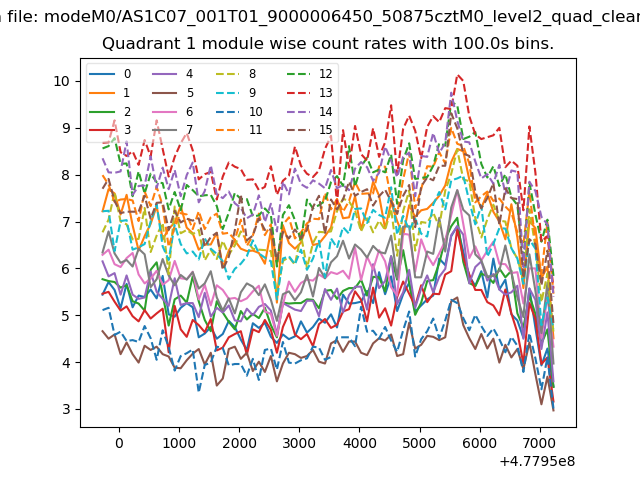
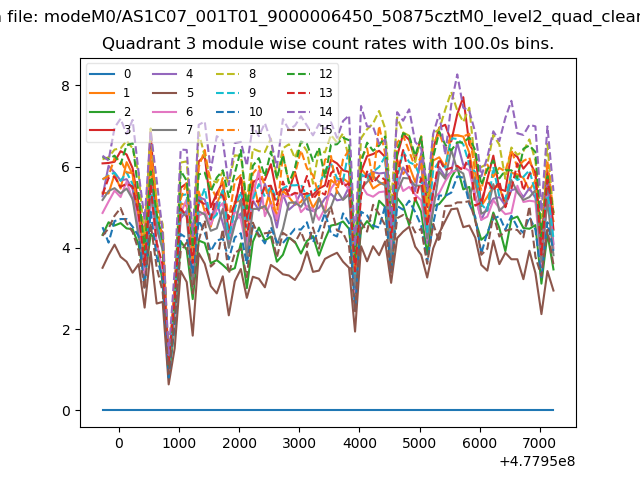
| Module-wise count rates for Quadrant A Data is divided into 100 sec bins |
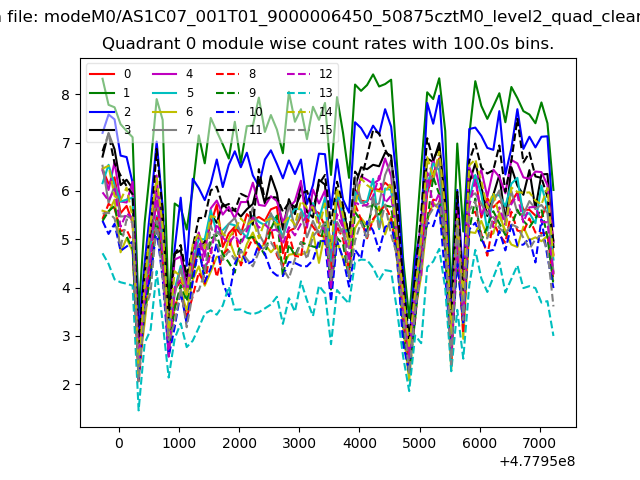 |
 |
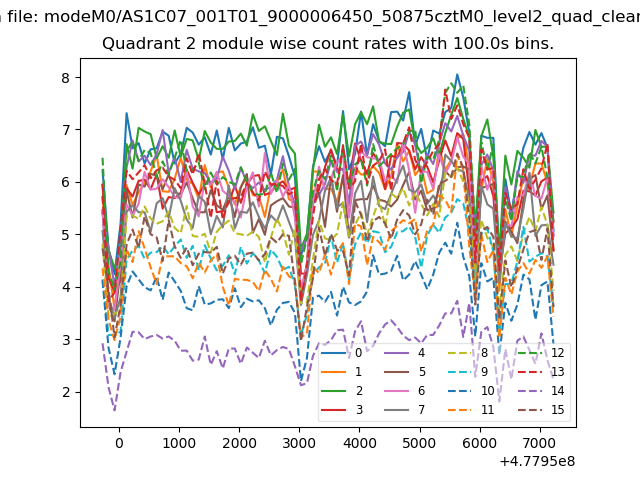
| Module-wise count rates for Quadrant B Data is divided into 100 sec bins |
 |
 |
| Module-wise count rates for Quadrant C Data is divided into 100 sec bins |
 |
 |
| Module-wise count rates for Quadrant D Data is divided into 100 sec bins |
 |
 |
| Parameter | Plot |
|---|---|
| CZT HV Monitor |  |
| D_VDD | 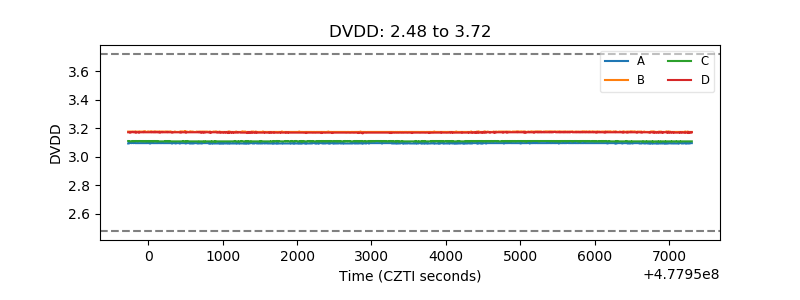 |
| Temperature 1 | 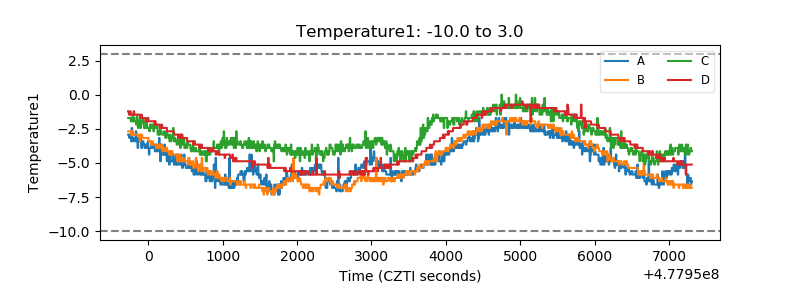 |
| Veto HV Monitor | 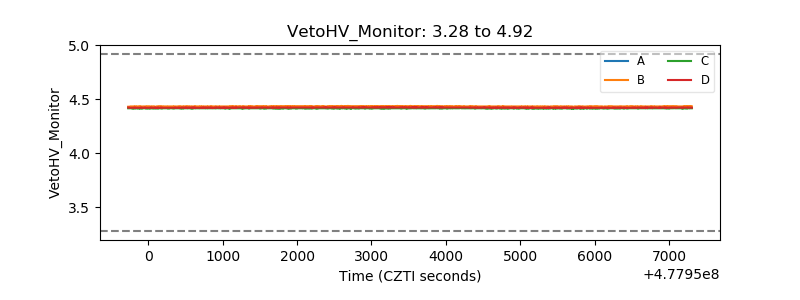 |
| Veto LLD | 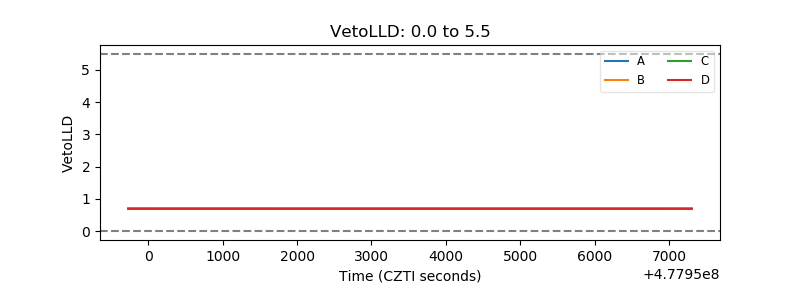 |
| Alpha Counter | 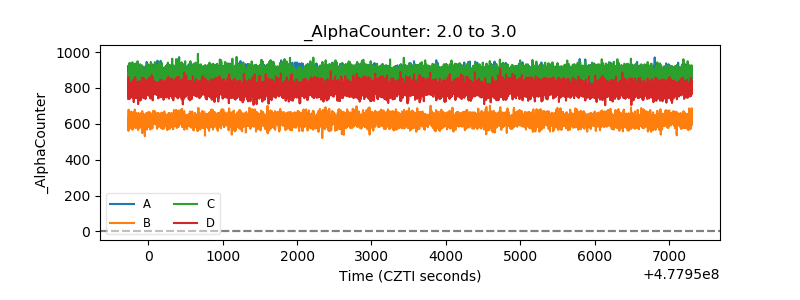 |
| _CPM_Rate | 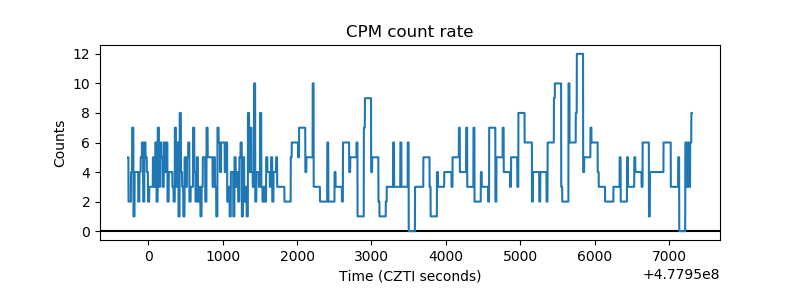 |
| CZT Counter | 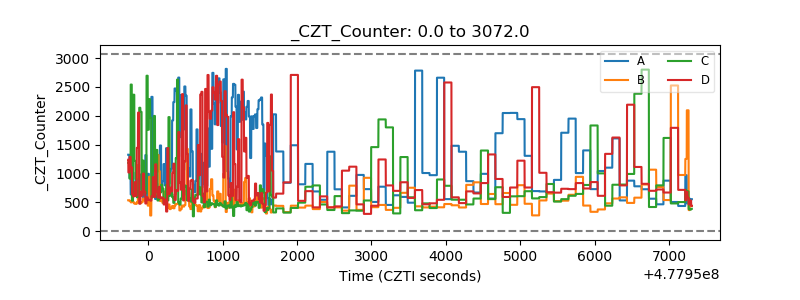 |
| +2.5 Volts monitor | 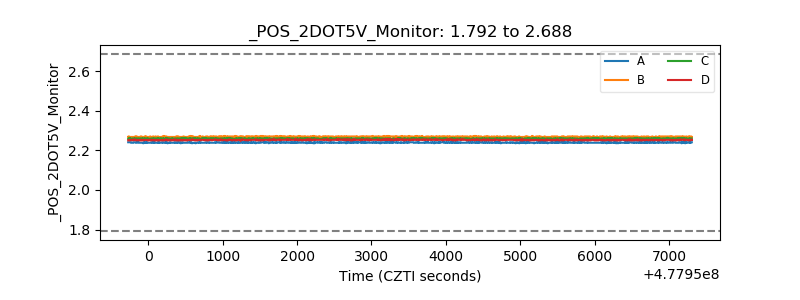 |
| +5 Volts monitor |  |
| _ROLL_ROT | 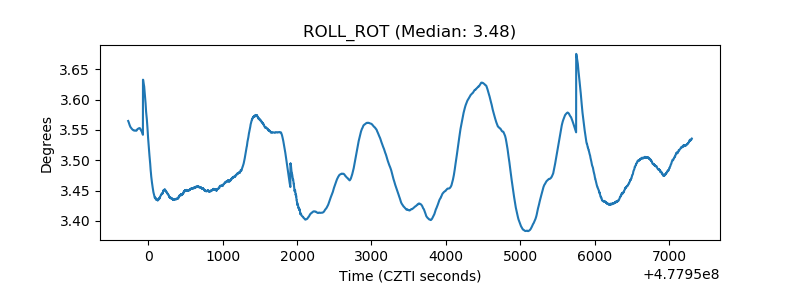 |
| _Roll_DEC | 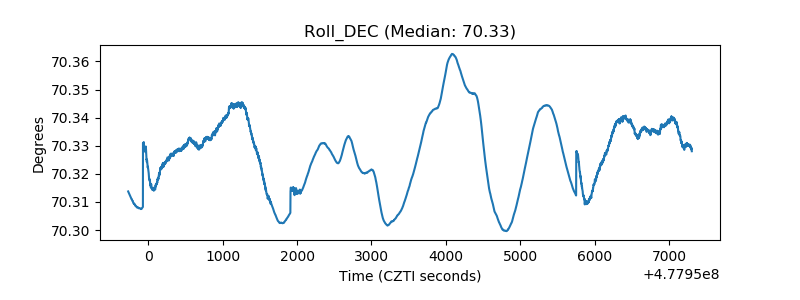 |
| _Roll_RA | 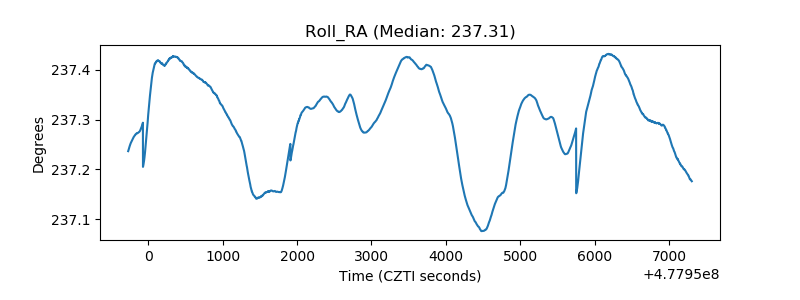 |
| Veto Counter | 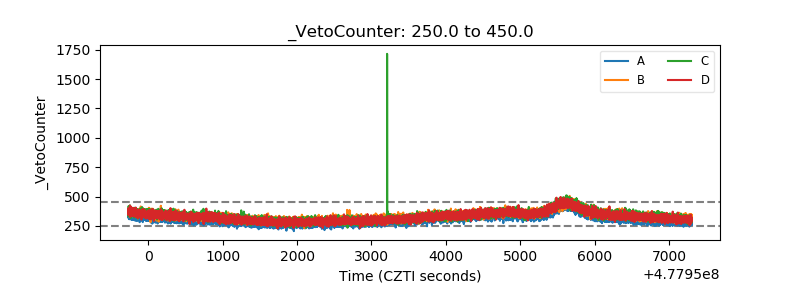 |