| Param | Original file | Final file |
|---|---|---|
| Filename | modeM0/AS1C07_001T01_9000006450_50876cztM0_level2.fits | modeM0/AS1C07_001T01_9000006450_50876cztM0_level2_quad_clean.evt |
| Size (bytes) | 731,116,800 | 113,002,560 |
| Size | 697.2 MB | 107.8 MB |
| Events in quadrant A | 6,592,239 | 742,812 |
| Events in quadrant B | 4,360,230 | 835,200 |
| Events in quadrant C | 8,419,004 | 607,210 |
| Events in quadrant D | 7,055,573 | 665,076 |
| Mode SS | |||
|---|---|---|---|
| Quadrant | BADHDUFLAG | Total packets | Discarded packets |
| A | 0 | 164 | 0 |
| B | 0 | 164 | 0 |
| C | 0 | 164 | 0 |
| D | 0 | 164 | 0 |
| Mode M0 | |||
|---|---|---|---|
| Quadrant | BADHDUFLAG | Total packets | Discarded packets |
| A | 0 | 25305 | 0 |
| B | 0 | 18657 | 0 |
| C | 0 | 30863 | 0 |
| D | 0 | 26659 | 0 |
| Quadrant | Total seconds | Saturated seconds | Saturation percentage |
|---|---|---|---|
| A | 8220 | 502 | 6.107056% |
| B | 8220 | 149 | 1.812652% |
| C | 8220 | 1602 | 19.489051% |
| D | 8219 | 496 | 6.034797% |
Noise dominated data is calculated using 1-second bins in cleaned event files. If a bin has >2000 counts, and if more than 50% of those come from <1% of pixels, then it is considered to be noise-dominated and hence unusable.
| Quadrant | # 1 sec bins | Bins with >0 counts | Bins with >2000 counts | High rate bins dominated by noise | Noise dominated (total time) | Noise dominated (detector-on time) | Marked lightcurve |
|---|---|---|---|---|---|---|---|
| A | 8220 | 8220 | 223 | 223 | 2.71% | 2.71% |  |
| B | 8220 | 8220 | 83 | 83 | 1.01% | 1.01% | 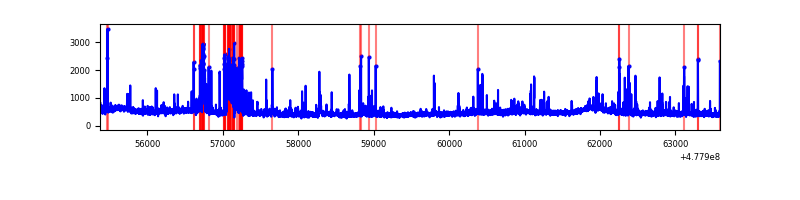 |
| C | 8220 | 8220 | 1134 | 1134 | 13.80% | 13.80% | 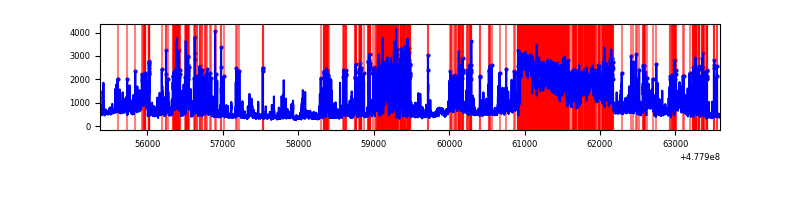 |
| D | 8219 | 8219 | 485 | 485 | 5.90% | 5.90% | 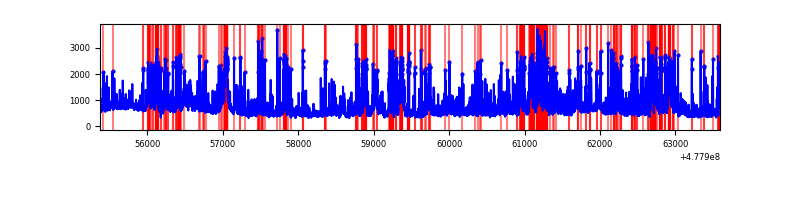 |
Top three noisy pixels from each quadrant. If the there are fewer than three noisy pixels in the level2.evt file, extra rows are filled as -1
| Pixel properties | Quadrant properties | ||||||
|---|---|---|---|---|---|---|---|
| Quadrant | DetID | PixID | Counts | Sigma | Mean | Median | Sigma |
| A | 4 | 156 | 668530 | 3070.69 | 871 | 849 | 217.4 |
| A | 7 | 206 | 519899 | 2387.13 | 871 | 849 | 217.4 |
| A | 4 | 4 | 388746 | 1783.95 | 871 | 849 | 217.4 |
| B | 4 | 206 | 257813 | 1370.81 | 880 | 846 | 187.5 |
| B | 4 | 170 | 166776 | 885.17 | 880 | 846 | 187.5 |
| B | 4 | 81 | 136164 | 721.86 | 880 | 846 | 187.5 |
| C | 4 | 210 | 1614032 | 7505.59 | 782 | 777 | 214.9 |
| C | 15 | 147 | 900061 | 4183.87 | 782 | 777 | 214.9 |
| C | 1 | 29 | 872514 | 4055.71 | 782 | 777 | 214.9 |
| D | 15 | 185 | 525977 | 2272.62 | 841 | 814 | 231.1 |
| D | 2 | 216 | 466749 | 2016.32 | 841 | 814 | 231.1 |
| D | 2 | 249 | 464696 | 2007.43 | 841 | 814 | 231.1 |
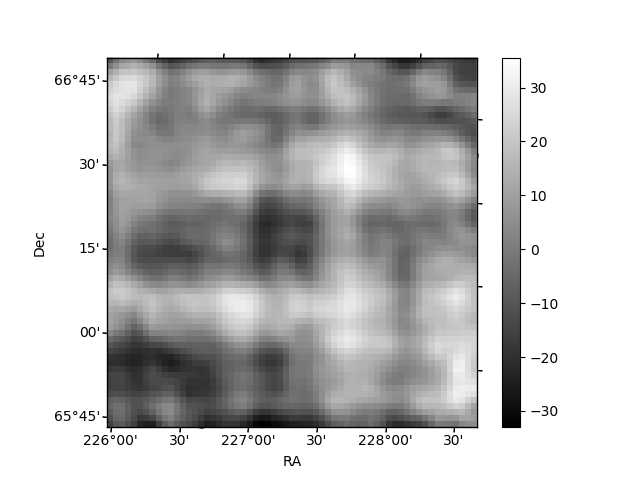
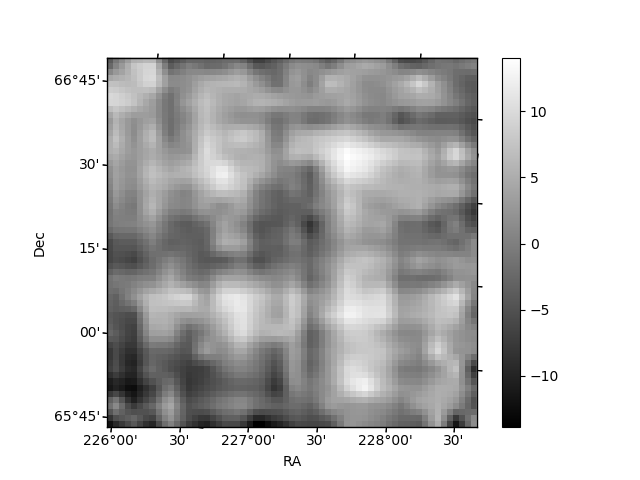
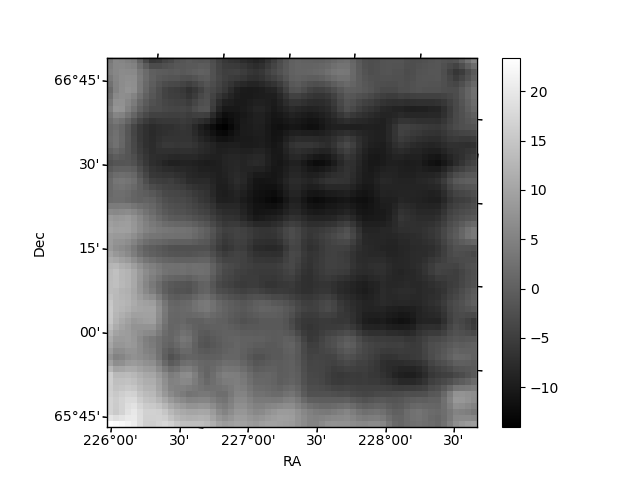
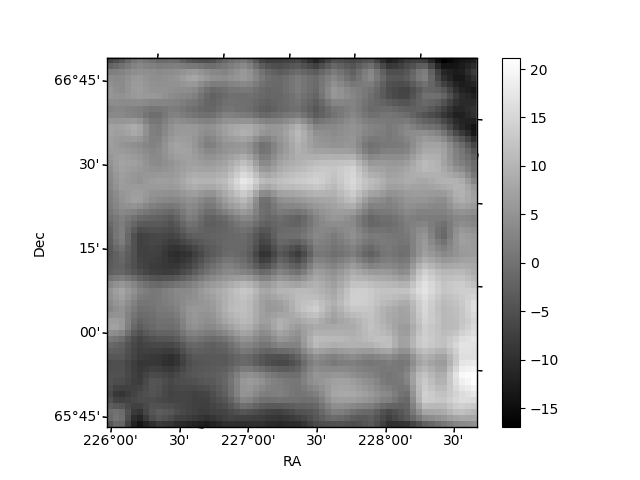
Histogram calculated using DETX and DETY for each event in the final _common_clean file
| Quadrant A | 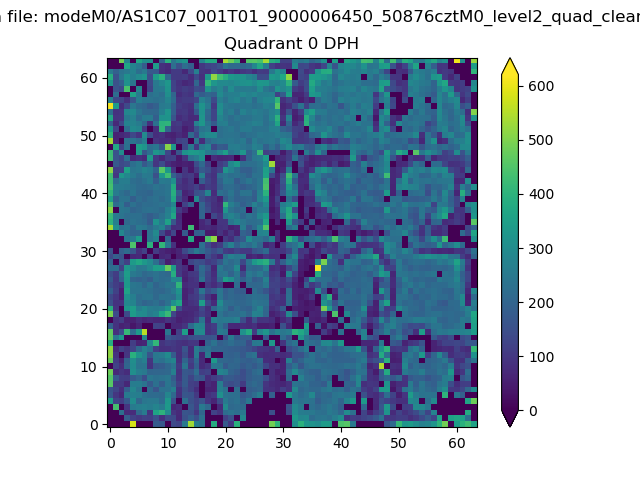 |
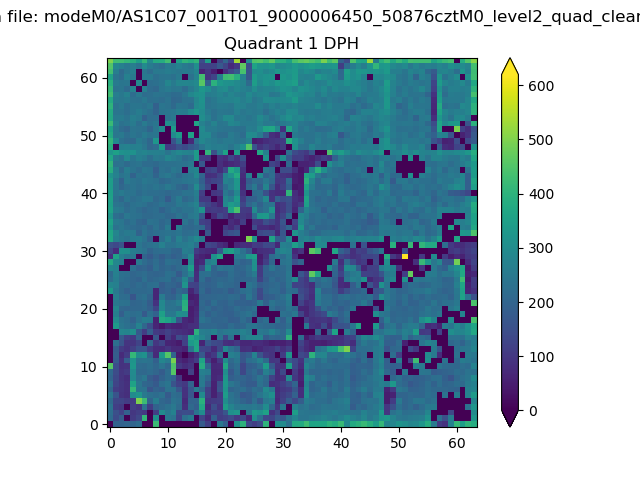 |
Quadrant B |
|---|---|---|---|
| Quadrant D | 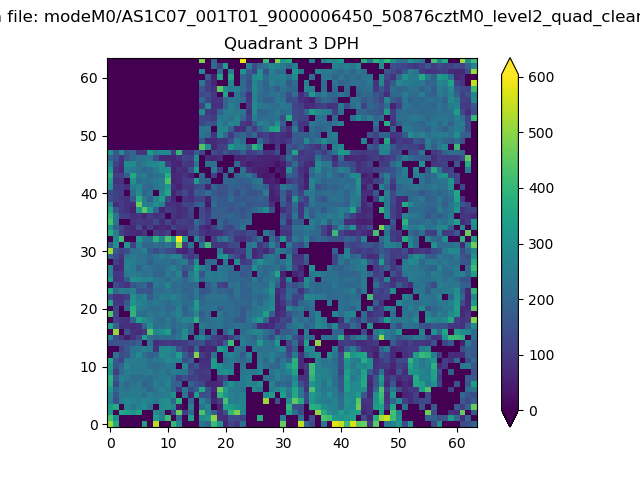 |
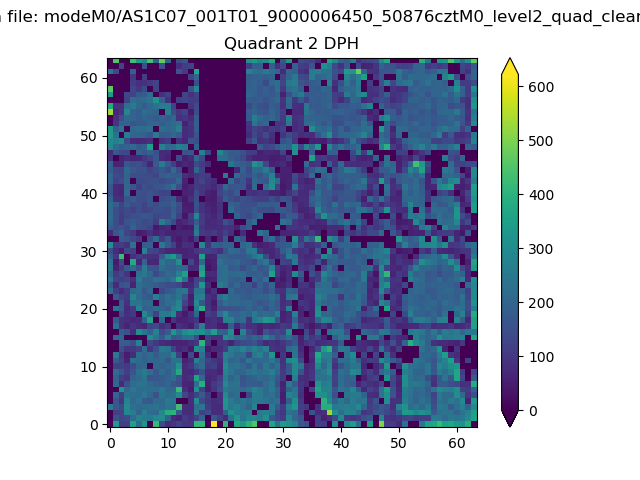 |
Quadrant C |
| Plot type | Count rate plots | Images |
|---|---|---|
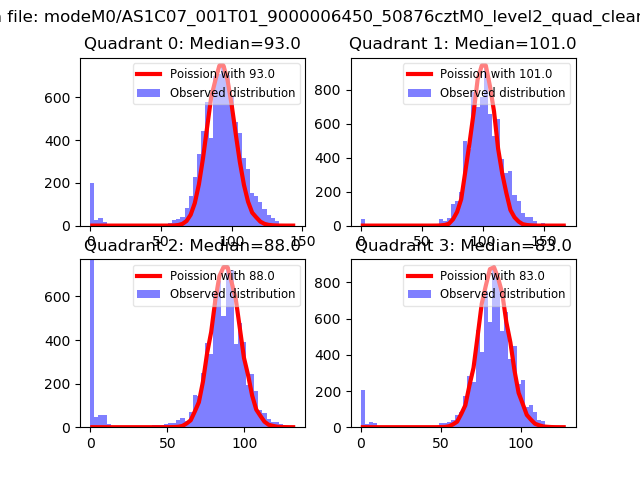
| Comparison with Poisson distribution Blue bars denote a histogram of data divided into 1 sec bins. Red curve is a Poisson curve with rate = median count rate of data. |
 |
 |
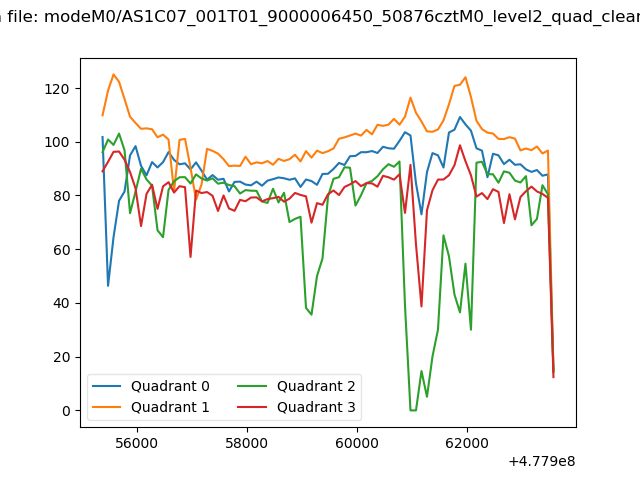
| Quadrant-wise count rates Data is divided into 100 sec bins |
 |
|
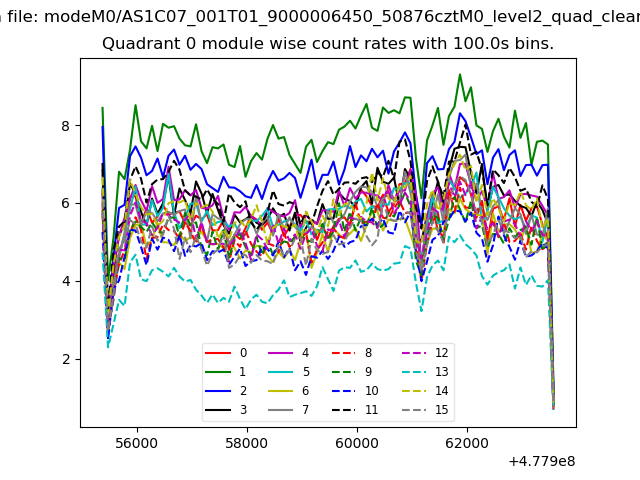
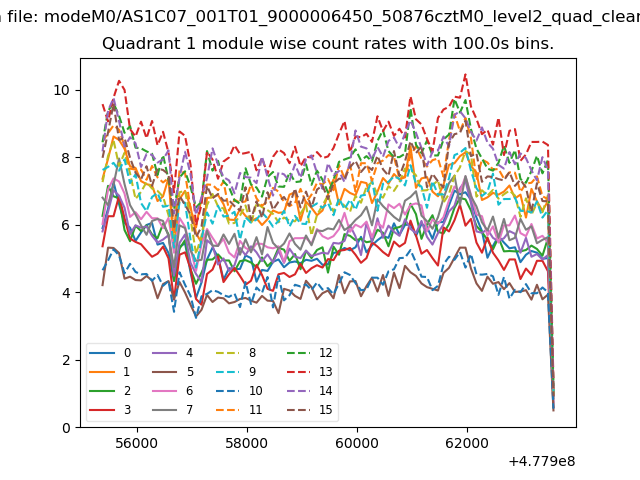
| Module-wise count rates for Quadrant A Data is divided into 100 sec bins |
 |
 |
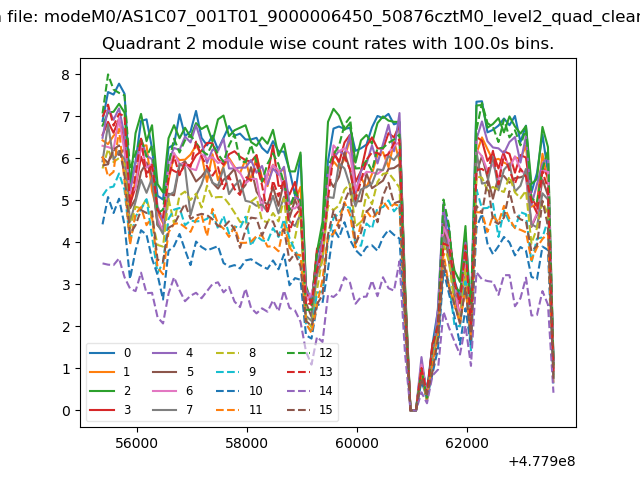
| Module-wise count rates for Quadrant B Data is divided into 100 sec bins |
 |
 |
| Module-wise count rates for Quadrant C Data is divided into 100 sec bins |
 |
 |
| Module-wise count rates for Quadrant D Data is divided into 100 sec bins |
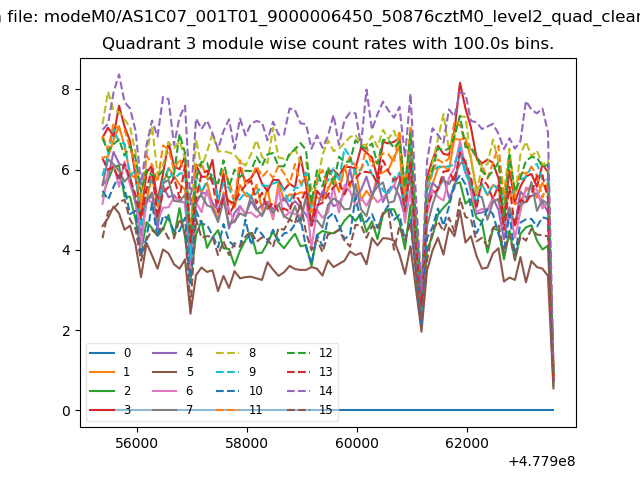 |
 |
| Parameter | Plot |
|---|---|
| CZT HV Monitor | 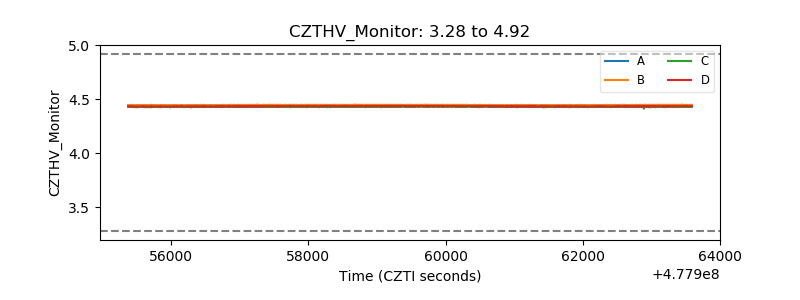 |
| D_VDD | 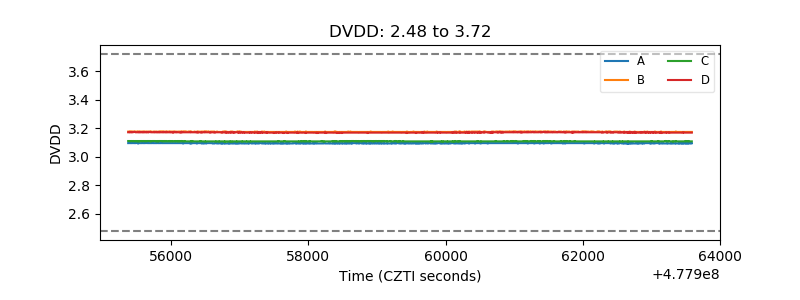 |
| Temperature 1 | 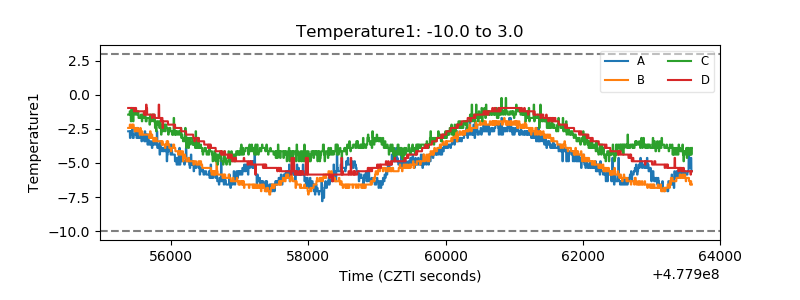 |
| Veto HV Monitor | 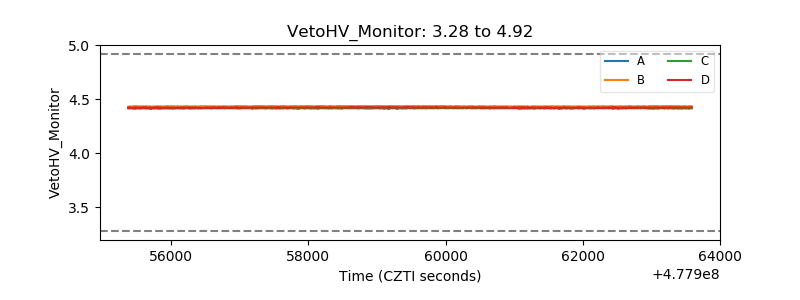 |
| Veto LLD | 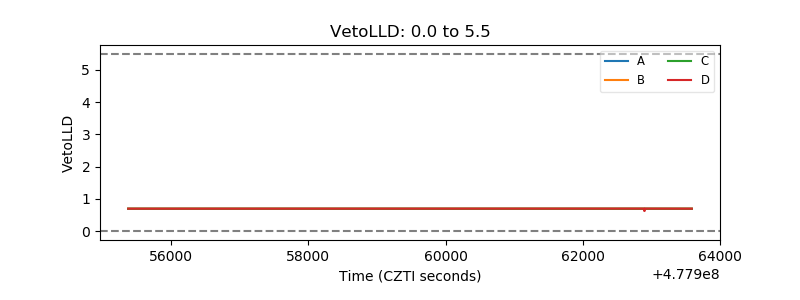 |
| Alpha Counter | 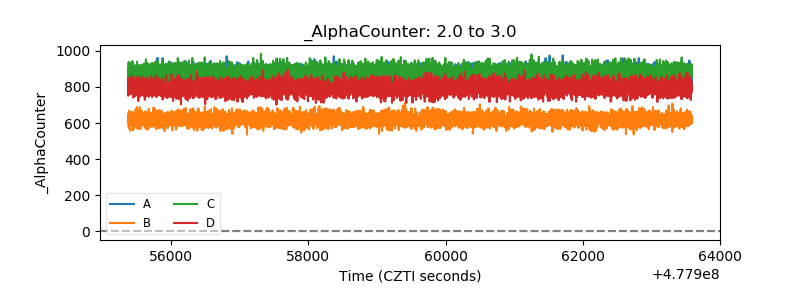 |
| _CPM_Rate | 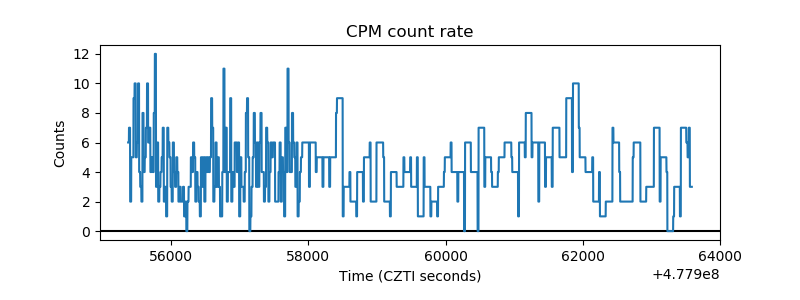 |
| CZT Counter | 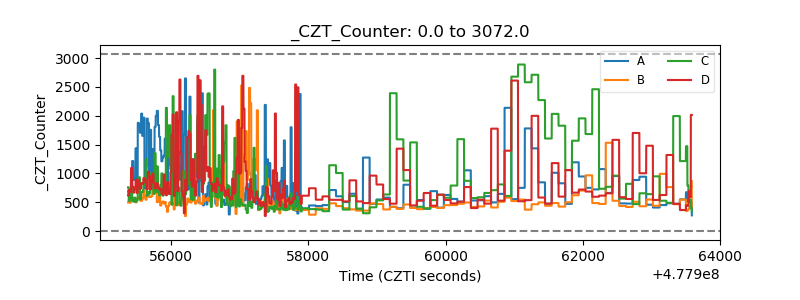 |
| +2.5 Volts monitor | 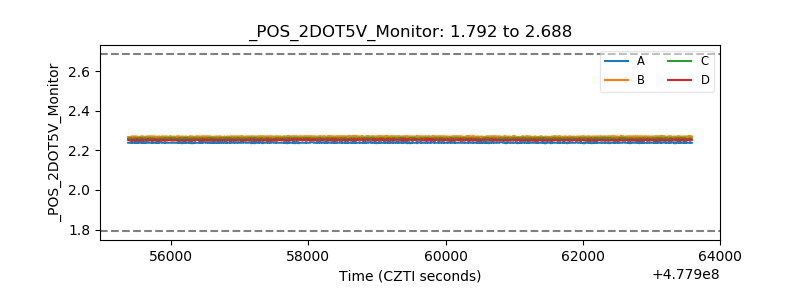 |
| +5 Volts monitor | 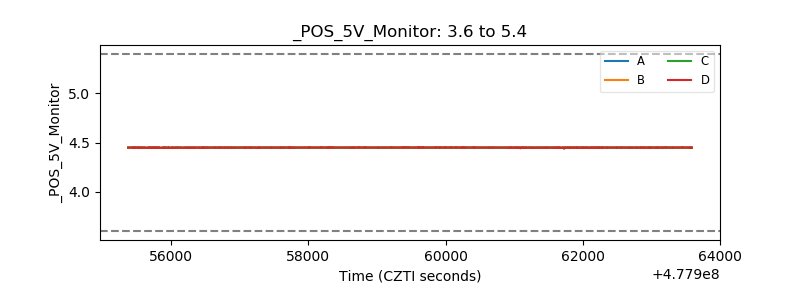 |
| _ROLL_ROT | 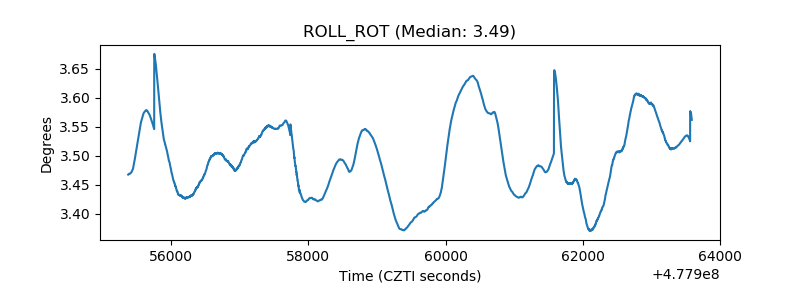 |
| _Roll_DEC | 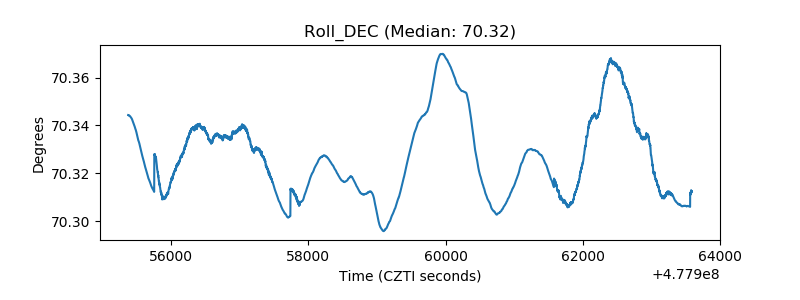 |
| _Roll_RA | 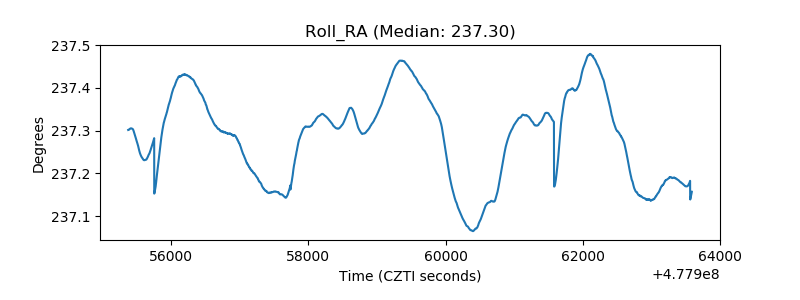 |
| Veto Counter | 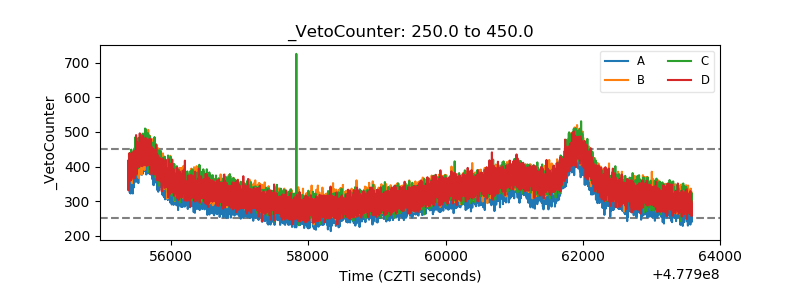 |