| Param | Original file | Final file |
|---|---|---|
| Filename | modeM0/AS1C07_001T01_9000006450_50879cztM0_level2.fits | modeM0/AS1C07_001T01_9000006450_50879cztM0_level2_quad_clean.evt |
| Size (bytes) | 1,708,332,480 | 266,474,880 |
| Size | 1.6 GB | 254.1 MB |
| Events in quadrant A | 14,445,963 | 1,795,427 |
| Events in quadrant B | 10,027,866 | 2,000,076 |
| Events in quadrant C | 20,760,586 | 1,348,937 |
| Events in quadrant D | 16,441,994 | 1,532,219 |
| Mode SS | |||
|---|---|---|---|
| Quadrant | BADHDUFLAG | Total packets | Discarded packets |
| A | 0 | 406 | 0 |
| B | 0 | 406 | 0 |
| C | 0 | 406 | 0 |
| D | 0 | 406 | 0 |
| Mode M0 | |||
|---|---|---|---|
| Quadrant | BADHDUFLAG | Total packets | Discarded packets |
| A | 0 | 56697 | 3 |
| B | 0 | 44336 | 3 |
| C | 0 | 75677 | 3 |
| D | 0 | 63257 | 3 |
| Mode M9 | |||
|---|---|---|---|
| Quadrant | BADHDUFLAG | Total packets | Discarded packets |
| A | 0 | 12 | 0 |
| B | 0 | 12 | 0 |
| C | 0 | 12 | 0 |
| D | 0 | 12 | 0 |
| Quadrant | Total seconds | Saturated seconds | Saturation percentage |
|---|---|---|---|
| A | 20197 | 797 | 3.946131% |
| B | 20198 | 347 | 1.717992% |
| C | 20198 | 4446 | 22.012080% |
| D | 20198 | 1716 | 8.495891% |
Noise dominated data is calculated using 1-second bins in cleaned event files. If a bin has >2000 counts, and if more than 50% of those come from <1% of pixels, then it is considered to be noise-dominated and hence unusable.
| Quadrant | # 1 sec bins | Bins with >0 counts | Bins with >2000 counts | High rate bins dominated by noise | Noise dominated (total time) | Noise dominated (detector-on time) | Marked lightcurve |
|---|---|---|---|---|---|---|---|
| A | 21347 | 20200 | 548 | 548 | 2.57% | 2.71% | 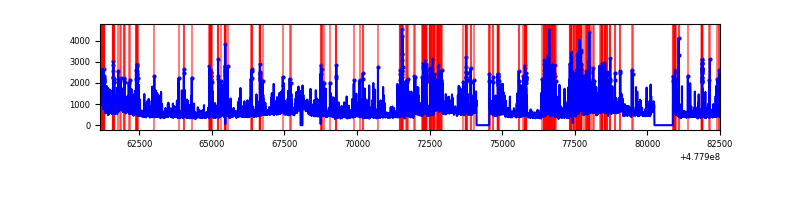 |
| B | 21348 | 20201 | 77 | 77 | 0.36% | 0.38% | 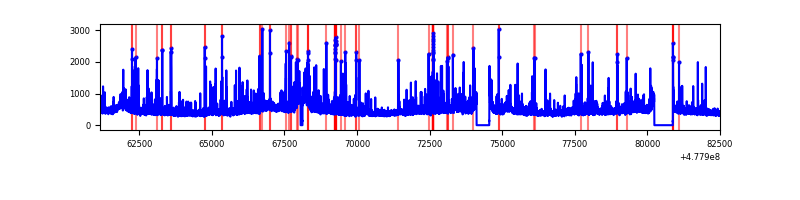 |
| C | 21348 | 20201 | 2722 | 2722 | 12.75% | 13.47% | 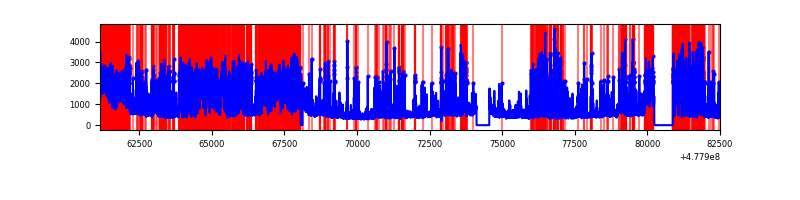 |
| D | 21348 | 20201 | 1424 | 1424 | 6.67% | 7.05% | 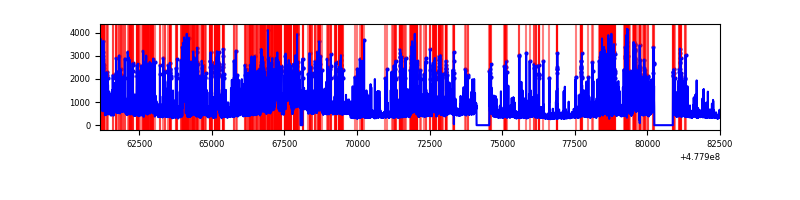 |
Top three noisy pixels from each quadrant. If the there are fewer than three noisy pixels in the level2.evt file, extra rows are filled as -1
| Pixel properties | Quadrant properties | ||||||
|---|---|---|---|---|---|---|---|
| Quadrant | DetID | PixID | Counts | Sigma | Mean | Median | Sigma |
| A | 4 | 4 | 1191344 | 2242.26 | 2136 | 2076 | 530.4 |
| A | 4 | 249 | 884876 | 1664.45 | 2136 | 2076 | 530.4 |
| A | 7 | 206 | 724150 | 1361.41 | 2136 | 2076 | 530.4 |
| B | 4 | 81 | 277183 | 600.57 | 2147 | 2065 | 458.1 |
| B | 4 | 170 | 218243 | 471.91 | 2147 | 2065 | 458.1 |
| B | 4 | 206 | 177835 | 383.7 | 2147 | 2065 | 458.1 |
| C | 4 | 210 | 4850043 | 9272.96 | 1885 | 1864 | 522.8 |
| C | 1 | 29 | 1710056 | 3267.2 | 1885 | 1864 | 522.8 |
| C | 13 | 3 | 1180978 | 2255.25 | 1885 | 1864 | 522.8 |
| D | 2 | 216 | 1447716 | 2576.77 | 2018 | 1950 | 561.1 |
| D | 2 | 249 | 1308167 | 2328.05 | 2018 | 1950 | 561.1 |
| D | 15 | 185 | 1241737 | 2209.66 | 2018 | 1950 | 561.1 |
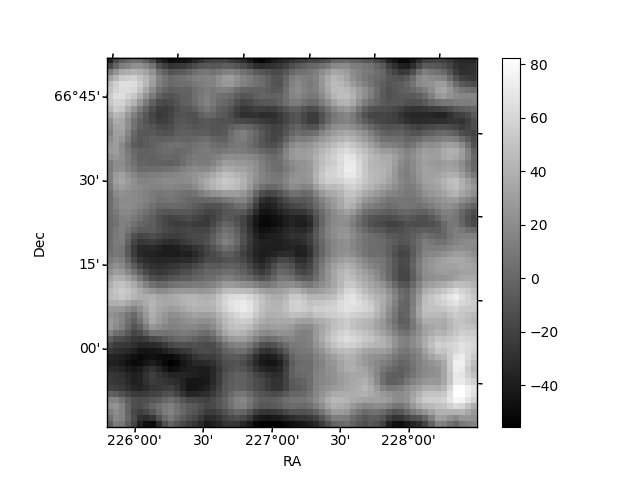
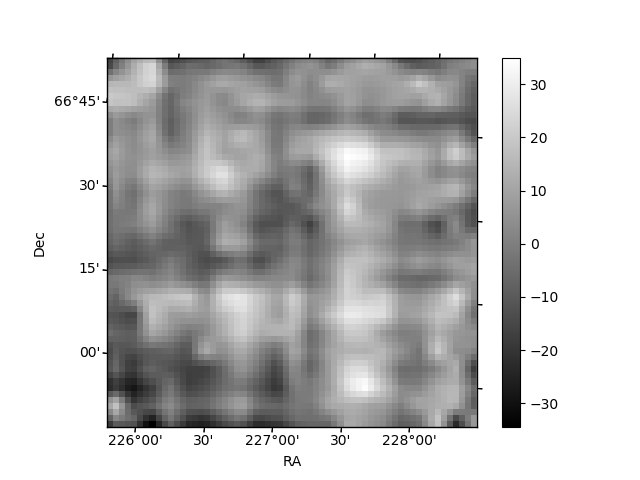
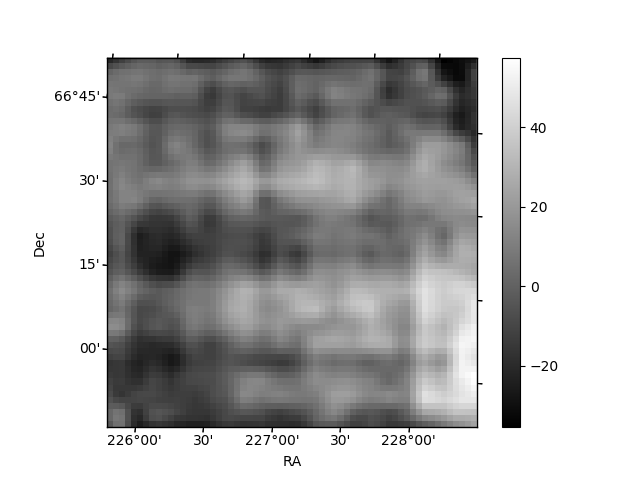
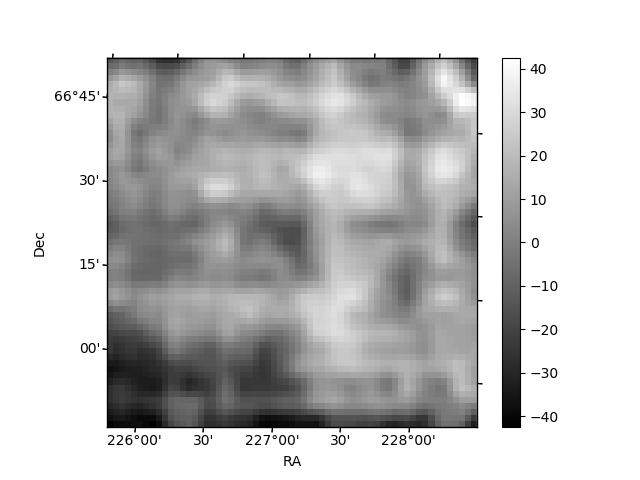
Histogram calculated using DETX and DETY for each event in the final _common_clean file
| Quadrant A | 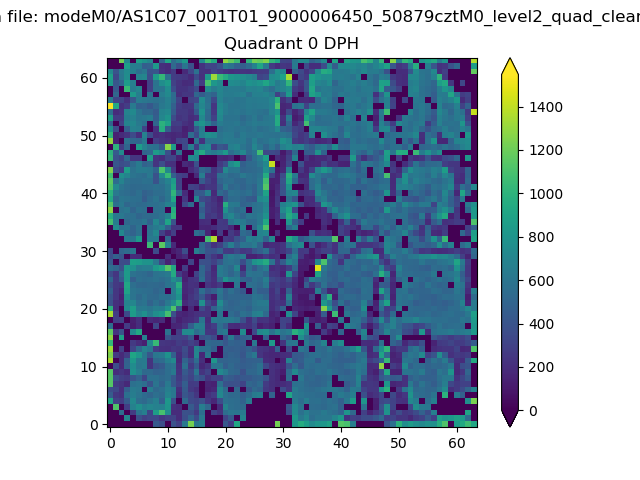 |
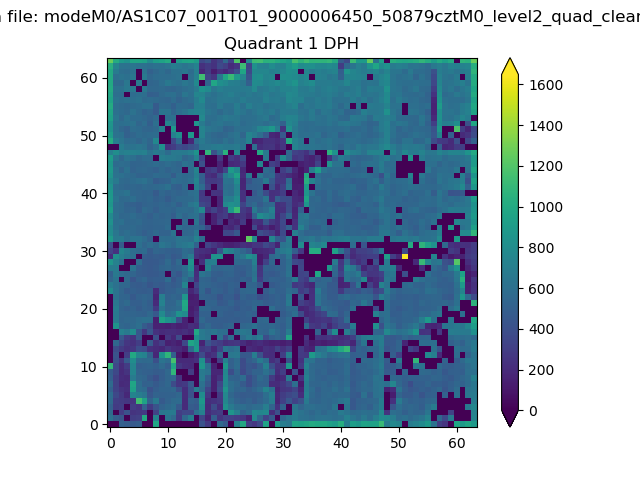 |
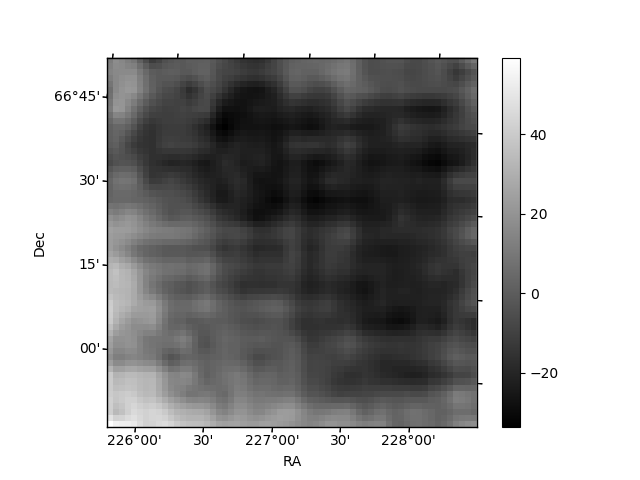
Quadrant B |
|---|---|---|---|
| Quadrant D | 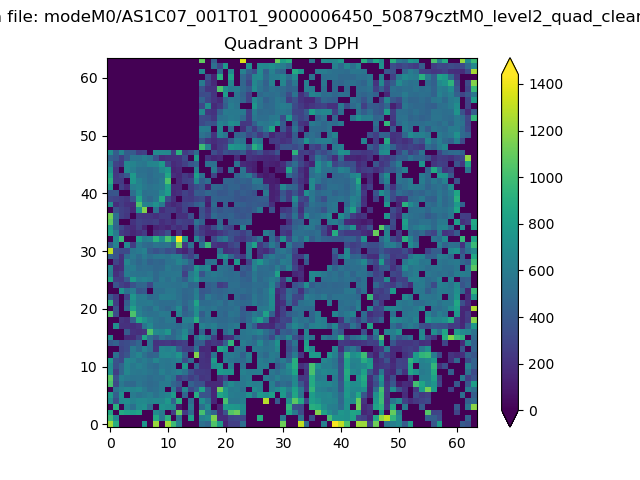 |
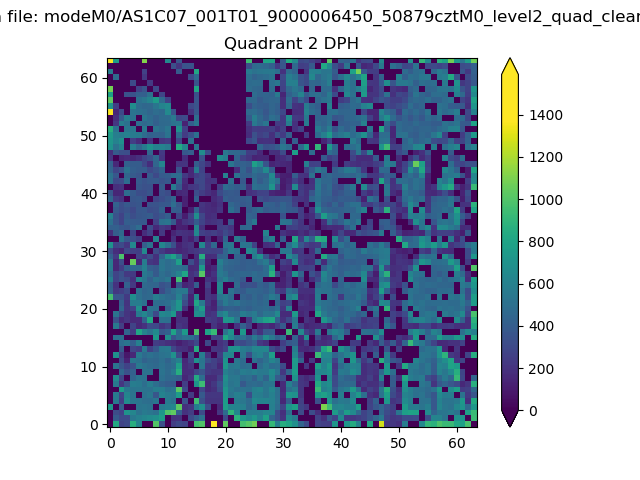 |
Quadrant C |
| Plot type | Count rate plots | Images |
|---|---|---|
| Comparison with Poisson distribution Blue bars denote a histogram of data divided into 1 sec bins. Red curve is a Poisson curve with rate = median count rate of data. |
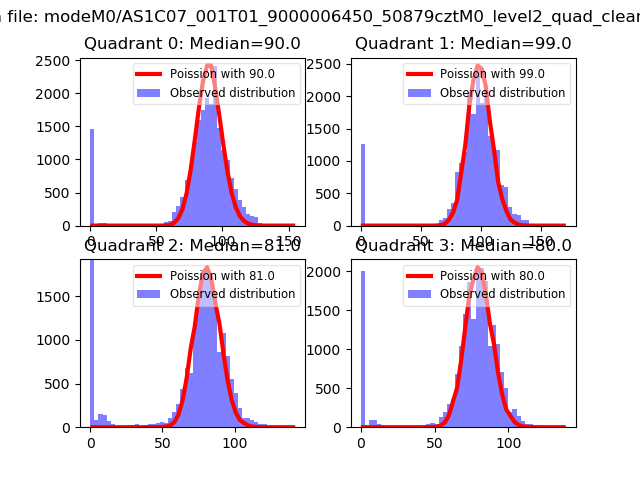 |
 |
| Quadrant-wise count rates Data is divided into 100 sec bins |
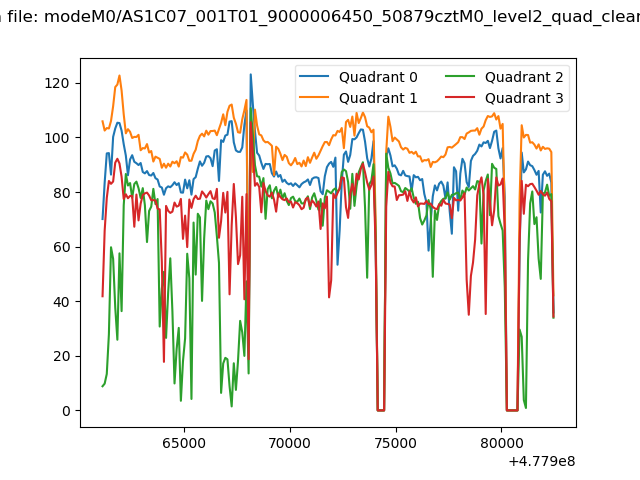 |
|
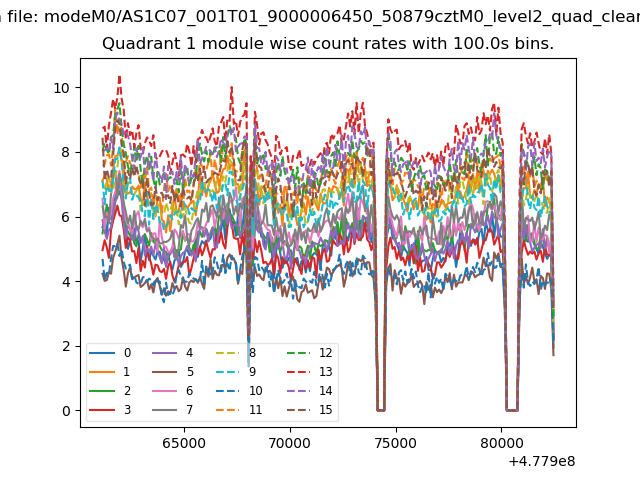
| Module-wise count rates for Quadrant A Data is divided into 100 sec bins |
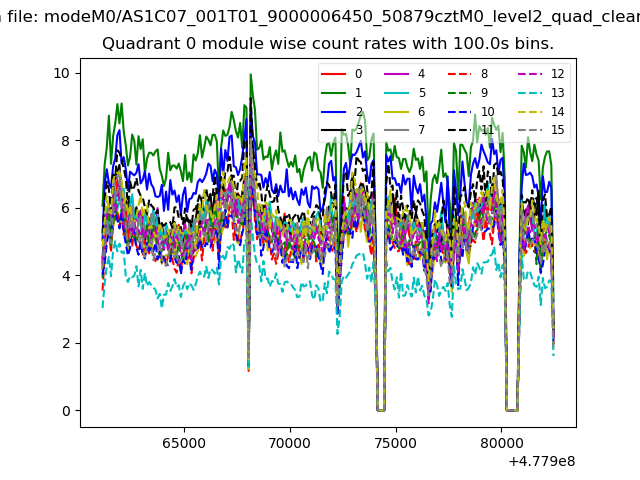 |
 |
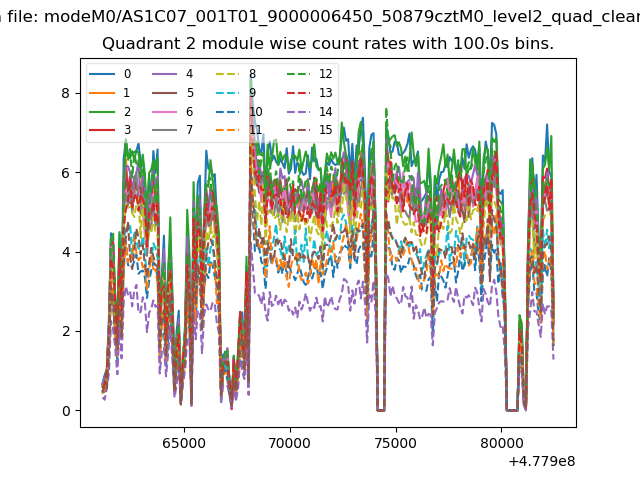
| Module-wise count rates for Quadrant B Data is divided into 100 sec bins |
 |
 |
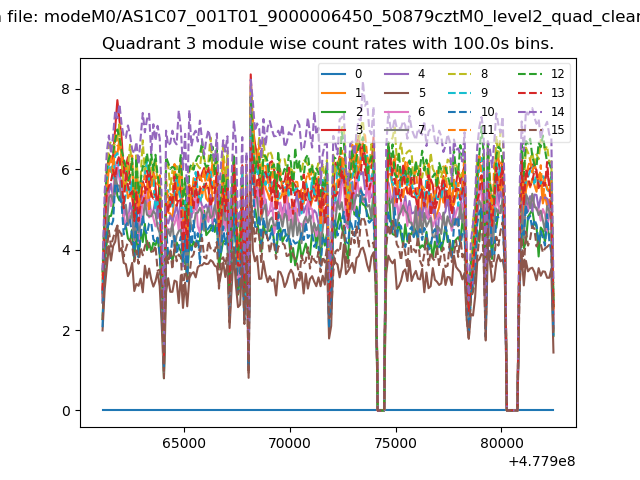
| Module-wise count rates for Quadrant C Data is divided into 100 sec bins |
 |
 |
| Module-wise count rates for Quadrant D Data is divided into 100 sec bins |
 |
 |
| Parameter | Plot |
|---|---|
| CZT HV Monitor | 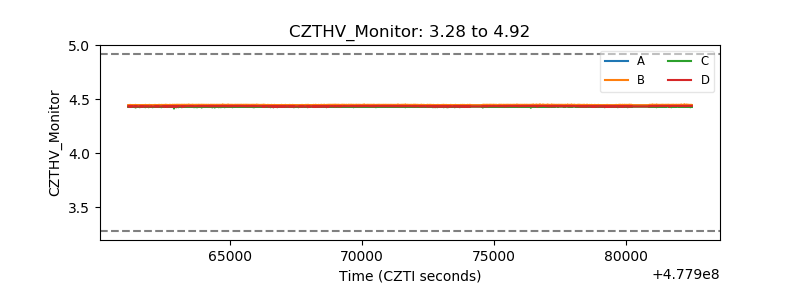 |
| D_VDD | 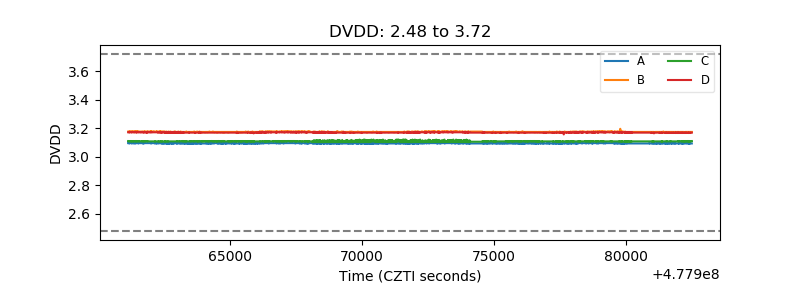 |
| Temperature 1 | 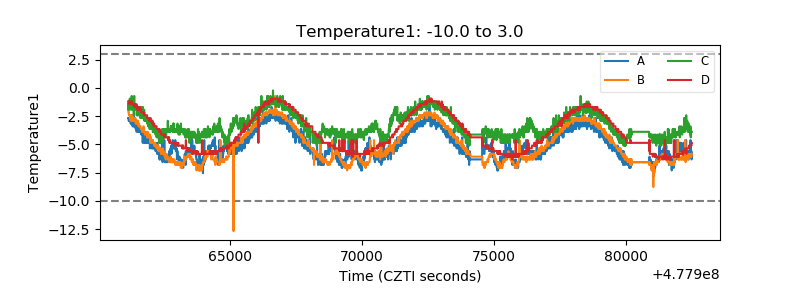 |
| Veto HV Monitor | 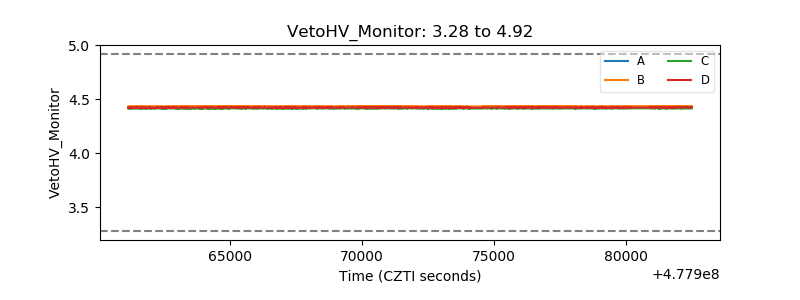 |
| Veto LLD | 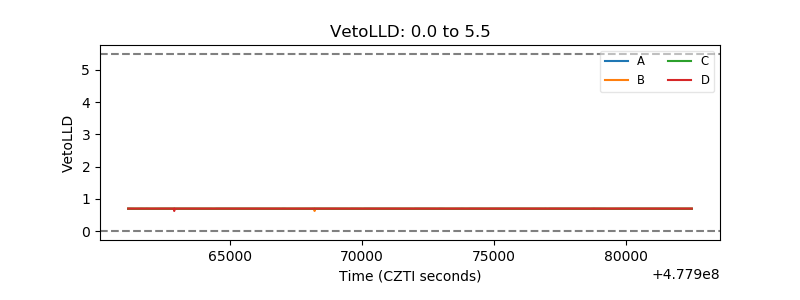 |
| Alpha Counter | 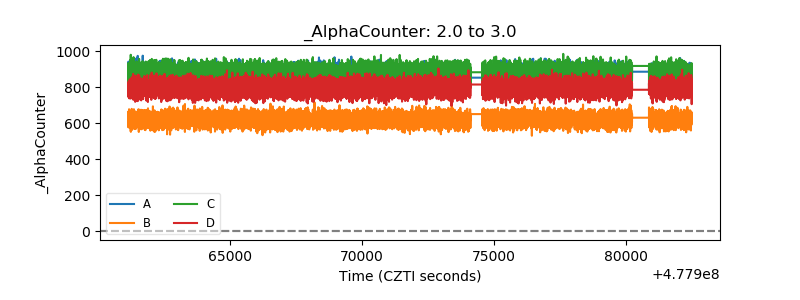 |
| _CPM_Rate | 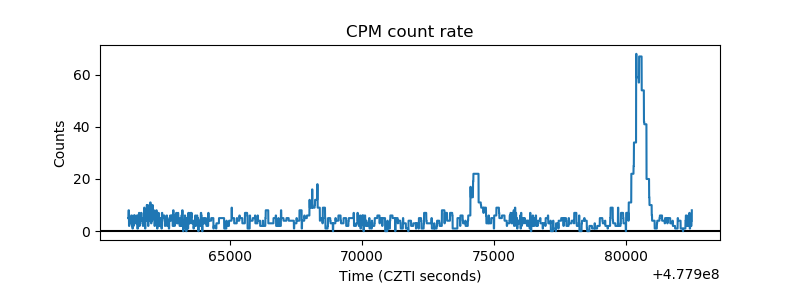 |
| CZT Counter | 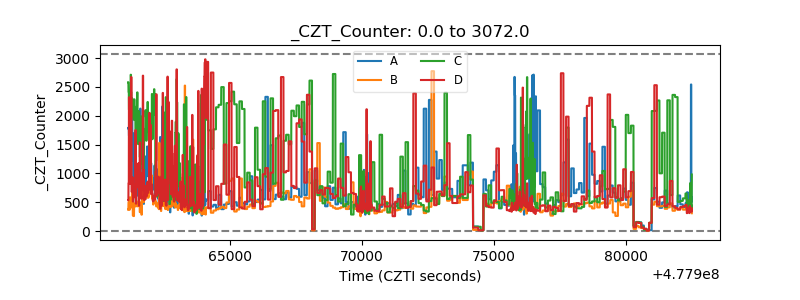 |
| +2.5 Volts monitor | 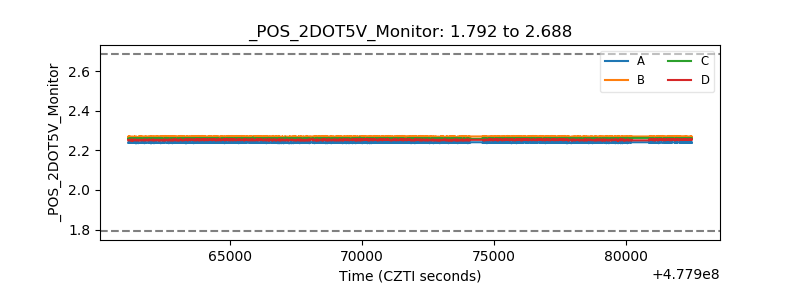 |
| +5 Volts monitor | 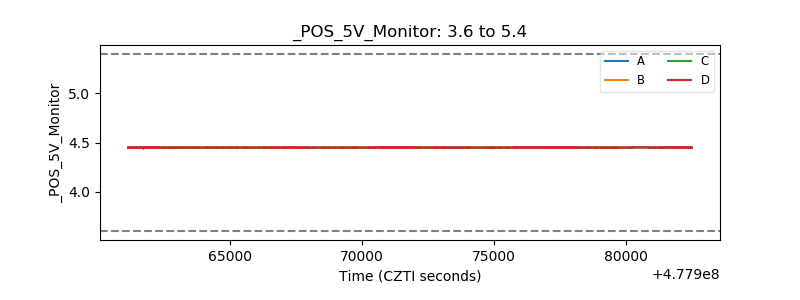 |
| _ROLL_ROT | 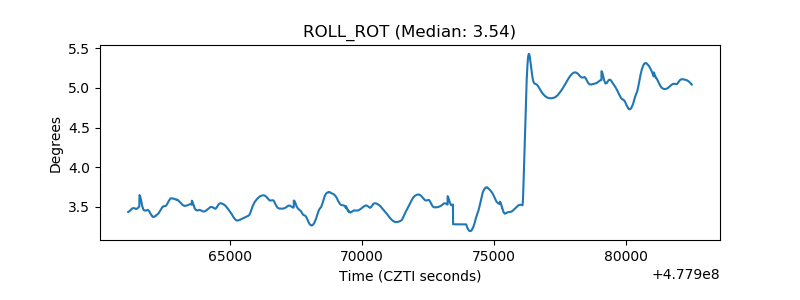 |
| _Roll_DEC | 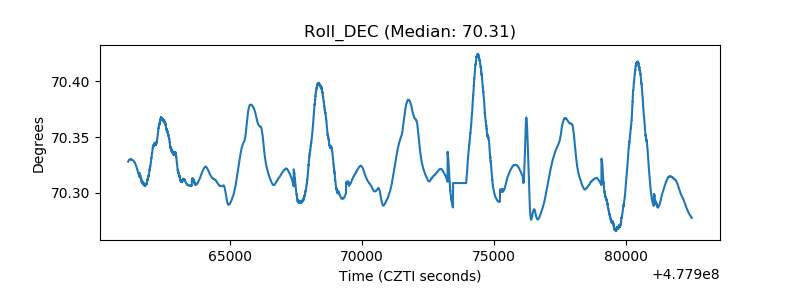 |
| _Roll_RA | 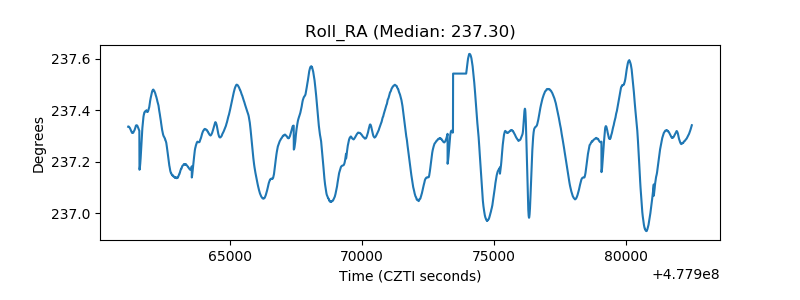 |
| Veto Counter | 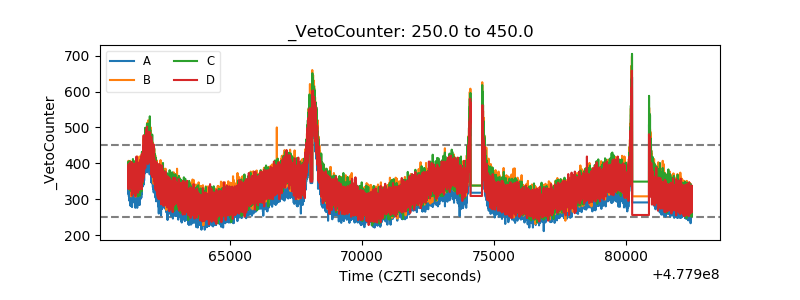 |