| Param | Original file | Final file |
|---|---|---|
| Filename | modeM0/AS1C07_001T01_9000006450_50880cztM0_level2.fits | modeM0/AS1C07_001T01_9000006450_50880cztM0_level2_quad_clean.evt |
| Size (bytes) | 452,810,880 | 87,140,160 |
| Size | 431.8 MB | 83.1 MB |
| Events in quadrant A | 3,744,169 | 564,186 |
| Events in quadrant B | 2,969,489 | 619,334 |
| Events in quadrant C | 5,622,322 | 516,868 |
| Events in quadrant D | 3,939,534 | 501,322 |
| Mode SS | |||
|---|---|---|---|
| Quadrant | BADHDUFLAG | Total packets | Discarded packets |
| A | 0 | 128 | 0 |
| B | 0 | 128 | 0 |
| C | 0 | 128 | 0 |
| D | 0 | 128 | 0 |
| Mode M0 | |||
|---|---|---|---|
| Quadrant | BADHDUFLAG | Total packets | Discarded packets |
| A | 0 | 15175 | 1 |
| B | 0 | 13520 | 1 |
| C | 0 | 21010 | 1 |
| D | 0 | 16363 | 1 |
| Mode M9 | |||
|---|---|---|---|
| Quadrant | BADHDUFLAG | Total packets | Discarded packets |
| A | 0 | 8 | 0 |
| B | 0 | 8 | 0 |
| C | 0 | 8 | 0 |
| D | 0 | 8 | 0 |
| Quadrant | Total seconds | Saturated seconds | Saturation percentage |
|---|---|---|---|
| A | 6253 | 204 | 3.262434% |
| B | 6254 | 119 | 1.902782% |
| C | 6254 | 588 | 9.401983% |
| D | 6254 | 289 | 4.621043% |
Noise dominated data is calculated using 1-second bins in cleaned event files. If a bin has >2000 counts, and if more than 50% of those come from <1% of pixels, then it is considered to be noise-dominated and hence unusable.
| Quadrant | # 1 sec bins | Bins with >0 counts | Bins with >2000 counts | High rate bins dominated by noise | Noise dominated (total time) | Noise dominated (detector-on time) | Marked lightcurve |
|---|---|---|---|---|---|---|---|
| A | 7048 | 6254 | 123 | 123 | 1.75% | 1.97% | 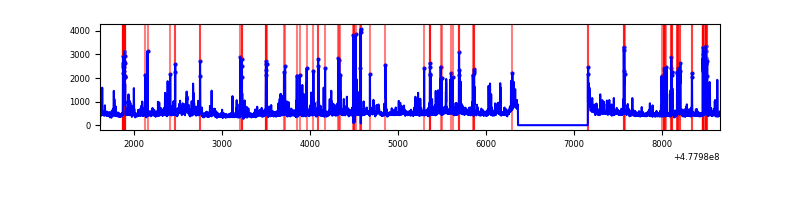 |
| B | 7049 | 6255 | 37 | 37 | 0.52% | 0.59% | 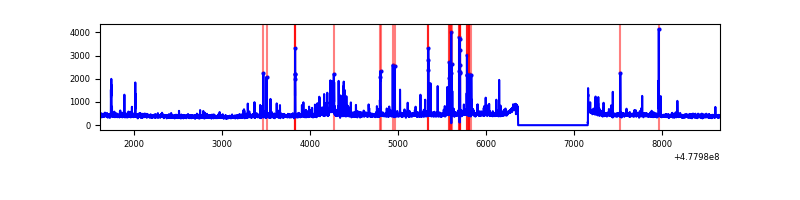 |
| C | 7049 | 6255 | 420 | 420 | 5.96% | 6.71% | 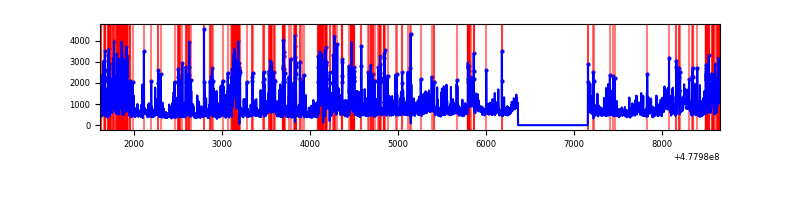 |
| D | 7049 | 6255 | 211 | 211 | 2.99% | 3.37% | 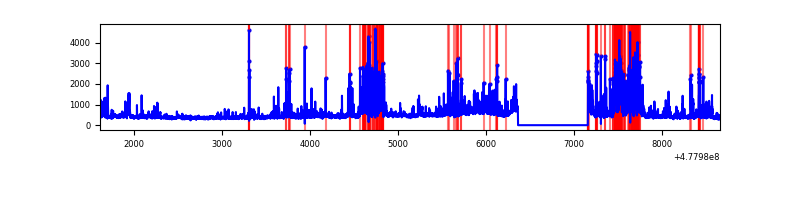 |
Top three noisy pixels from each quadrant. If the there are fewer than three noisy pixels in the level2.evt file, extra rows are filled as -1
| Pixel properties | Quadrant properties | ||||||
|---|---|---|---|---|---|---|---|
| Quadrant | DetID | PixID | Counts | Sigma | Mean | Median | Sigma |
| A | 4 | 249 | 164924 | 1028.92 | 648 | 633 | 159.7 |
| A | 4 | 4 | 154172 | 961.58 | 648 | 633 | 159.7 |
| A | 8 | 38 | 140553 | 876.29 | 648 | 633 | 159.7 |
| B | 2 | 249 | 103074 | 729.52 | 648 | 626 | 140.4 |
| B | 4 | 81 | 94631 | 669.4 | 648 | 626 | 140.4 |
| B | 1 | 255 | 27138 | 188.79 | 648 | 626 | 140.4 |
| C | 13 | 3 | 1019455 | 6135.27 | 604 | 599 | 166.1 |
| C | 1 | 29 | 637588 | 3835.77 | 604 | 599 | 166.1 |
| C | 5 | 10 | 461786 | 2777.14 | 604 | 599 | 166.1 |
| D | 11 | 245 | 491462 | 2863.51 | 618 | 596 | 171.4 |
| D | 2 | 249 | 441377 | 2571.34 | 618 | 596 | 171.4 |
| D | 2 | 216 | 106684 | 618.87 | 618 | 596 | 171.4 |
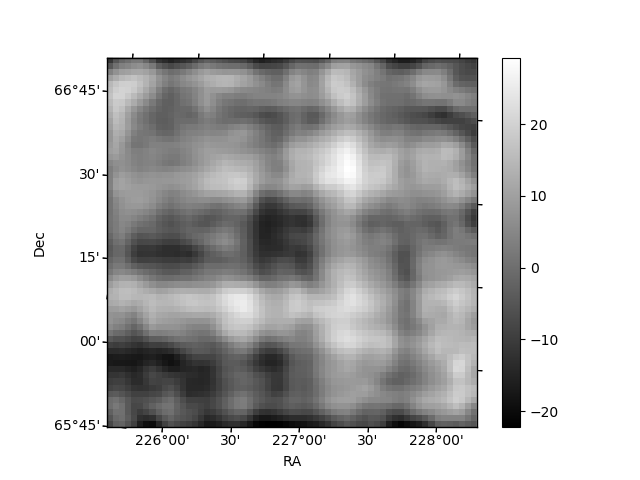
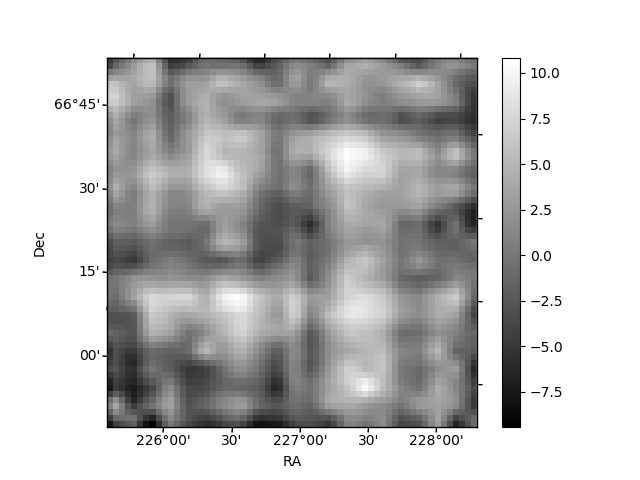
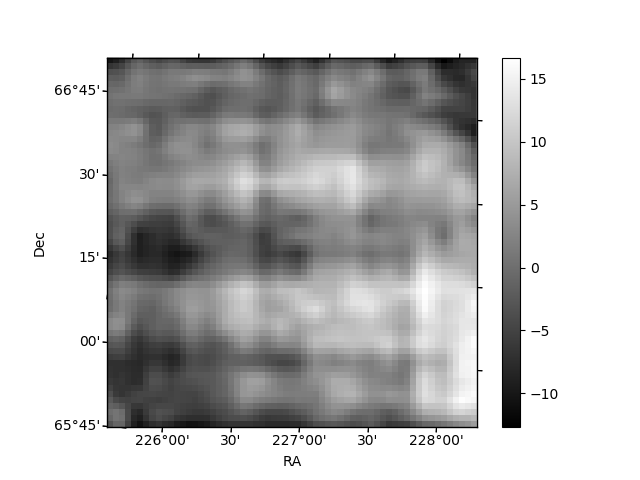
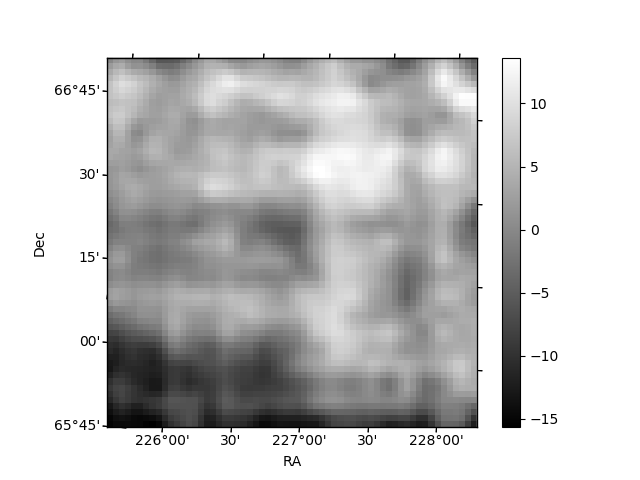
Histogram calculated using DETX and DETY for each event in the final _common_clean file
| Quadrant A | 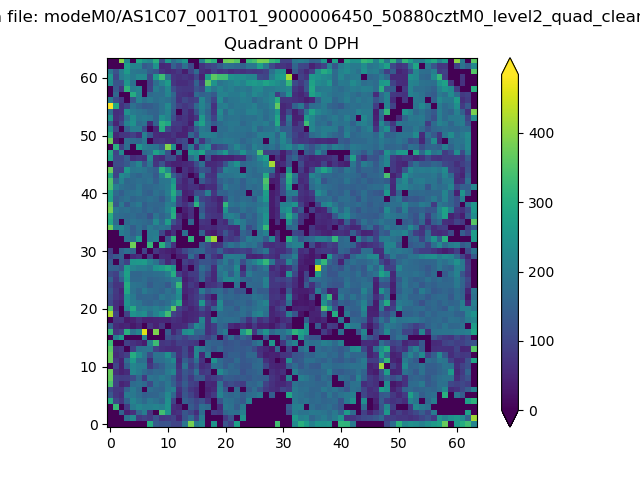 |
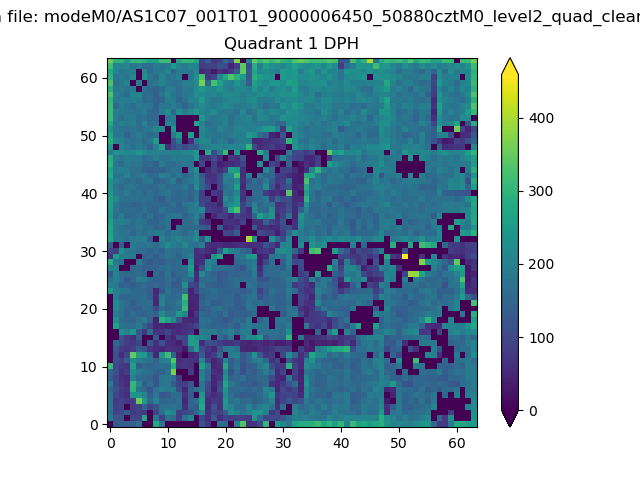 |
Quadrant B |
|---|---|---|---|
| Quadrant D | 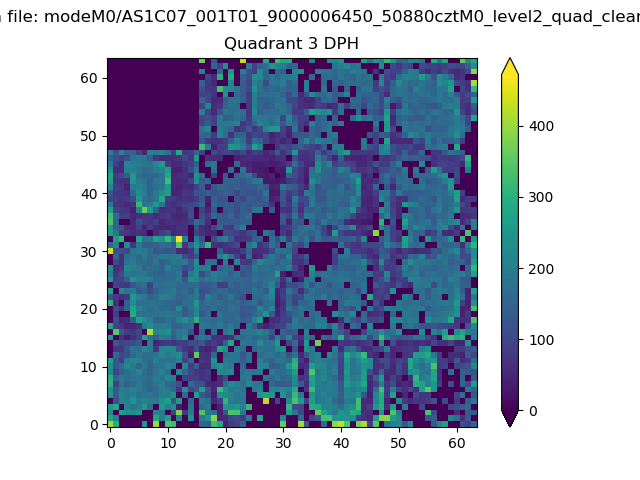 |
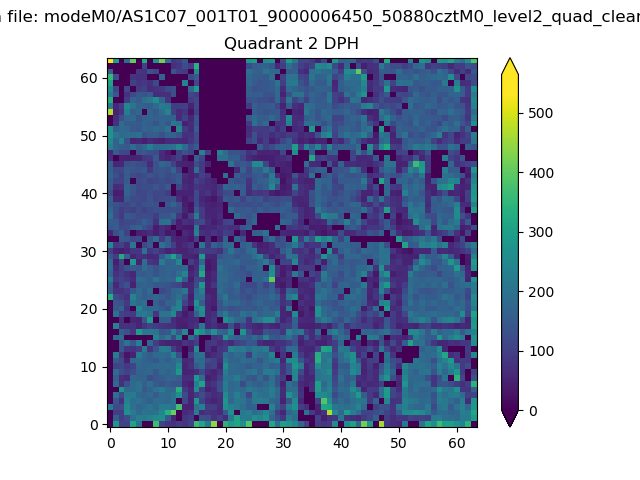 |
Quadrant C |
| Plot type | Count rate plots | Images |
|---|---|---|
| Comparison with Poisson distribution Blue bars denote a histogram of data divided into 1 sec bins. Red curve is a Poisson curve with rate = median count rate of data. |
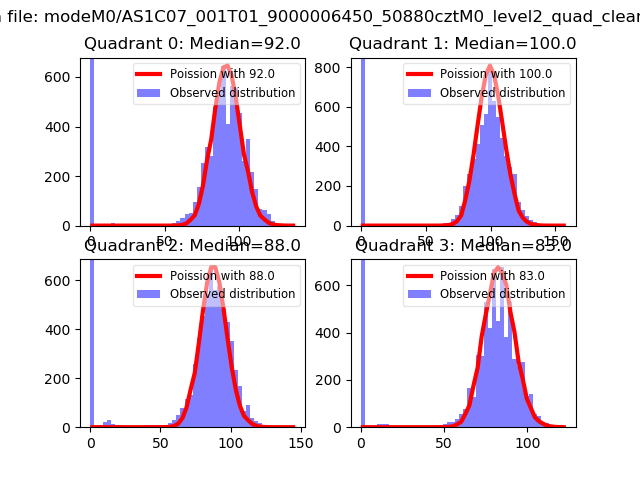 |
 |
| Quadrant-wise count rates Data is divided into 100 sec bins |
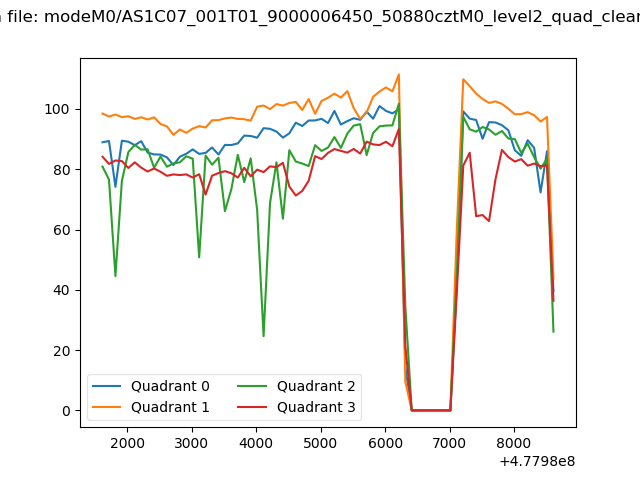 |
|
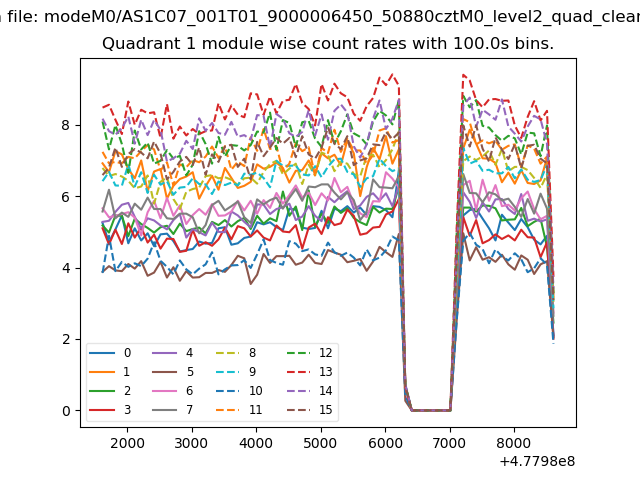
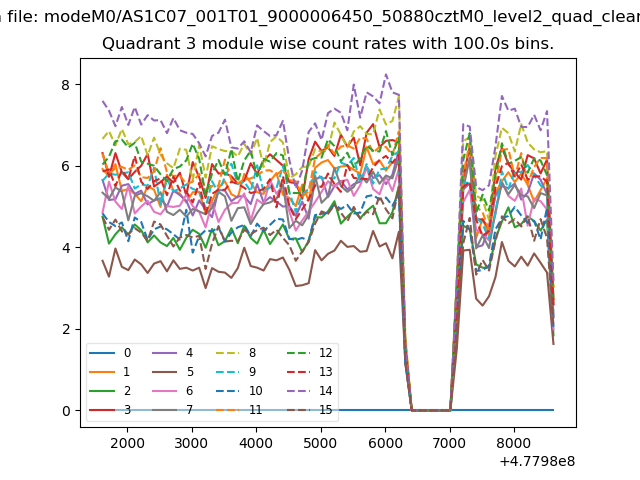
| Module-wise count rates for Quadrant A Data is divided into 100 sec bins |
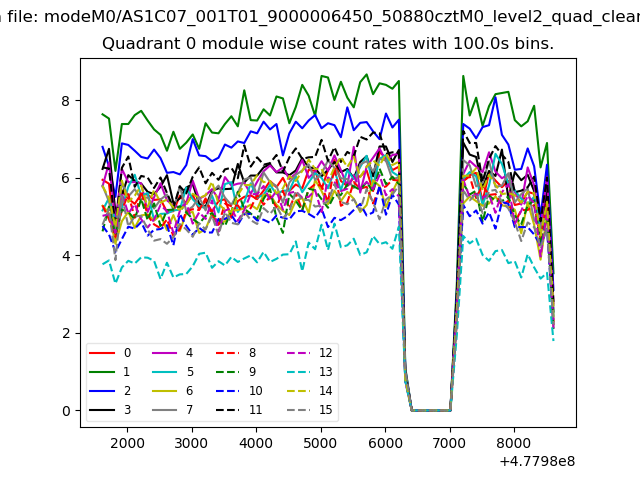 |
 |
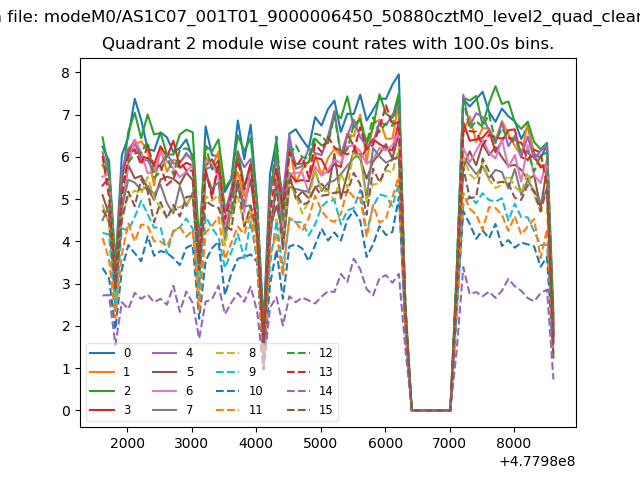
| Module-wise count rates for Quadrant B Data is divided into 100 sec bins |
 |
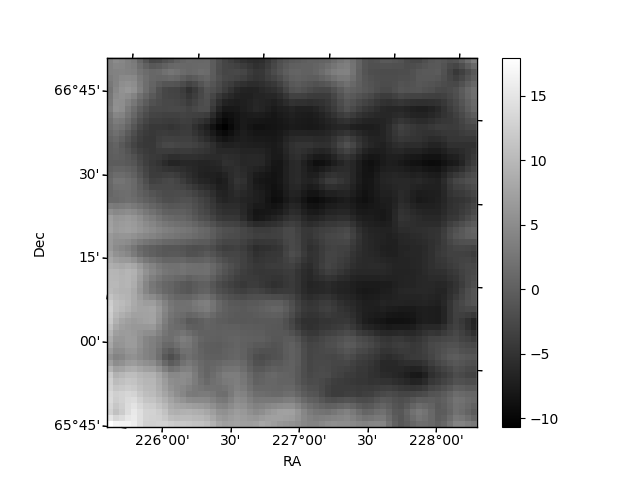 |
| Module-wise count rates for Quadrant C Data is divided into 100 sec bins |
 |
 |
| Module-wise count rates for Quadrant D Data is divided into 100 sec bins |
 |
 |
| Parameter | Plot |
|---|---|
| CZT HV Monitor | 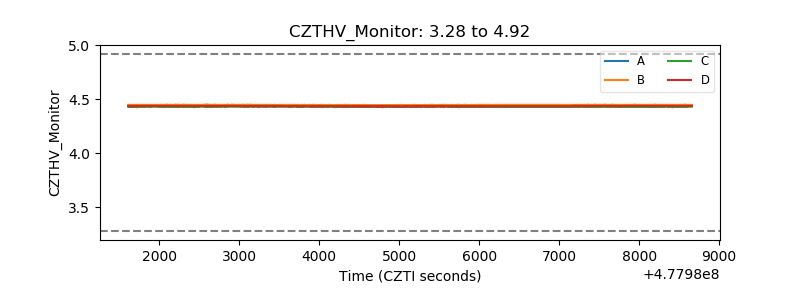 |
| D_VDD | 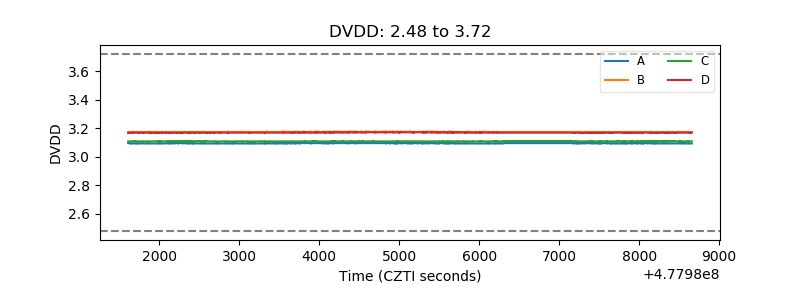 |
| Temperature 1 | 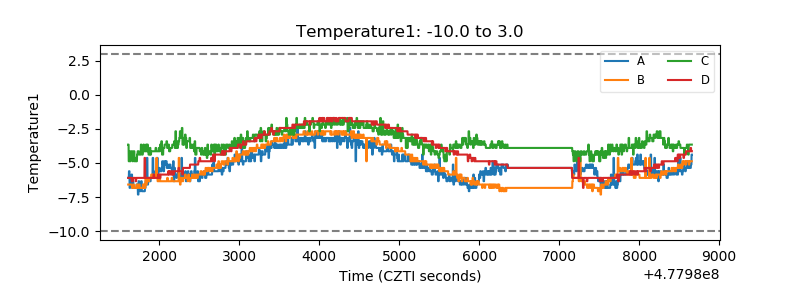 |
| Veto HV Monitor | 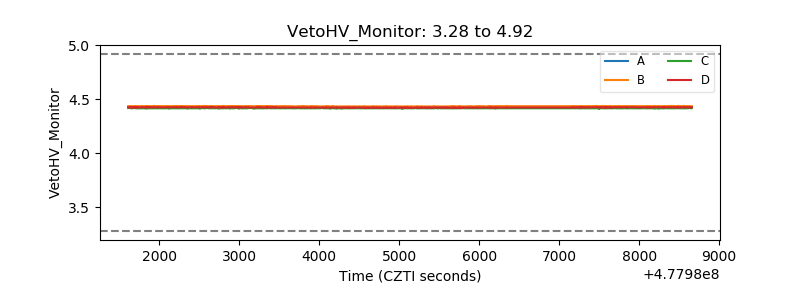 |
| Veto LLD | 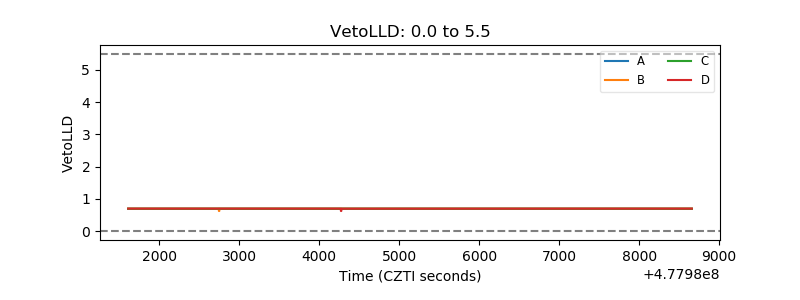 |
| Alpha Counter | 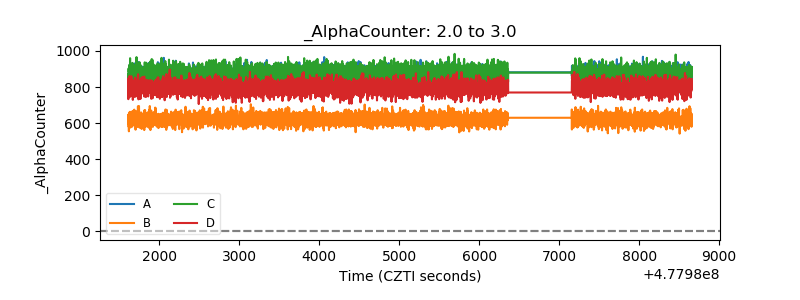 |
| _CPM_Rate | 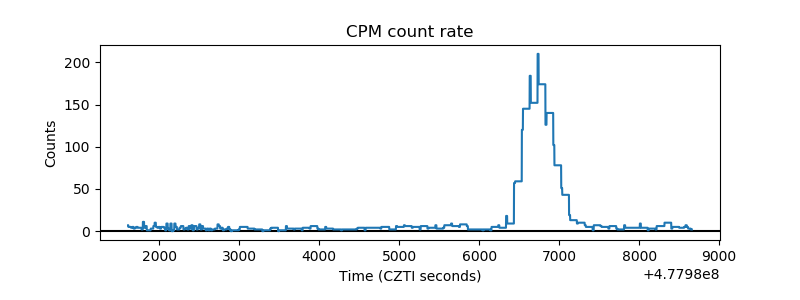 |
| CZT Counter | 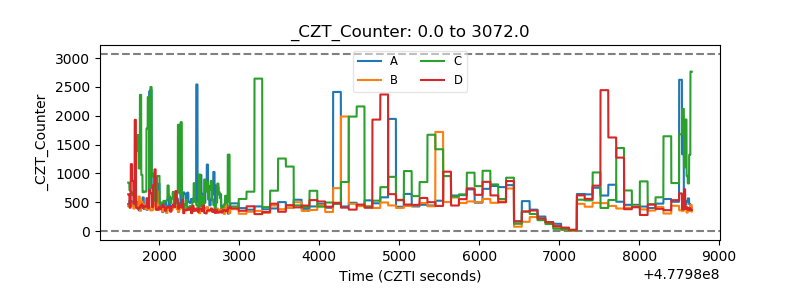 |
| +2.5 Volts monitor | 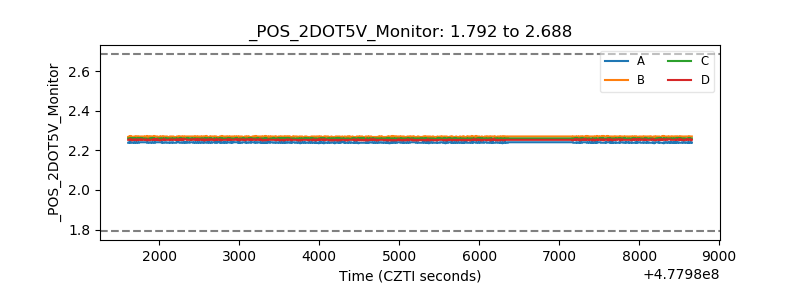 |
| +5 Volts monitor | 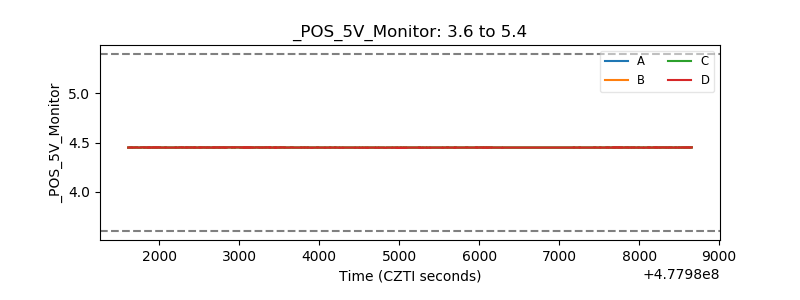 |
| _ROLL_ROT | 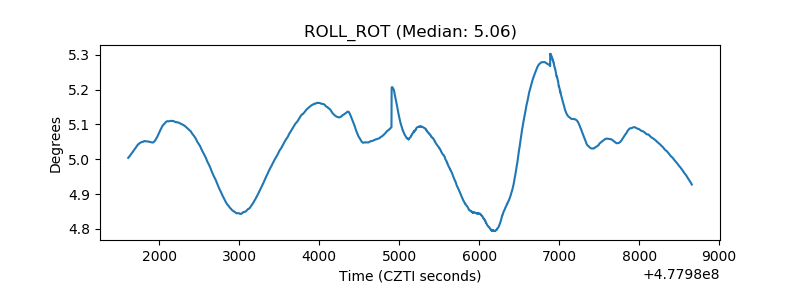 |
| _Roll_DEC | 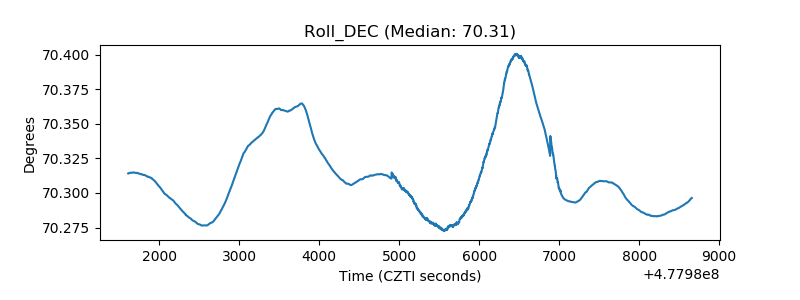 |
| _Roll_RA | 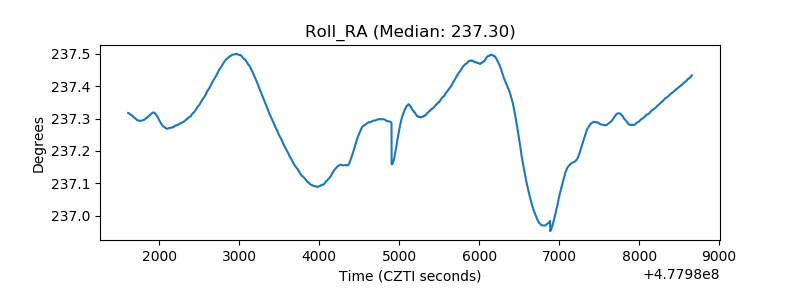 |
| Veto Counter | 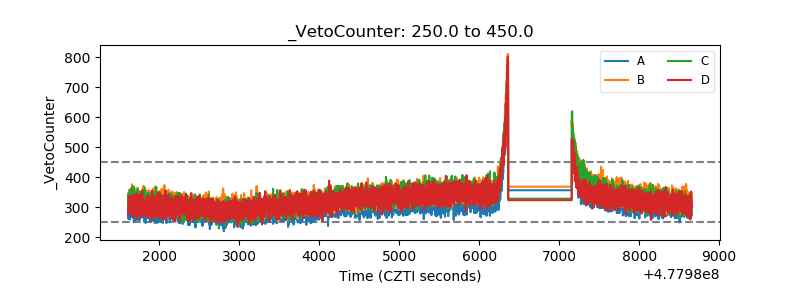 |