| Param | Original file | Final file |
|---|---|---|
| Filename | modeM0/AS1C07_001T01_9000006450_50882cztM0_level2.fits | modeM0/AS1C07_001T01_9000006450_50882cztM0_level2_quad_clean.evt |
| Size (bytes) | 468,377,280 | 87,511,680 |
| Size | 446.7 MB | 83.5 MB |
| Events in quadrant A | 3,780,931 | 563,701 |
| Events in quadrant B | 2,973,118 | 623,652 |
| Events in quadrant C | 5,385,897 | 540,022 |
| Events in quadrant D | 4,720,545 | 492,781 |
| Mode SS | |||
|---|---|---|---|
| Quadrant | BADHDUFLAG | Total packets | Discarded packets |
| A | 0 | 126 | 0 |
| B | 0 | 126 | 0 |
| C | 0 | 126 | 0 |
| D | 0 | 126 | 0 |
| Mode M0 | |||
|---|---|---|---|
| Quadrant | BADHDUFLAG | Total packets | Discarded packets |
| A | 0 | 15335 | 1 |
| B | 0 | 13314 | 1 |
| C | 0 | 20277 | 1 |
| D | 0 | 18435 | 1 |
| Mode M9 | |||
|---|---|---|---|
| Quadrant | BADHDUFLAG | Total packets | Discarded packets |
| A | 0 | 9 | 0 |
| B | 0 | 9 | 0 |
| C | 0 | 9 | 0 |
| D | 0 | 9 | 0 |
| Quadrant | Total seconds | Saturated seconds | Saturation percentage |
|---|---|---|---|
| A | 6147 | 250 | 4.067025% |
| B | 6148 | 101 | 1.642811% |
| C | 6148 | 313 | 5.091087% |
| D | 6148 | 461 | 7.498373% |
Noise dominated data is calculated using 1-second bins in cleaned event files. If a bin has >2000 counts, and if more than 50% of those come from <1% of pixels, then it is considered to be noise-dominated and hence unusable.
| Quadrant | # 1 sec bins | Bins with >0 counts | Bins with >2000 counts | High rate bins dominated by noise | Noise dominated (total time) | Noise dominated (detector-on time) | Marked lightcurve |
|---|---|---|---|---|---|---|---|
| A | 7072 | 6148 | 138 | 138 | 1.95% | 2.24% | 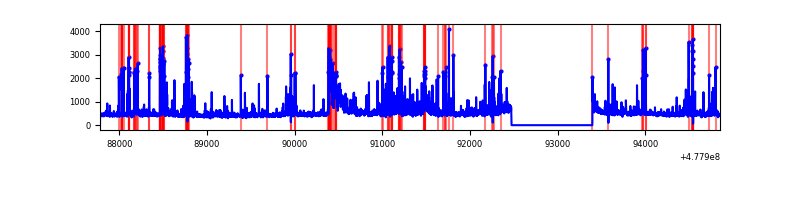 |
| B | 7073 | 6149 | 26 | 26 | 0.37% | 0.42% | 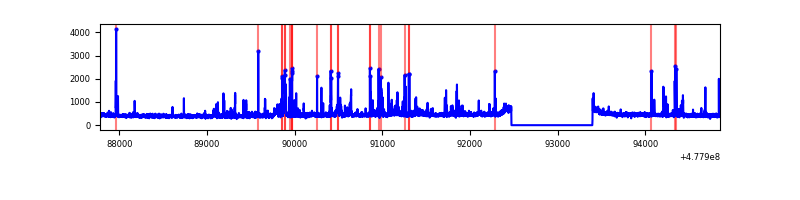 |
| C | 7073 | 6149 | 262 | 262 | 3.70% | 4.26% | 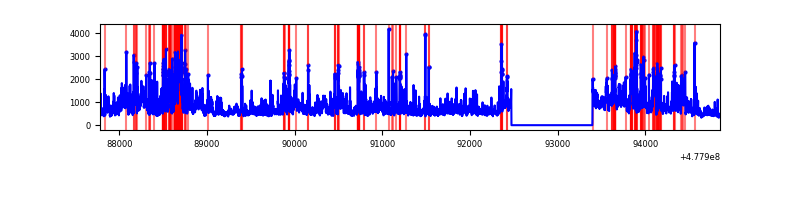 |
| D | 7073 | 6149 | 397 | 397 | 5.61% | 6.46% | 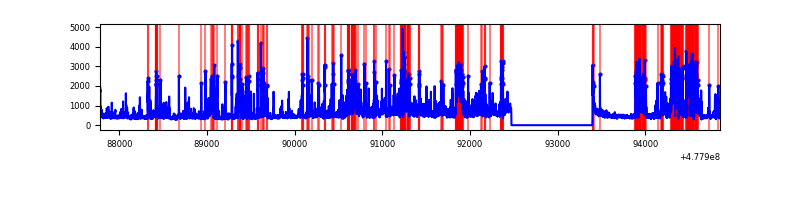 |
Top three noisy pixels from each quadrant. If the there are fewer than three noisy pixels in the level2.evt file, extra rows are filled as -1
| Pixel properties | Quadrant properties | ||||||
|---|---|---|---|---|---|---|---|
| Quadrant | DetID | PixID | Counts | Sigma | Mean | Median | Sigma |
| A | 4 | 249 | 307729 | 1953.22 | 643 | 629 | 157.2 |
| A | 7 | 206 | 295894 | 1877.94 | 643 | 629 | 157.2 |
| A | 5 | 240 | 145933 | 924.16 | 643 | 629 | 157.2 |
| B | 4 | 206 | 97976 | 699.18 | 646 | 622 | 139.2 |
| B | 4 | 81 | 61738 | 438.92 | 646 | 622 | 139.2 |
| B | 7 | 252 | 59576 | 423.4 | 646 | 622 | 139.2 |
| C | 5 | 10 | 954800 | 5692.55 | 617 | 613 | 167.6 |
| C | 10 | 171 | 604641 | 3603.55 | 617 | 613 | 167.6 |
| C | 3 | 233 | 301872 | 1797.27 | 617 | 613 | 167.6 |
| D | 11 | 245 | 1239930 | 7338.48 | 608 | 586 | 168.9 |
| D | 2 | 216 | 431272 | 2550.2 | 608 | 586 | 168.9 |
| D | 2 | 249 | 176512 | 1041.7 | 608 | 586 | 168.9 |
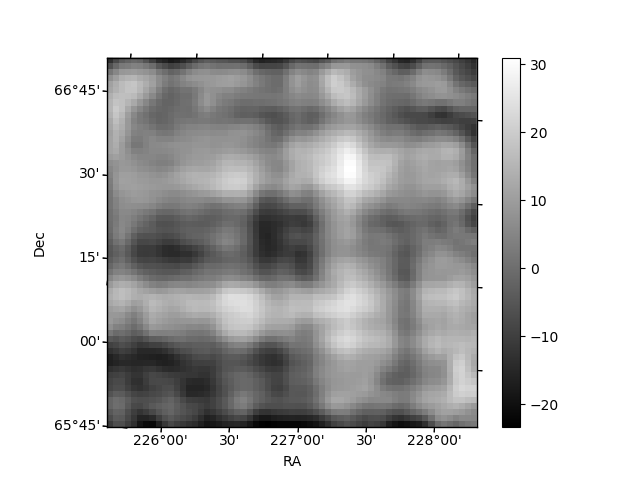
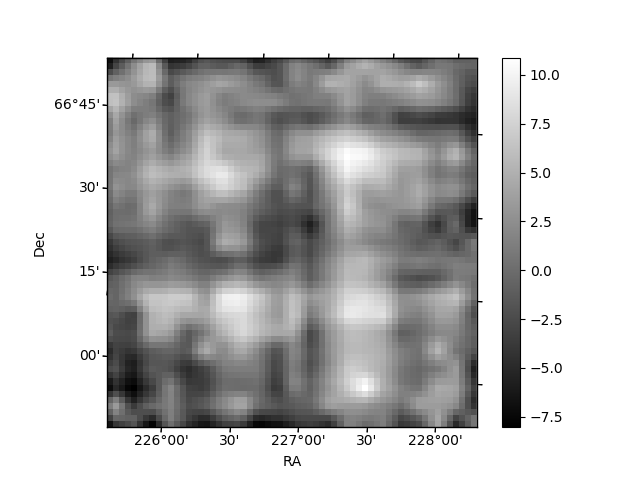
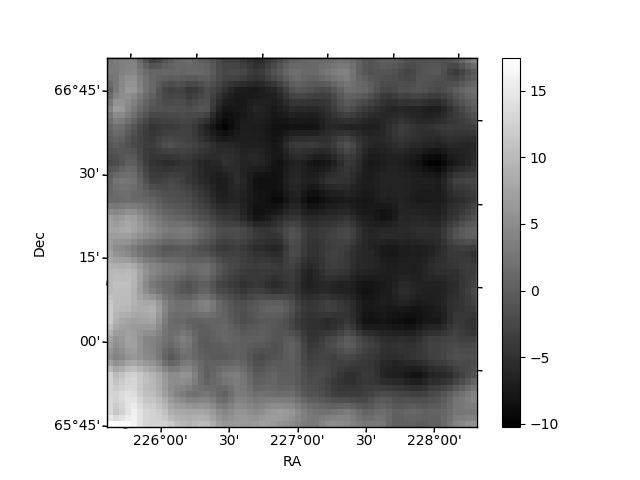
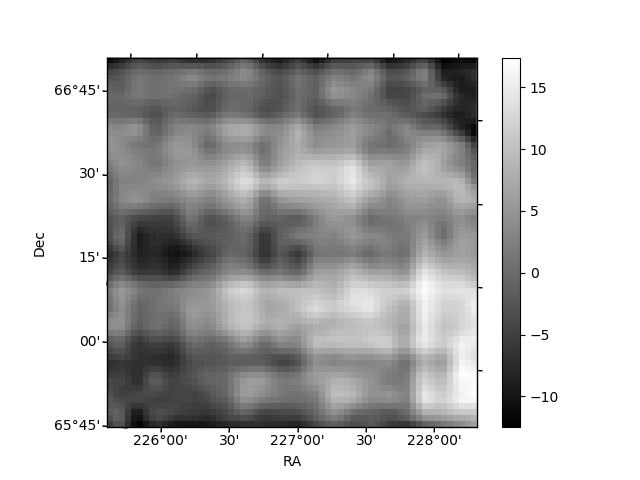
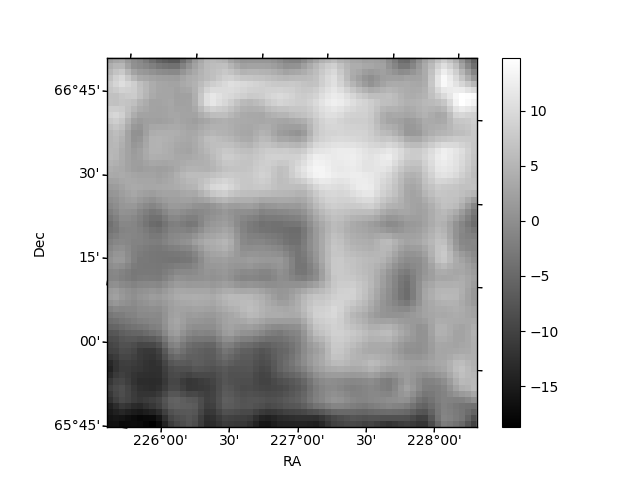
Histogram calculated using DETX and DETY for each event in the final _common_clean file
| Quadrant A | 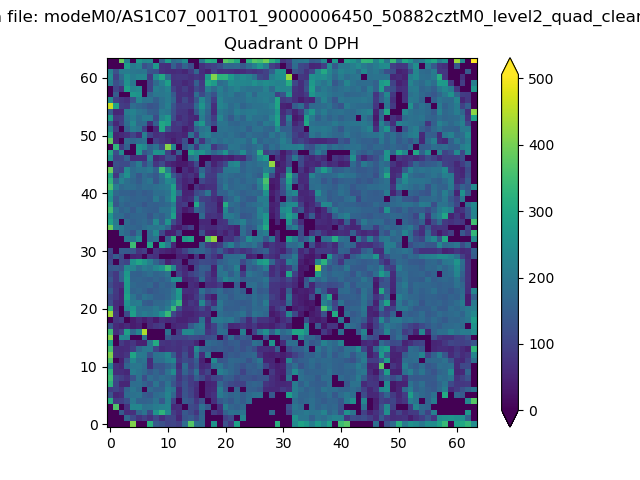 |
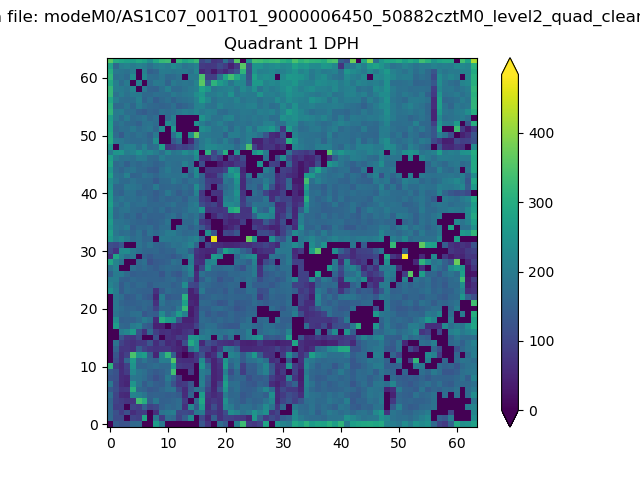 |
Quadrant B |
|---|---|---|---|
| Quadrant D | 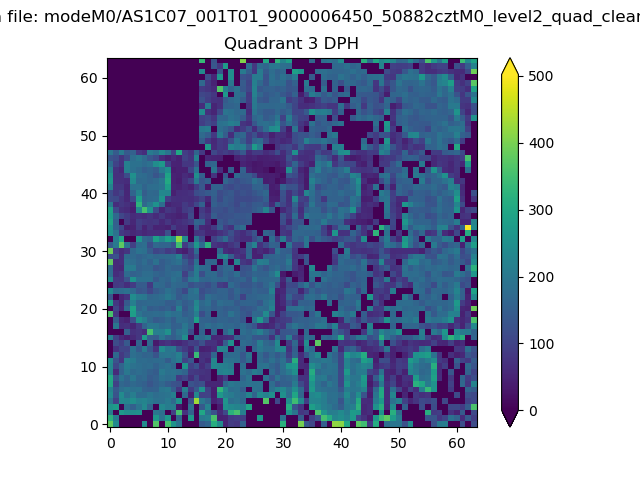 |
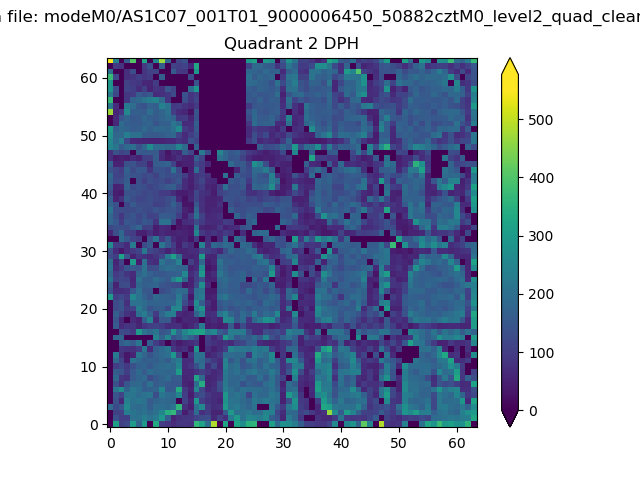 |
Quadrant C |
| Plot type | Count rate plots | Images |
|---|---|---|
| Comparison with Poisson distribution Blue bars denote a histogram of data divided into 1 sec bins. Red curve is a Poisson curve with rate = median count rate of data. |
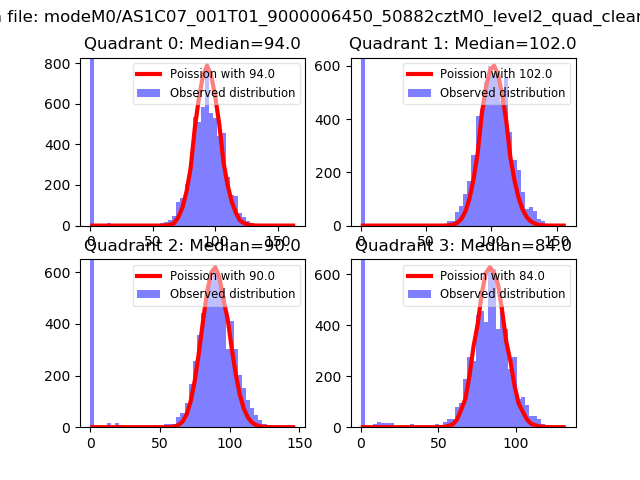 |
 |
| Quadrant-wise count rates Data is divided into 100 sec bins |
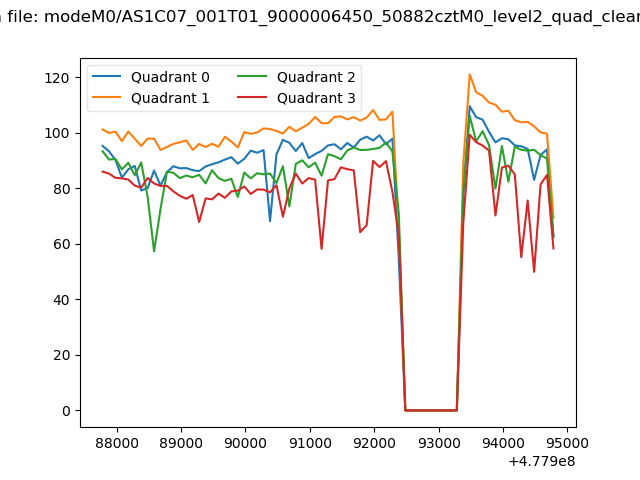 |
|
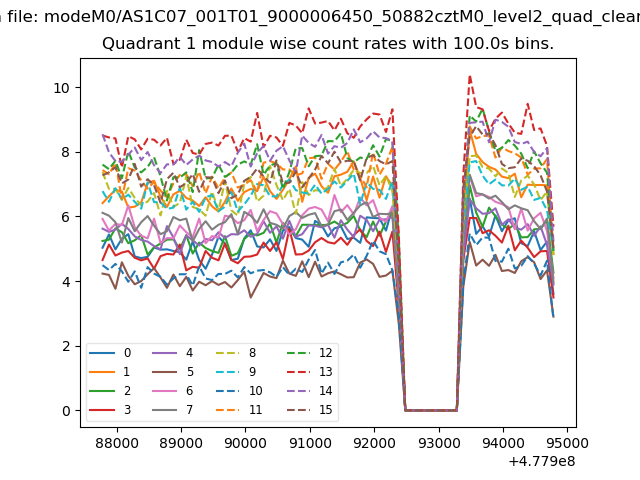
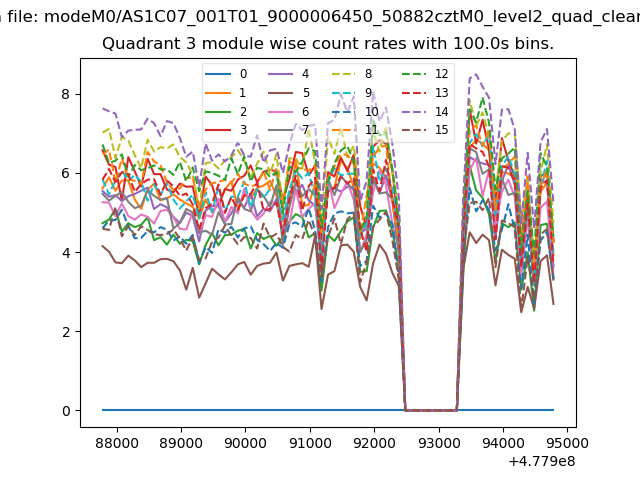
| Module-wise count rates for Quadrant A Data is divided into 100 sec bins |
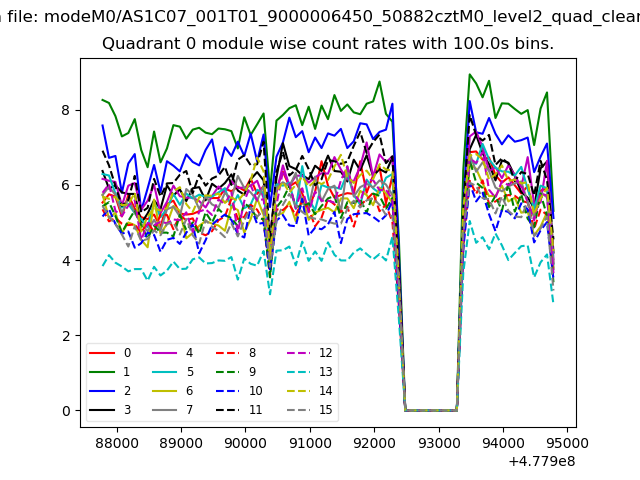 |
 |
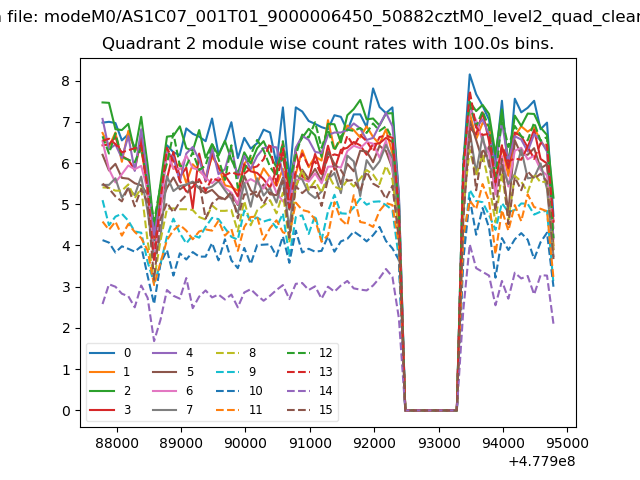
| Module-wise count rates for Quadrant B Data is divided into 100 sec bins |
 |
 |
| Module-wise count rates for Quadrant C Data is divided into 100 sec bins |
 |
 |
| Module-wise count rates for Quadrant D Data is divided into 100 sec bins |
 |
 |
| Parameter | Plot |
|---|---|
| CZT HV Monitor | 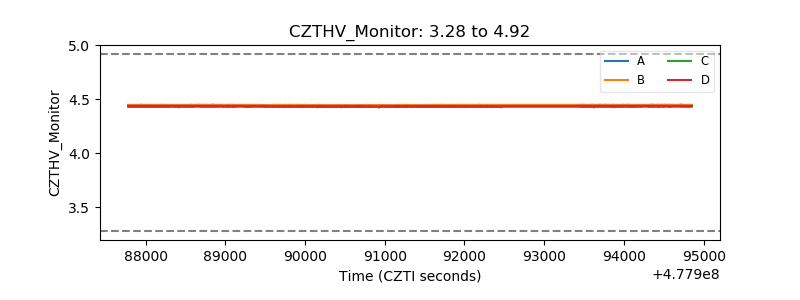 |
| D_VDD | 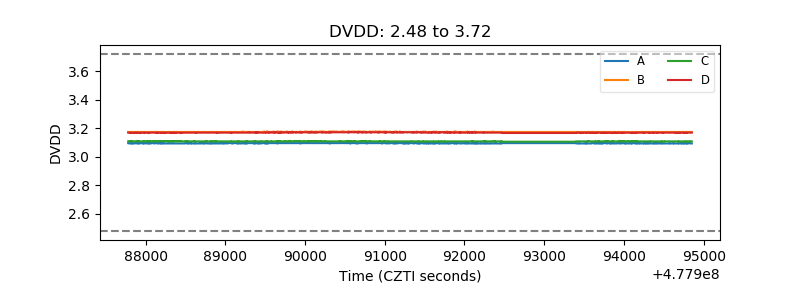 |
| Temperature 1 | 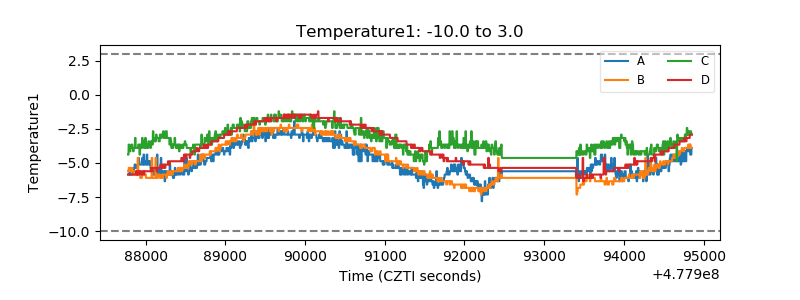 |
| Veto HV Monitor | 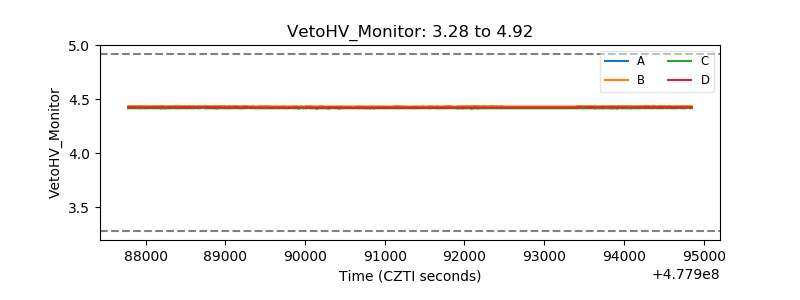 |
| Veto LLD | 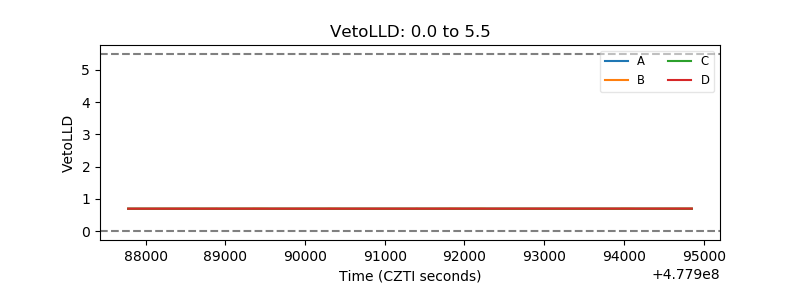 |
| Alpha Counter | 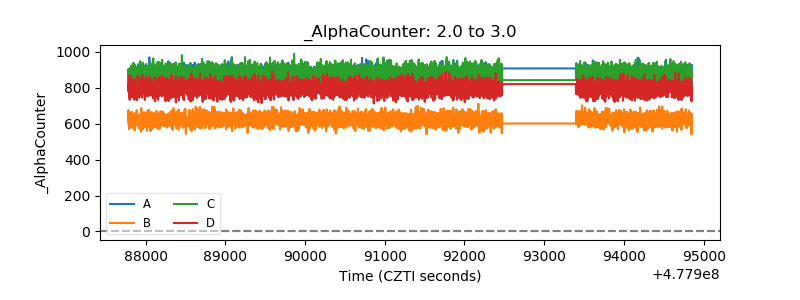 |
| _CPM_Rate | 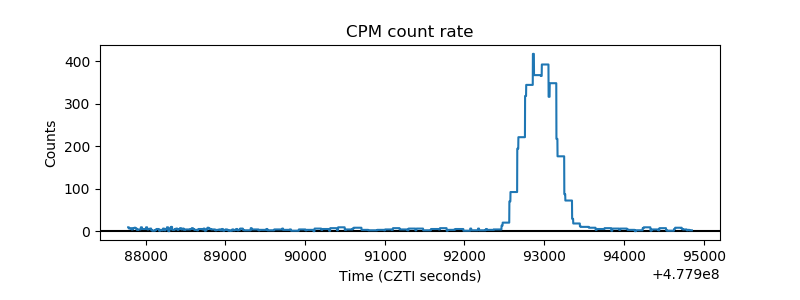 |
| CZT Counter | 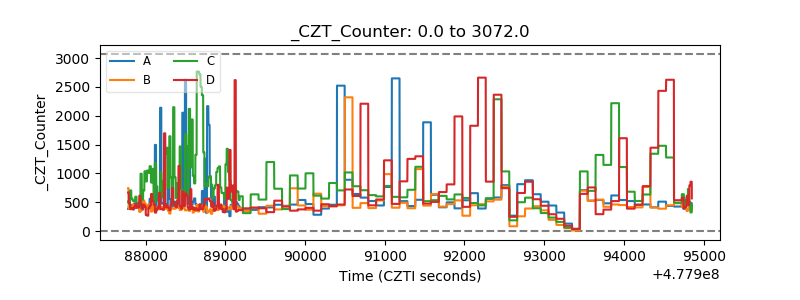 |
| +2.5 Volts monitor | 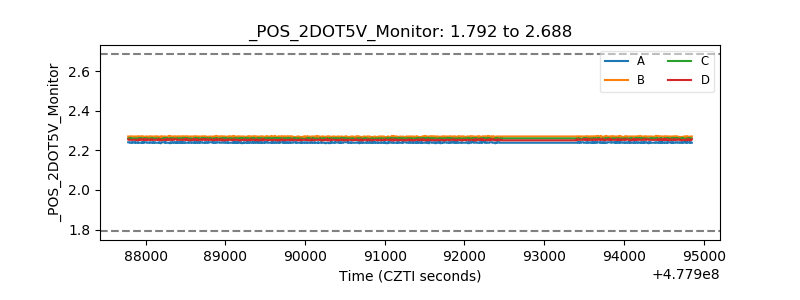 |
| +5 Volts monitor | 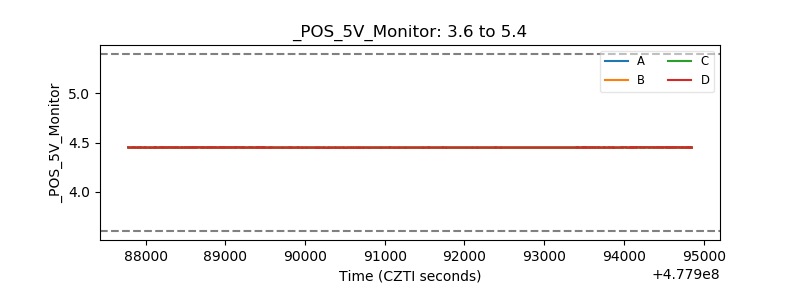 |
| _ROLL_ROT | 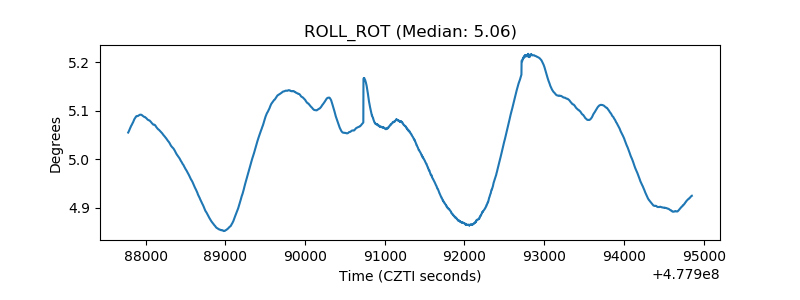 |
| _Roll_DEC | 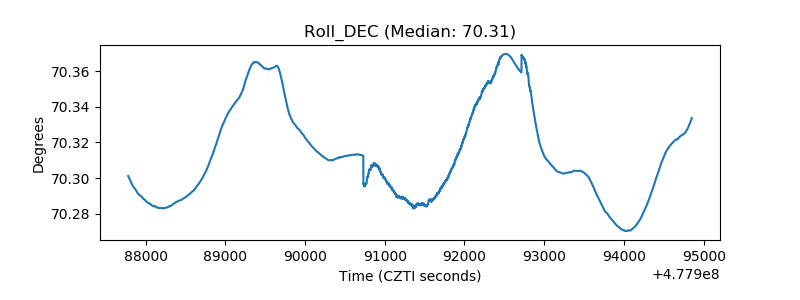 |
| _Roll_RA | 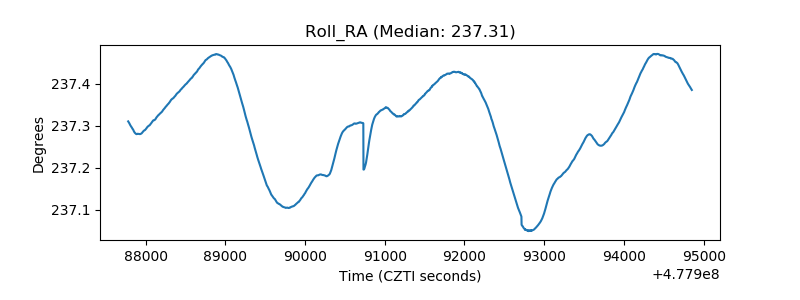 |
| Veto Counter | 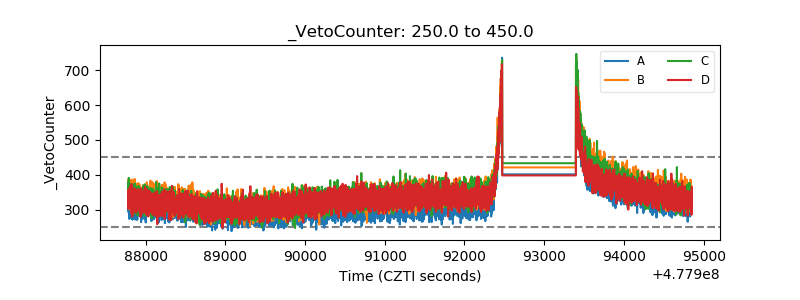 |