| Param | Original file | Final file |
|---|---|---|
| Filename | modeM0/AS1C07_001T01_9000006450_50883cztM0_level2.fits | modeM0/AS1C07_001T01_9000006450_50883cztM0_level2_quad_clean.evt |
| Size (bytes) | 539,763,840 | 87,390,720 |
| Size | 514.8 MB | 83.3 MB |
| Events in quadrant A | 4,840,660 | 558,410 |
| Events in quadrant B | 3,664,459 | 634,807 |
| Events in quadrant C | 5,656,830 | 529,359 |
| Events in quadrant D | 5,342,784 | 495,308 |
| Mode SS | |||
|---|---|---|---|
| Quadrant | BADHDUFLAG | Total packets | Discarded packets |
| A | 0 | 124 | 0 |
| B | 0 | 124 | 0 |
| C | 0 | 124 | 0 |
| D | 0 | 124 | 0 |
| Mode M0 | |||
|---|---|---|---|
| Quadrant | BADHDUFLAG | Total packets | Discarded packets |
| A | 0 | 18500 | 1 |
| B | 0 | 15264 | 1 |
| C | 0 | 21051 | 6 |
| D | 0 | 20086 | 1 |
| Mode M9 | |||
|---|---|---|---|
| Quadrant | BADHDUFLAG | Total packets | Discarded packets |
| A | 0 | 11 | 0 |
| B | 0 | 11 | 0 |
| C | 0 | 11 | 0 |
| D | 0 | 11 | 0 |
| Quadrant | Total seconds | Saturated seconds | Saturation percentage |
|---|---|---|---|
| A | 6134 | 458 | 7.466580% |
| B | 6135 | 186 | 3.031785% |
| C | 6134 | 531 | 8.656668% |
| D | 6134 | 586 | 9.553309% |
Noise dominated data is calculated using 1-second bins in cleaned event files. If a bin has >2000 counts, and if more than 50% of those come from <1% of pixels, then it is considered to be noise-dominated and hence unusable.
| Quadrant | # 1 sec bins | Bins with >0 counts | Bins with >2000 counts | High rate bins dominated by noise | Noise dominated (total time) | Noise dominated (detector-on time) | Marked lightcurve |
|---|---|---|---|---|---|---|---|
| A | 7189 | 6135 | 379 | 379 | 5.27% | 6.18% | 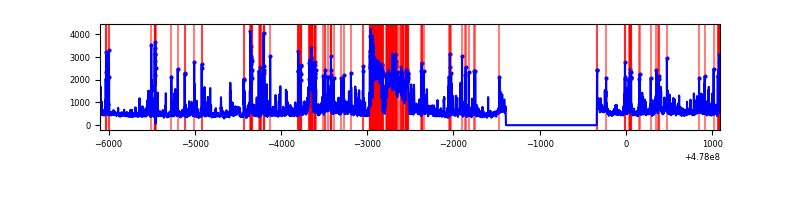 |
| B | 7190 | 6136 | 65 | 65 | 0.90% | 1.06% | 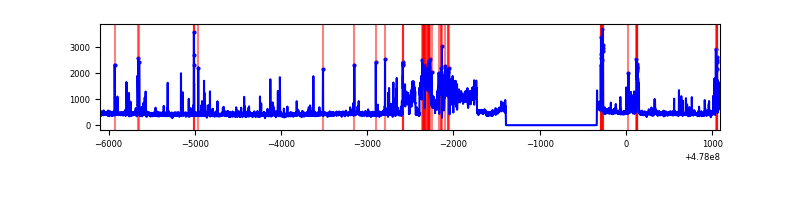 |
| C | 7189 | 6135 | 424 | 424 | 5.90% | 6.91% | 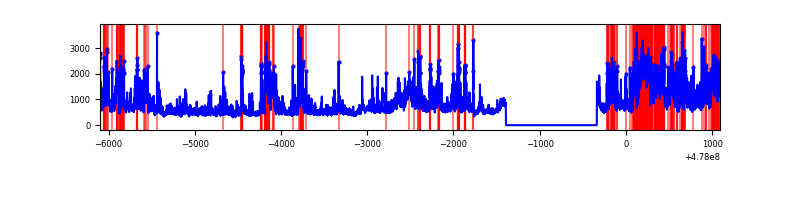 |
| D | 7189 | 6135 | 498 | 498 | 6.93% | 8.12% |  |
Top three noisy pixels from each quadrant. If the there are fewer than three noisy pixels in the level2.evt file, extra rows are filled as -1
| Pixel properties | Quadrant properties | ||||||
|---|---|---|---|---|---|---|---|
| Quadrant | DetID | PixID | Counts | Sigma | Mean | Median | Sigma |
| A | 12 | 80 | 641485 | 3983.35 | 647 | 631 | 160.9 |
| A | 4 | 249 | 423529 | 2628.6 | 647 | 631 | 160.9 |
| A | 4 | 238 | 248840 | 1542.79 | 647 | 631 | 160.9 |
| B | 4 | 173 | 658119 | 4759.11 | 649 | 626 | 138.2 |
| B | 4 | 206 | 98620 | 709.31 | 649 | 626 | 138.2 |
| B | 7 | 252 | 63051 | 451.85 | 649 | 626 | 138.2 |
| C | 1 | 29 | 1134393 | 6664.71 | 619 | 613 | 170.1 |
| C | 5 | 10 | 753724 | 4427.02 | 619 | 613 | 170.1 |
| C | 3 | 233 | 297614 | 1745.86 | 619 | 613 | 170.1 |
| D | 11 | 245 | 1730247 | 10109.07 | 614 | 592 | 171.1 |
| D | 2 | 249 | 405709 | 2367.73 | 614 | 592 | 171.1 |
| D | 1 | 47 | 144359 | 840.25 | 614 | 592 | 171.1 |
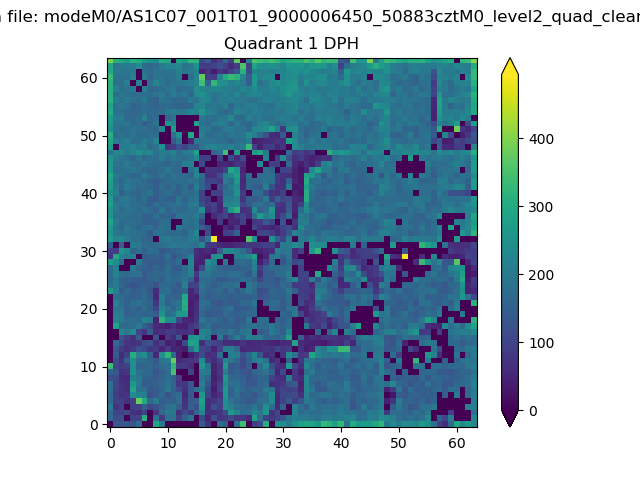
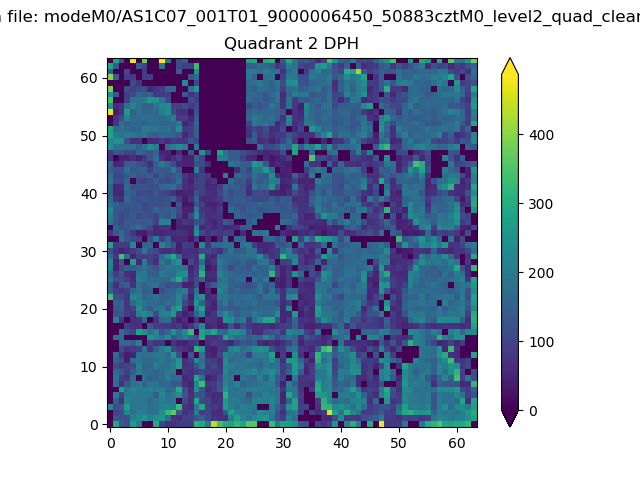
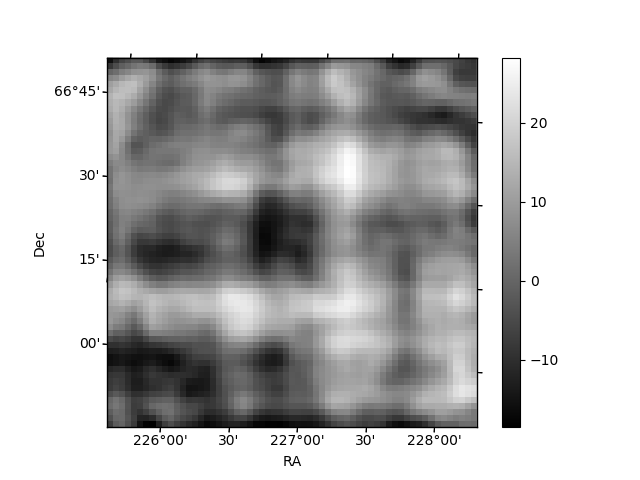
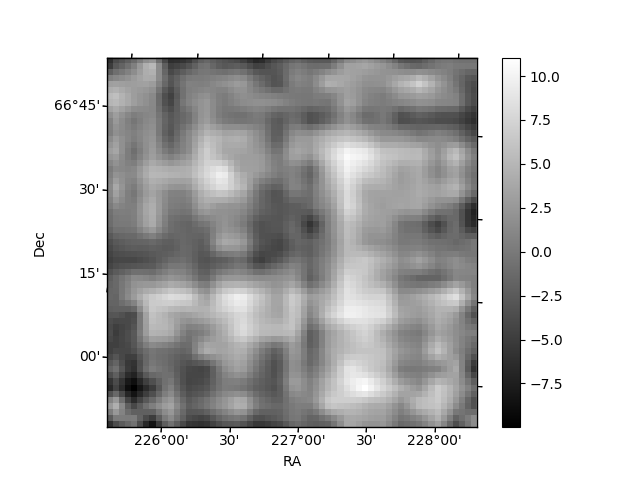
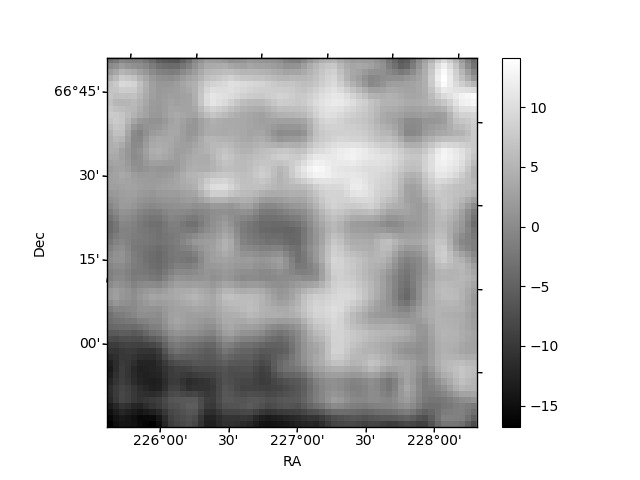
Histogram calculated using DETX and DETY for each event in the final _common_clean file
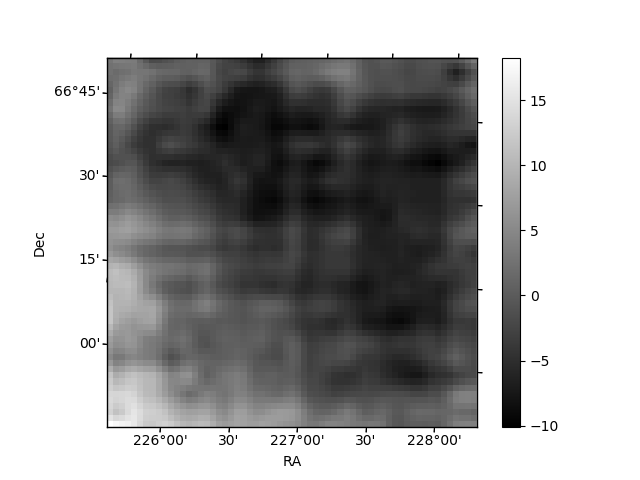
| Quadrant A | 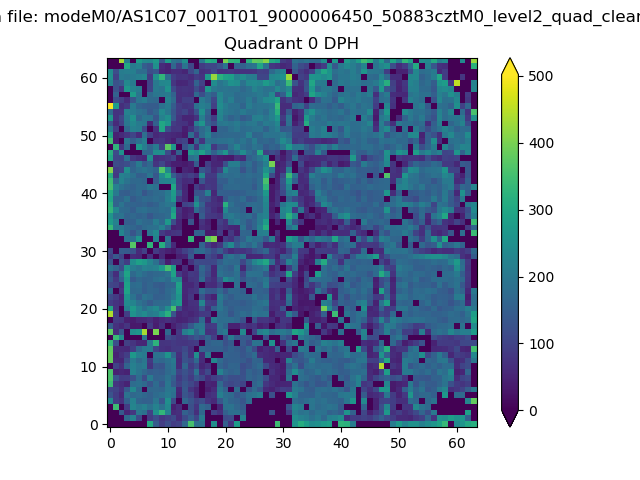 |
 |
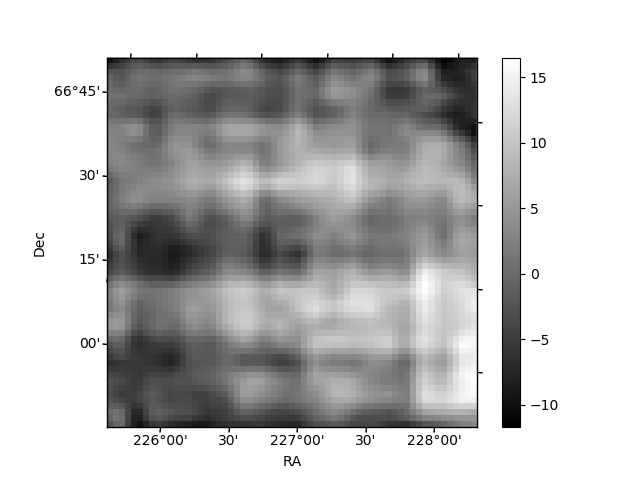
Quadrant B |
|---|---|---|---|
| Quadrant D | 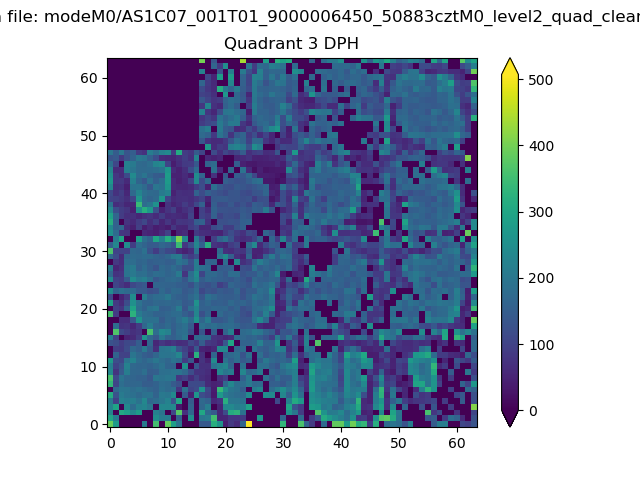 |
 |
Quadrant C |
| Plot type | Count rate plots | Images |
|---|---|---|
| Comparison with Poisson distribution Blue bars denote a histogram of data divided into 1 sec bins. Red curve is a Poisson curve with rate = median count rate of data. |
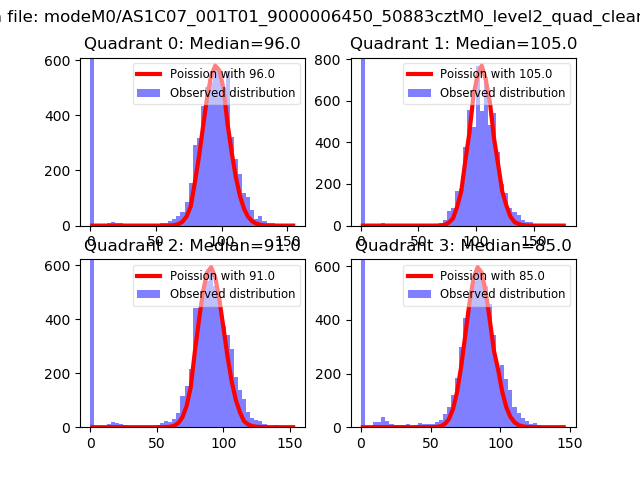 |
 |
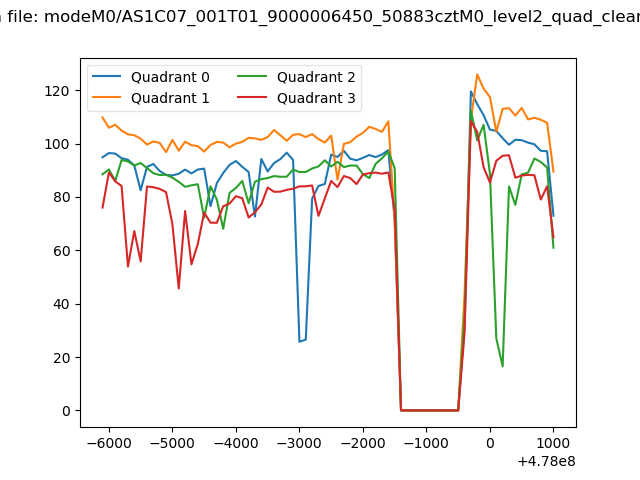
| Quadrant-wise count rates Data is divided into 100 sec bins |
 |
|
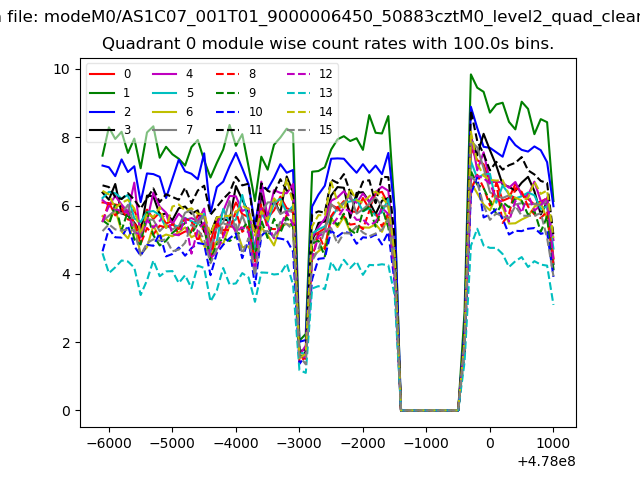
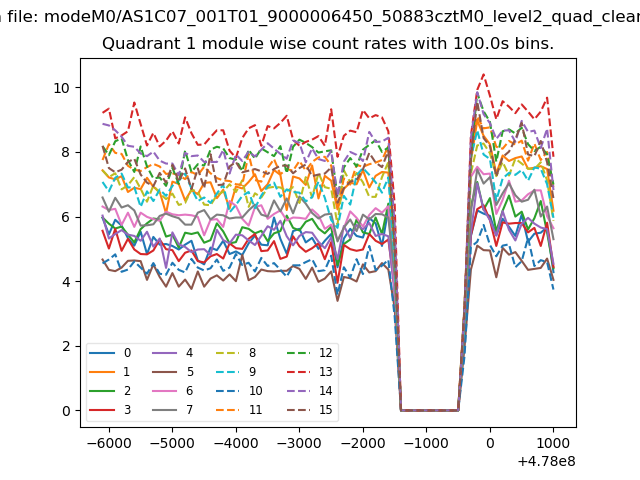
| Module-wise count rates for Quadrant A Data is divided into 100 sec bins |
 |
 |
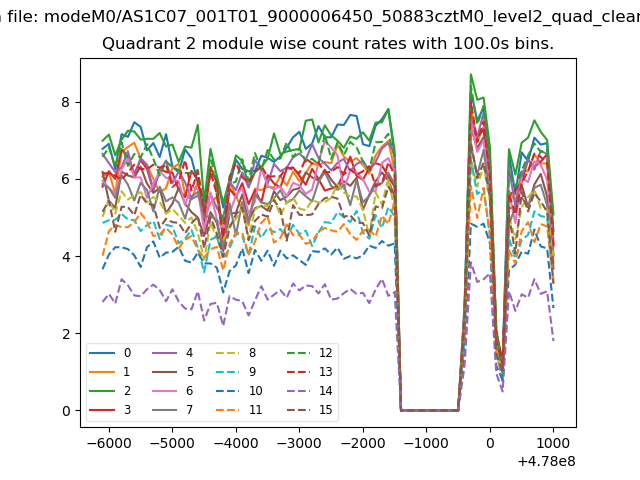
| Module-wise count rates for Quadrant B Data is divided into 100 sec bins |
 |
 |
| Module-wise count rates for Quadrant C Data is divided into 100 sec bins |
 |
 |
| Module-wise count rates for Quadrant D Data is divided into 100 sec bins |
 |
 |
| Parameter | Plot |
|---|---|
| CZT HV Monitor |  |
| D_VDD | 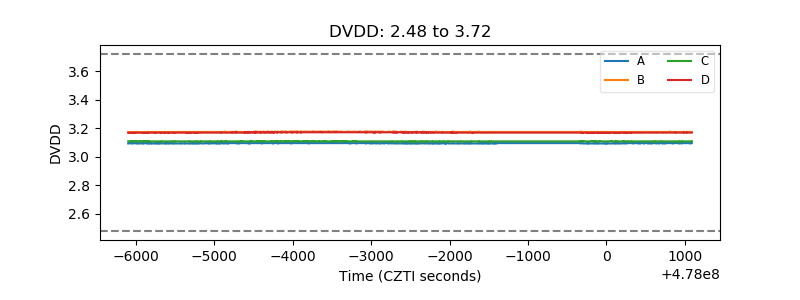 |
| Temperature 1 | 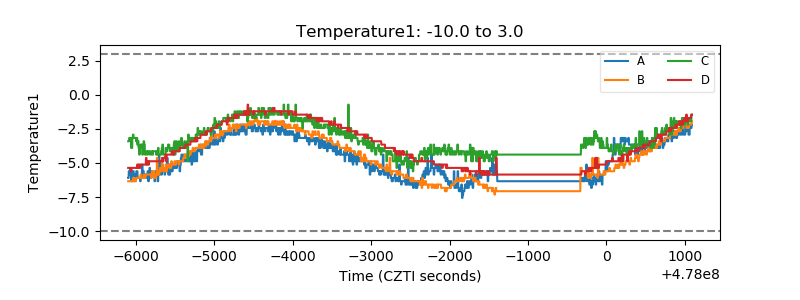 |
| Veto HV Monitor | 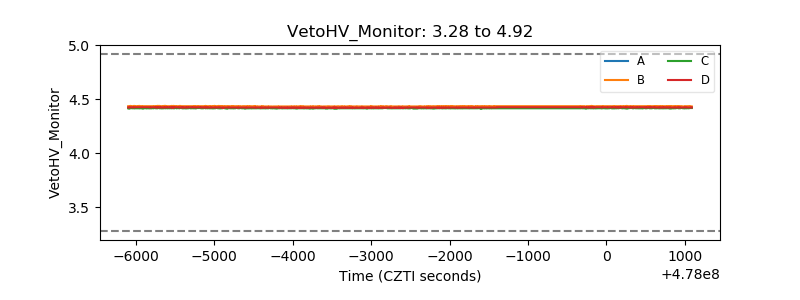 |
| Veto LLD | 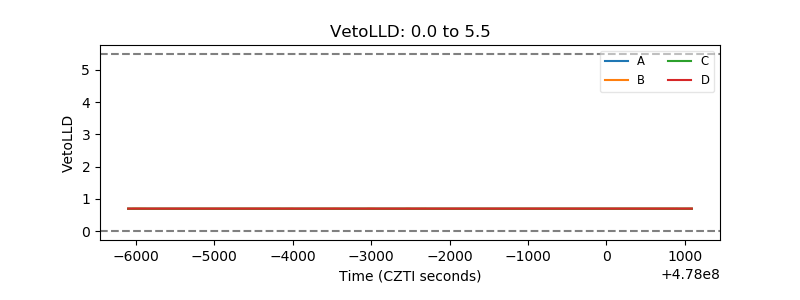 |
| Alpha Counter | 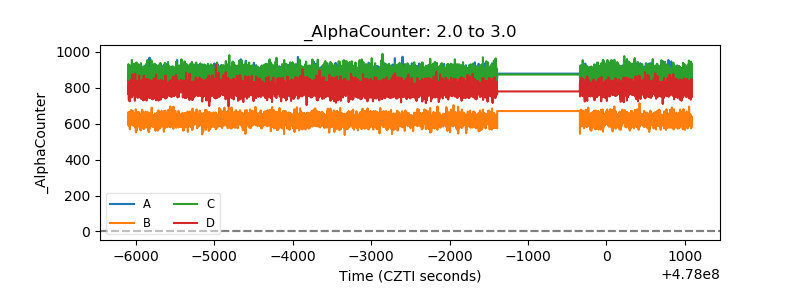 |
| _CPM_Rate | 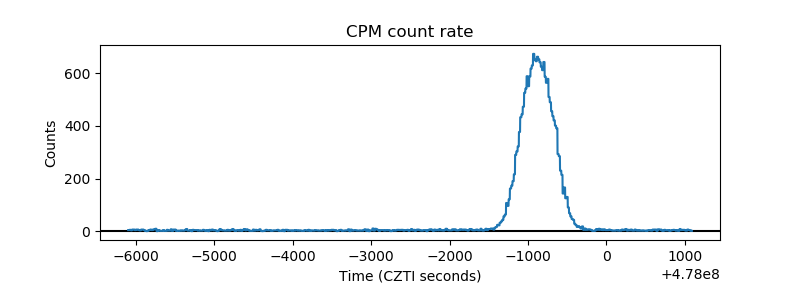 |
| CZT Counter | 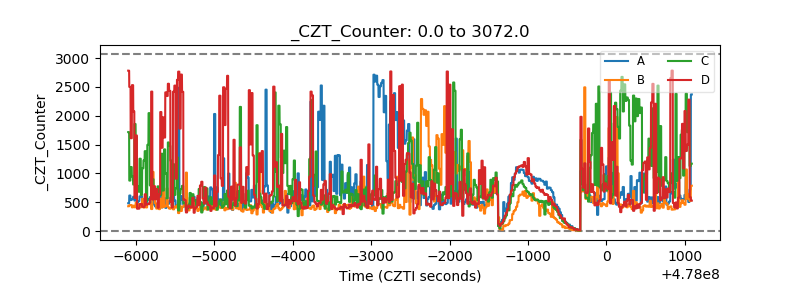 |
| +2.5 Volts monitor | 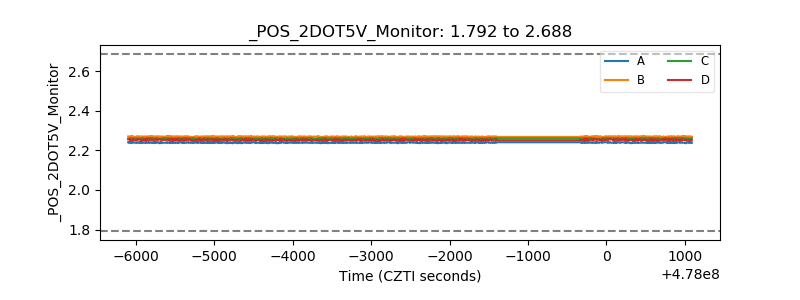 |
| +5 Volts monitor | 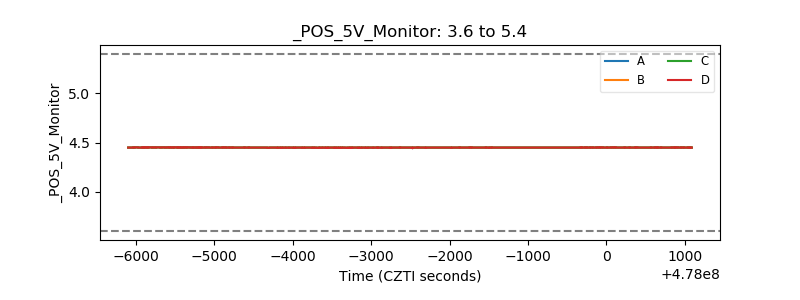 |
| _ROLL_ROT | 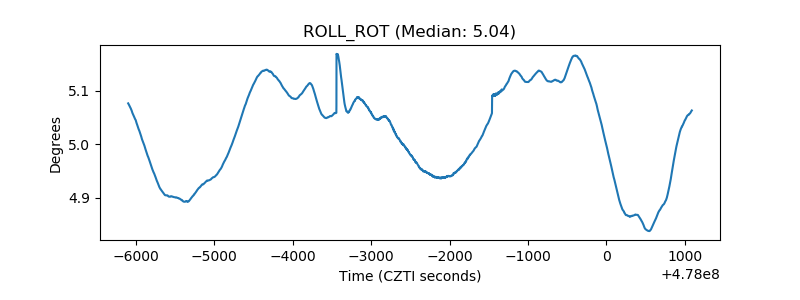 |
| _Roll_DEC | 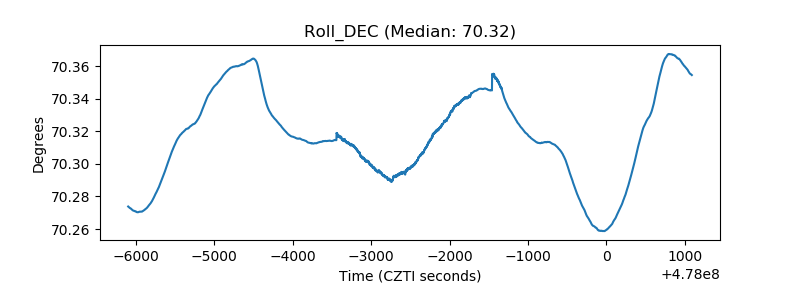 |
| _Roll_RA | 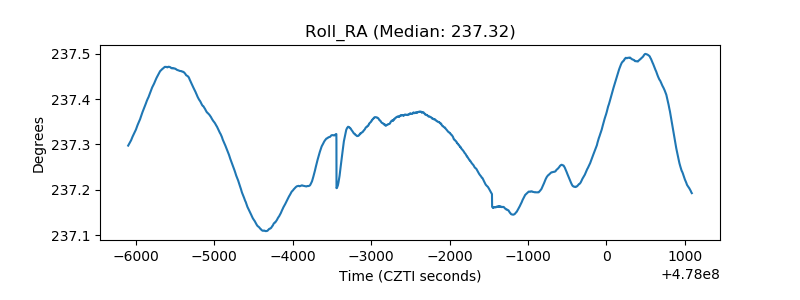 |
| Veto Counter | 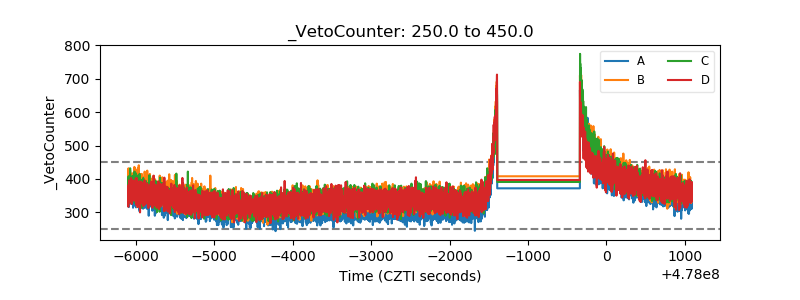 |