| Param | Original file | Final file |
|---|---|---|
| Filename | modeM0/AS1C07_001T01_9000006450_50884cztM0_level2.fits | modeM0/AS1C07_001T01_9000006450_50884cztM0_level2_quad_clean.evt |
| Size (bytes) | 552,257,280 | 89,674,560 |
| Size | 526.7 MB | 85.5 MB |
| Events in quadrant A | 4,970,831 | 590,021 |
| Events in quadrant B | 3,391,131 | 661,123 |
| Events in quadrant C | 5,811,265 | 535,140 |
| Events in quadrant D | 5,789,672 | 496,986 |
| Mode SS | |||
|---|---|---|---|
| Quadrant | BADHDUFLAG | Total packets | Discarded packets |
| A | 0 | 126 | 0 |
| B | 0 | 126 | 0 |
| C | 0 | 126 | 0 |
| D | 0 | 126 | 0 |
| Mode M0 | |||
|---|---|---|---|
| Quadrant | BADHDUFLAG | Total packets | Discarded packets |
| A | 0 | 18956 | 1 |
| B | 0 | 14355 | 1 |
| C | 0 | 21506 | 1 |
| D | 0 | 21432 | 1 |
| Mode M9 | |||
|---|---|---|---|
| Quadrant | BADHDUFLAG | Total packets | Discarded packets |
| A | 0 | 11 | 0 |
| B | 0 | 11 | 0 |
| C | 0 | 11 | 0 |
| D | 0 | 11 | 0 |
| Quadrant | Total seconds | Saturated seconds | Saturation percentage |
|---|---|---|---|
| A | 6188 | 403 | 6.512605% |
| B | 6188 | 163 | 2.634131% |
| C | 6188 | 686 | 11.085973% |
| D | 6188 | 800 | 12.928248% |
Noise dominated data is calculated using 1-second bins in cleaned event files. If a bin has >2000 counts, and if more than 50% of those come from <1% of pixels, then it is considered to be noise-dominated and hence unusable.
| Quadrant | # 1 sec bins | Bins with >0 counts | Bins with >2000 counts | High rate bins dominated by noise | Noise dominated (total time) | Noise dominated (detector-on time) | Marked lightcurve |
|---|---|---|---|---|---|---|---|
| A | 7308 | 6189 | 250 | 250 | 3.42% | 4.04% | 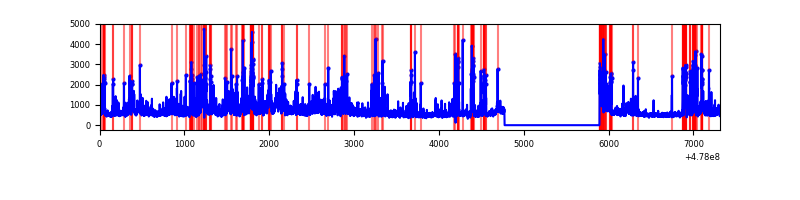 |
| B | 7308 | 6189 | 39 | 39 | 0.53% | 0.63% | 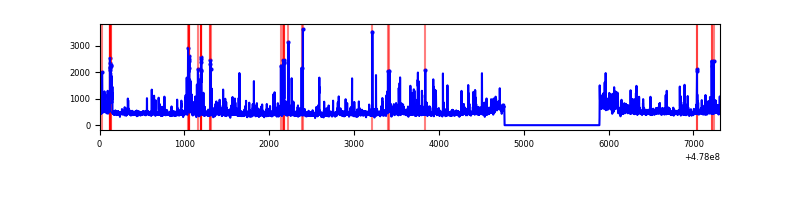 |
| C | 7308 | 6189 | 545 | 545 | 7.46% | 8.81% | 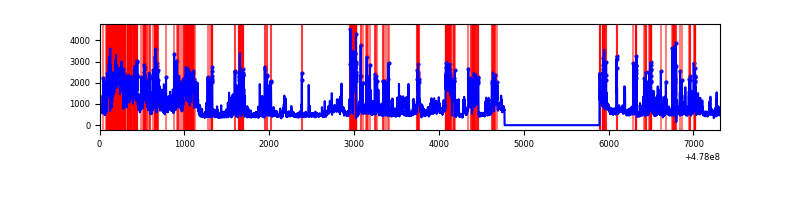 |
| D | 7308 | 6189 | 661 | 661 | 9.04% | 10.68% | 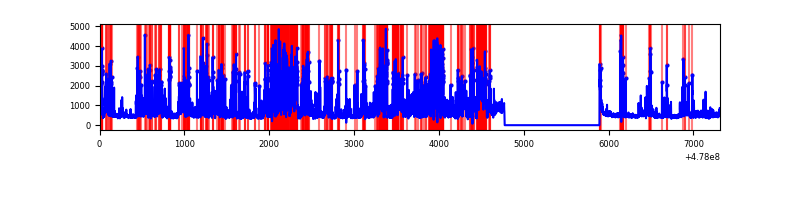 |
Top three noisy pixels from each quadrant. If the there are fewer than three noisy pixels in the level2.evt file, extra rows are filled as -1
| Pixel properties | Quadrant properties | ||||||
|---|---|---|---|---|---|---|---|
| Quadrant | DetID | PixID | Counts | Sigma | Mean | Median | Sigma |
| A | 4 | 4 | 527213 | 3168.99 | 666 | 648 | 166.2 |
| A | 4 | 249 | 476441 | 2863.43 | 666 | 648 | 166.2 |
| A | 7 | 206 | 248206 | 1489.86 | 666 | 648 | 166.2 |
| B | 4 | 206 | 246989 | 1727.57 | 667 | 643 | 142.6 |
| B | 4 | 81 | 86644 | 603.1 | 667 | 643 | 142.6 |
| B | 10 | 247 | 65498 | 454.81 | 667 | 643 | 142.6 |
| C | 1 | 29 | 1140700 | 6594.59 | 631 | 625 | 172.9 |
| C | 13 | 3 | 793040 | 4583.6 | 631 | 625 | 172.9 |
| C | 5 | 10 | 435927 | 2517.94 | 631 | 625 | 172.9 |
| D | 11 | 245 | 2081569 | 12132.36 | 620 | 598 | 171.5 |
| D | 2 | 249 | 549626 | 3200.91 | 620 | 598 | 171.5 |
| D | 3 | 12 | 226925 | 1319.52 | 620 | 598 | 171.5 |
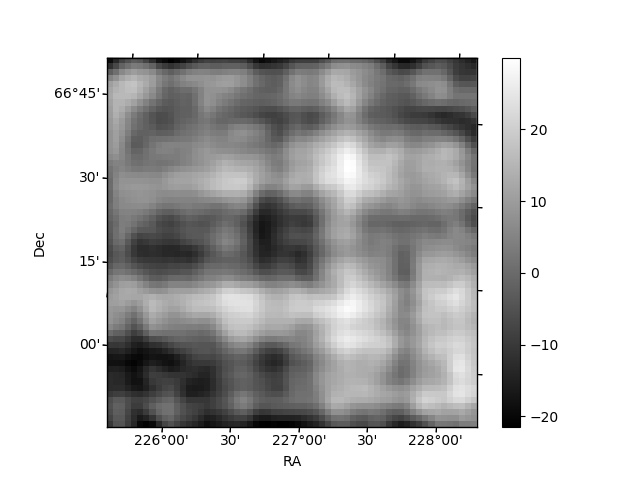
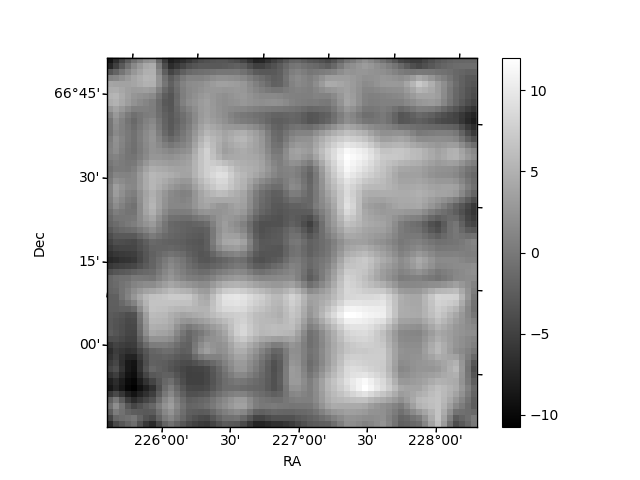
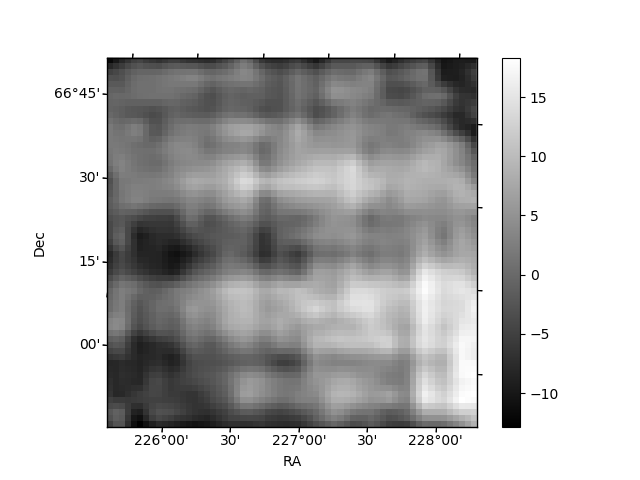
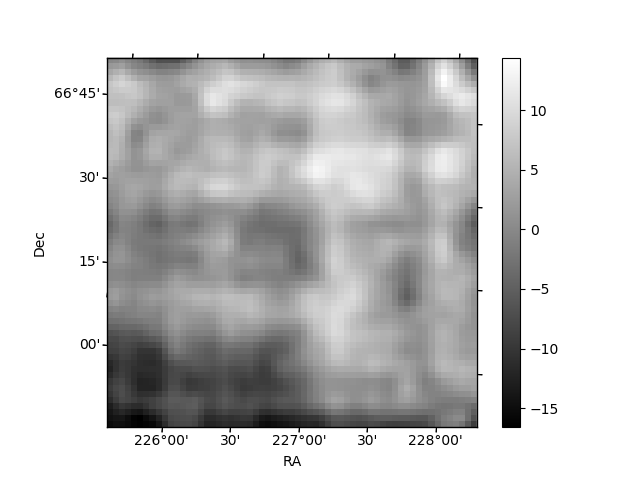
Histogram calculated using DETX and DETY for each event in the final _common_clean file
| Quadrant A | 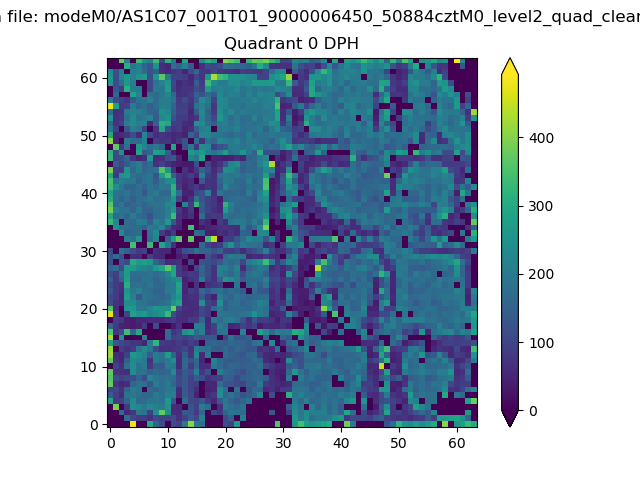 |
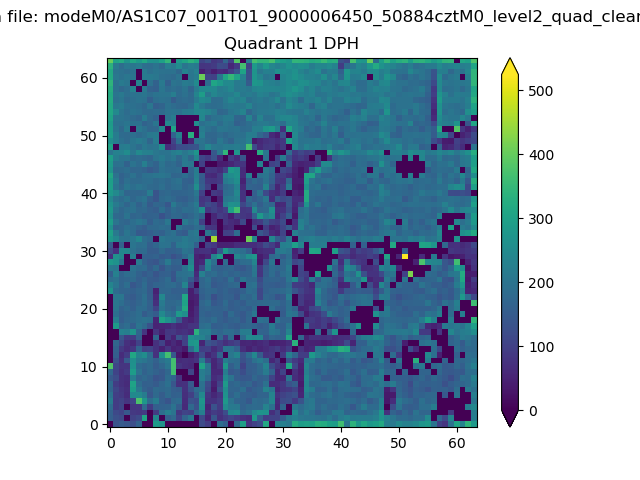 |
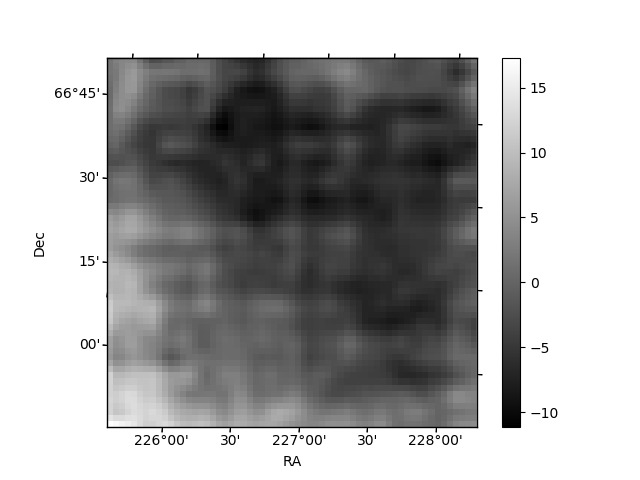
Quadrant B |
|---|---|---|---|
| Quadrant D | 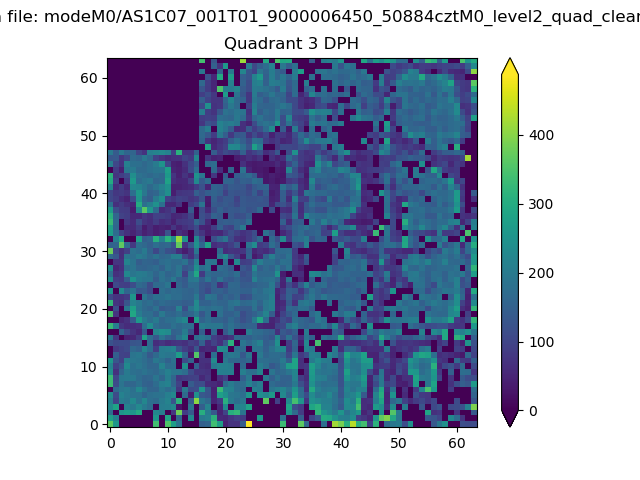 |
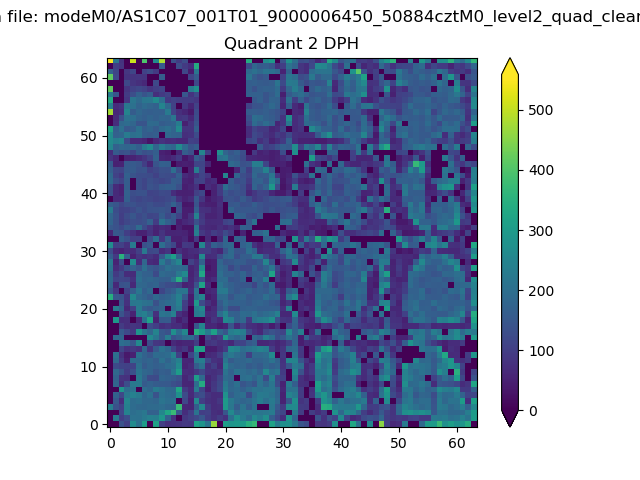 |
Quadrant C |
| Plot type | Count rate plots | Images |
|---|---|---|
| Comparison with Poisson distribution Blue bars denote a histogram of data divided into 1 sec bins. Red curve is a Poisson curve with rate = median count rate of data. |
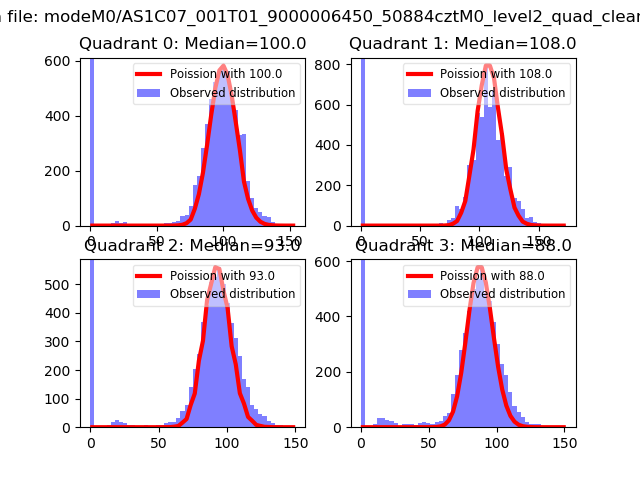 |
 |
| Quadrant-wise count rates Data is divided into 100 sec bins |
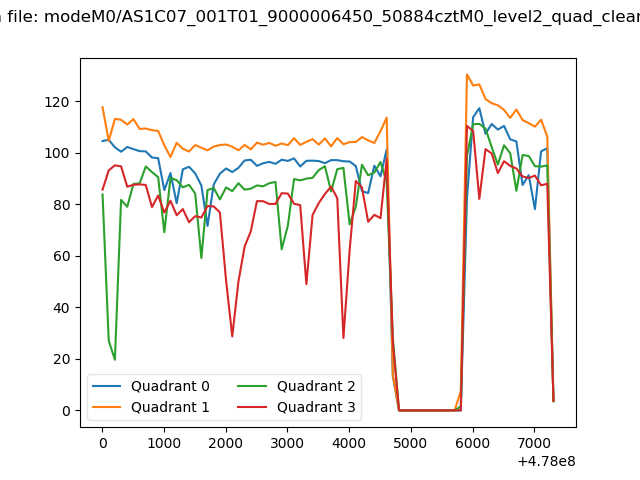 |
|
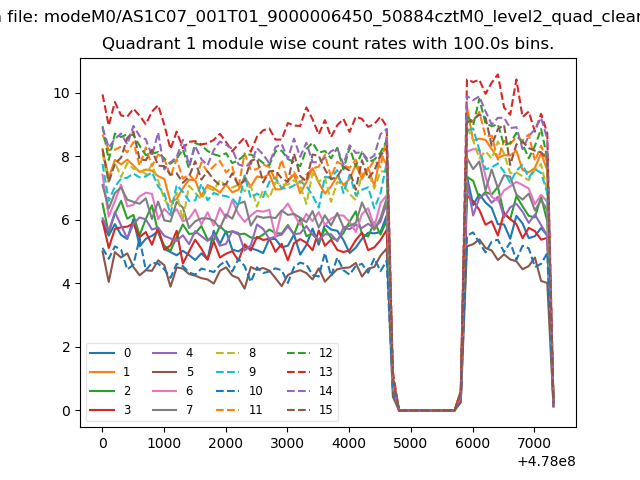
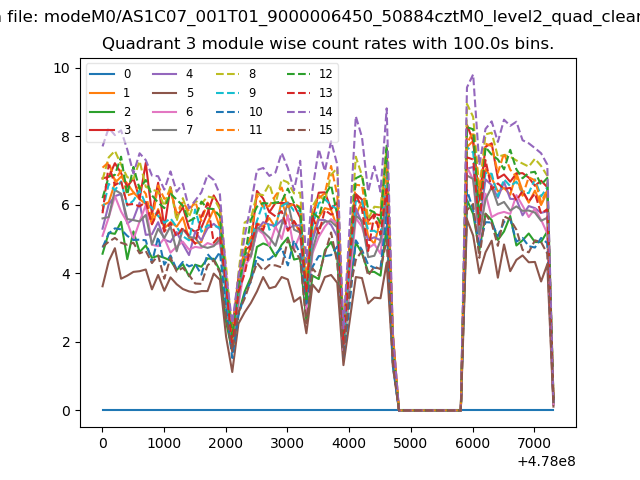
| Module-wise count rates for Quadrant A Data is divided into 100 sec bins |
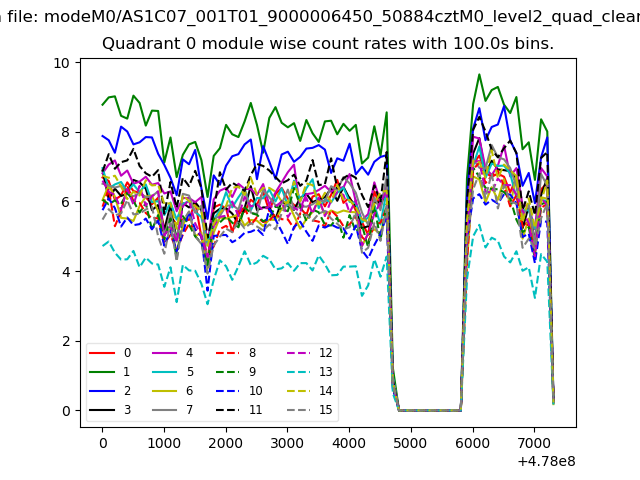 |
 |
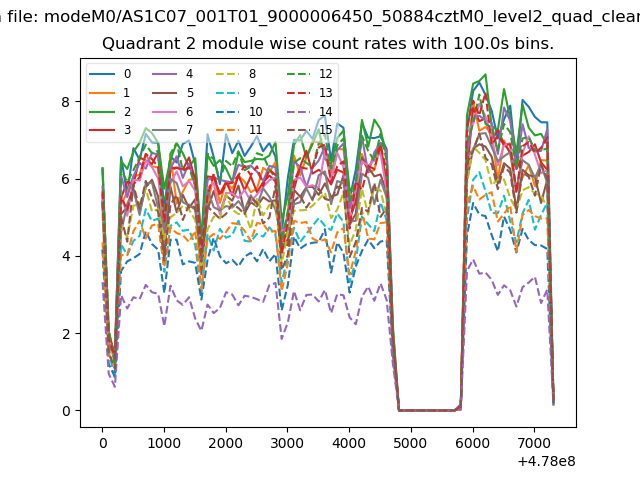
| Module-wise count rates for Quadrant B Data is divided into 100 sec bins |
 |
 |
| Module-wise count rates for Quadrant C Data is divided into 100 sec bins |
 |
 |
| Module-wise count rates for Quadrant D Data is divided into 100 sec bins |
 |
 |
| Parameter | Plot |
|---|---|
| CZT HV Monitor | 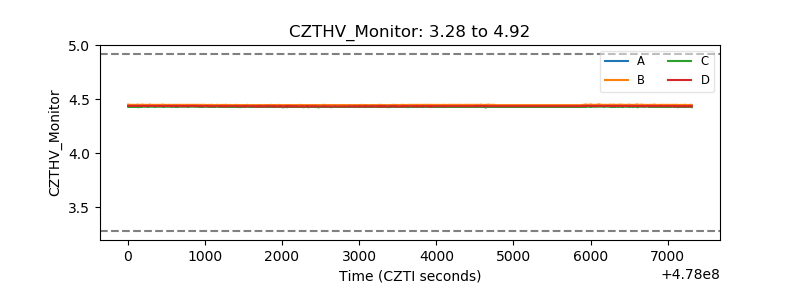 |
| D_VDD |  |
| Temperature 1 | 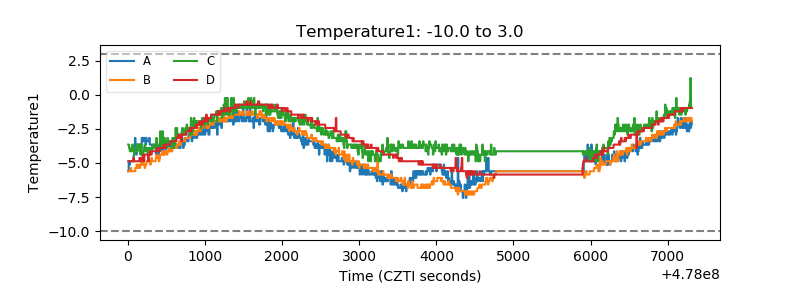 |
| Veto HV Monitor | 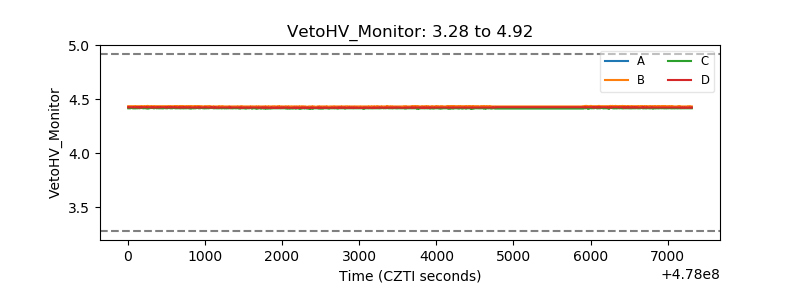 |
| Veto LLD | 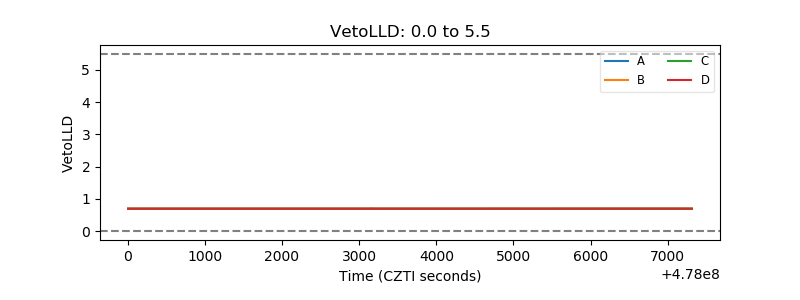 |
| Alpha Counter | 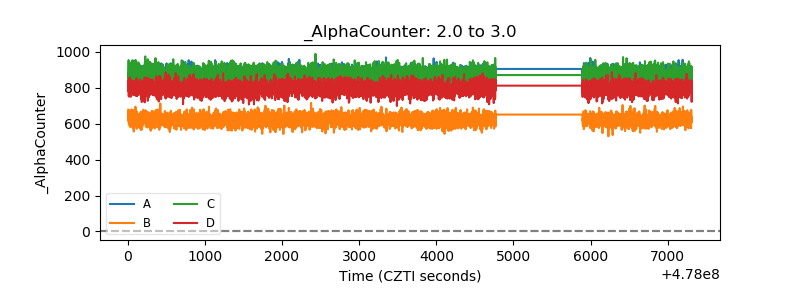 |
| _CPM_Rate | 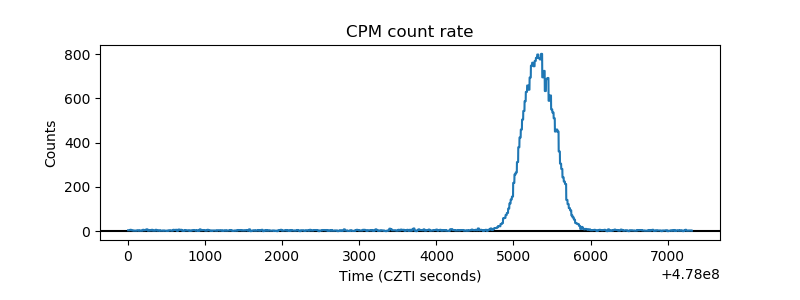 |
| CZT Counter | 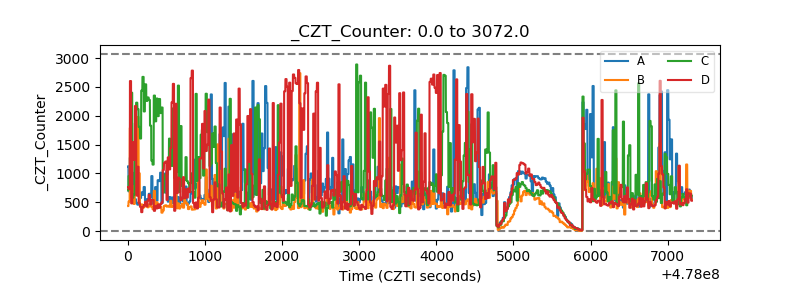 |
| +2.5 Volts monitor | 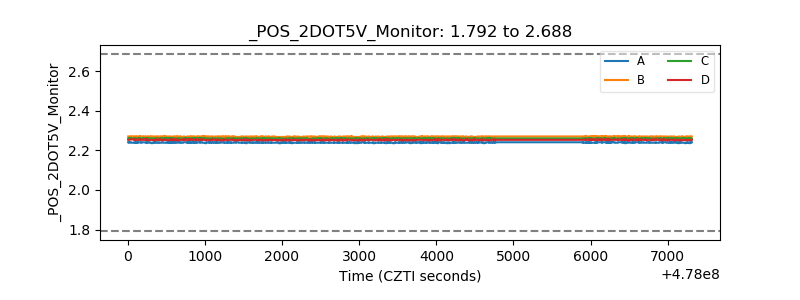 |
| +5 Volts monitor | 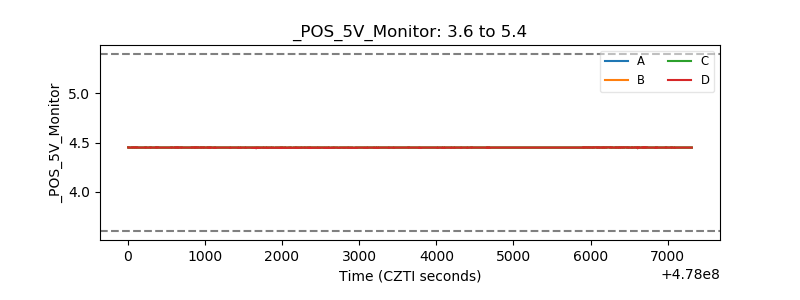 |
| _ROLL_ROT | 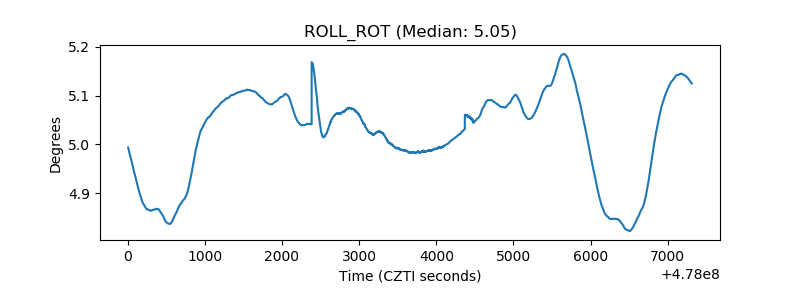 |
| _Roll_DEC | 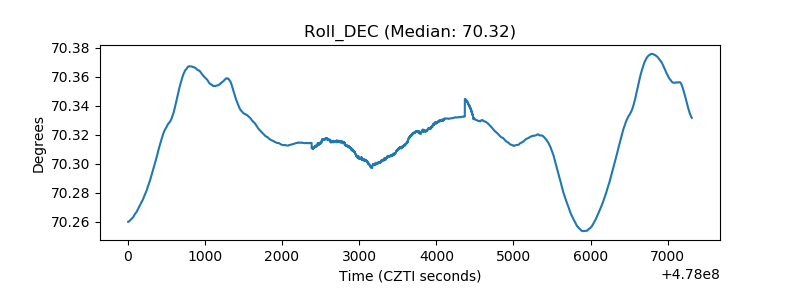 |
| _Roll_RA | 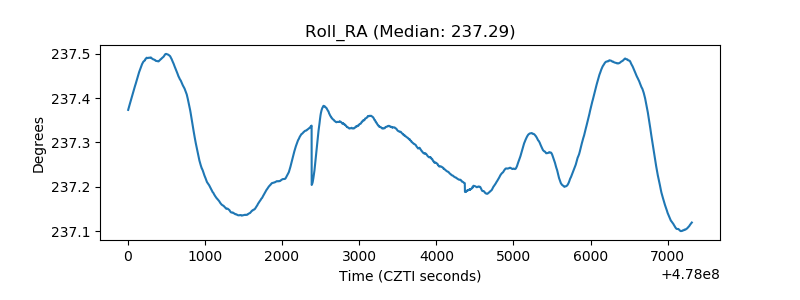 |
| Veto Counter | 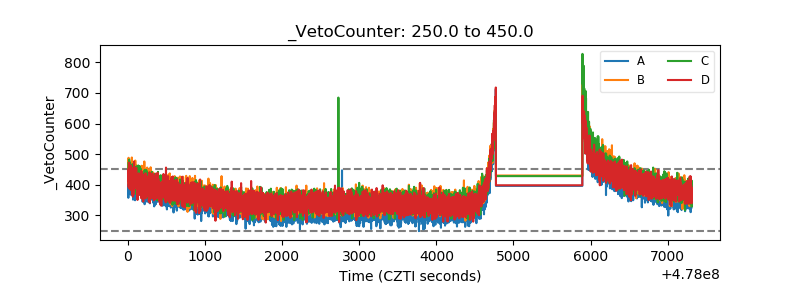 |