| Param | Original file | Final file |
|---|---|---|
| Filename | modeM0/AS1C07_001T01_9000006450_50885cztM0_level2.fits | modeM0/AS1C07_001T01_9000006450_50885cztM0_level2_quad_clean.evt |
| Size (bytes) | 556,200,000 | 96,356,160 |
| Size | 530.4 MB | 91.9 MB |
| Events in quadrant A | 5,283,832 | 637,097 |
| Events in quadrant B | 3,873,808 | 701,872 |
| Events in quadrant C | 4,803,635 | 612,322 |
| Events in quadrant D | 6,116,298 | 506,720 |
| Mode SS | |||
|---|---|---|---|
| Quadrant | BADHDUFLAG | Total packets | Discarded packets |
| A | 0 | 134 | 0 |
| B | 0 | 134 | 0 |
| C | 0 | 134 | 0 |
| D | 0 | 134 | 0 |
| Mode M0 | |||
|---|---|---|---|
| Quadrant | BADHDUFLAG | Total packets | Discarded packets |
| A | 0 | 20160 | 1 |
| B | 0 | 15965 | 1 |
| C | 0 | 18624 | 1 |
| D | 0 | 22588 | 1 |
| Mode M9 | |||
|---|---|---|---|
| Quadrant | BADHDUFLAG | Total packets | Discarded packets |
| A | 0 | 11 | 0 |
| B | 0 | 11 | 0 |
| C | 0 | 11 | 0 |
| D | 0 | 11 | 0 |
| Quadrant | Total seconds | Saturated seconds | Saturation percentage |
|---|---|---|---|
| A | 6587 | 440 | 6.679824% |
| B | 6588 | 285 | 4.326047% |
| C | 6588 | 356 | 5.403764% |
| D | 6588 | 1063 | 16.135398% |
Noise dominated data is calculated using 1-second bins in cleaned event files. If a bin has >2000 counts, and if more than 50% of those come from <1% of pixels, then it is considered to be noise-dominated and hence unusable.
| Quadrant | # 1 sec bins | Bins with >0 counts | Bins with >2000 counts | High rate bins dominated by noise | Noise dominated (total time) | Noise dominated (detector-on time) | Marked lightcurve |
|---|---|---|---|---|---|---|---|
| A | 7692 | 6588 | 254 | 254 | 3.30% | 3.86% | 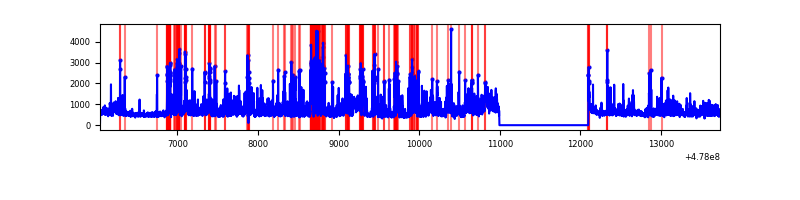 |
| B | 7693 | 6589 | 100 | 100 | 1.30% | 1.52% | 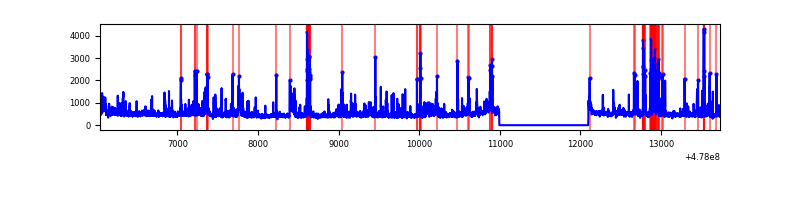 |
| C | 7693 | 6589 | 244 | 244 | 3.17% | 3.70% | 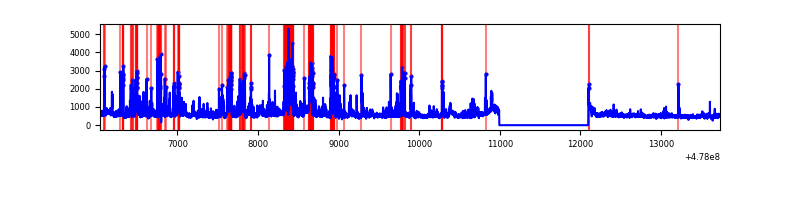 |
| D | 7693 | 6589 | 693 | 693 | 9.01% | 10.52% | 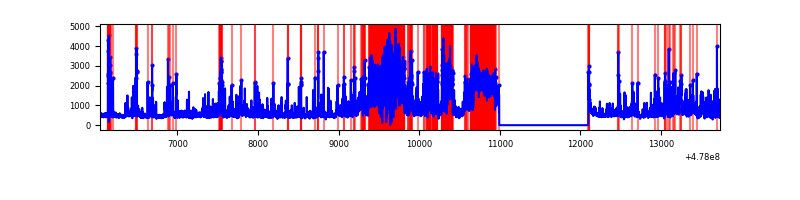 |
Top three noisy pixels from each quadrant. If the there are fewer than three noisy pixels in the level2.evt file, extra rows are filled as -1
| Pixel properties | Quadrant properties | ||||||
|---|---|---|---|---|---|---|---|
| Quadrant | DetID | PixID | Counts | Sigma | Mean | Median | Sigma |
| A | 7 | 206 | 658888 | 3680.42 | 721 | 705 | 178.8 |
| A | 4 | 4 | 647077 | 3614.38 | 721 | 705 | 178.8 |
| A | 4 | 249 | 298252 | 1663.82 | 721 | 705 | 178.8 |
| B | 10 | 247 | 403392 | 2678.94 | 716 | 693 | 150.3 |
| B | 4 | 206 | 150921 | 999.39 | 716 | 693 | 150.3 |
| B | 8 | 128 | 100965 | 667.06 | 716 | 693 | 150.3 |
| C | 13 | 3 | 867705 | 4593.79 | 697 | 692 | 188.7 |
| C | 5 | 10 | 443842 | 2347.99 | 697 | 692 | 188.7 |
| C | 12 | 247 | 234633 | 1239.51 | 697 | 692 | 188.7 |
| D | 7 | 45 | 1407275 | 7719.27 | 650 | 627 | 182.2 |
| D | 11 | 245 | 662667 | 3633.08 | 650 | 627 | 182.2 |
| D | 2 | 249 | 430166 | 2357.18 | 650 | 627 | 182.2 |
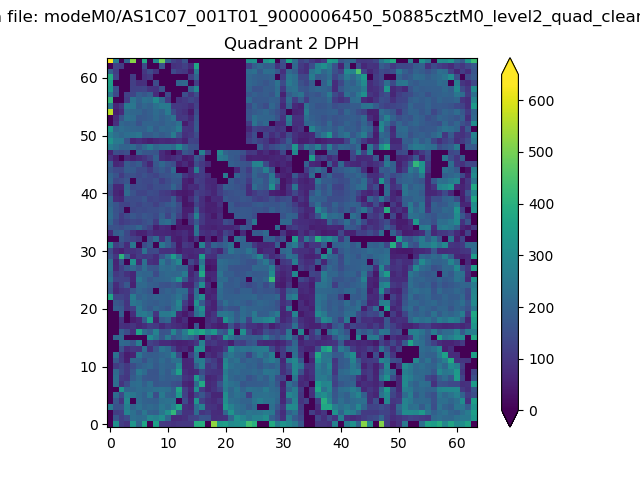
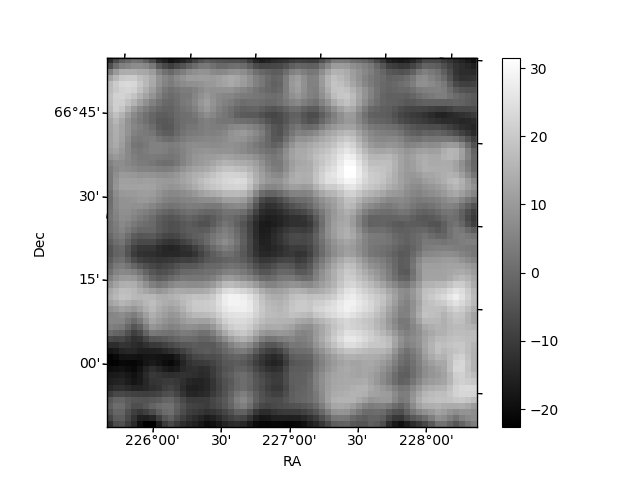
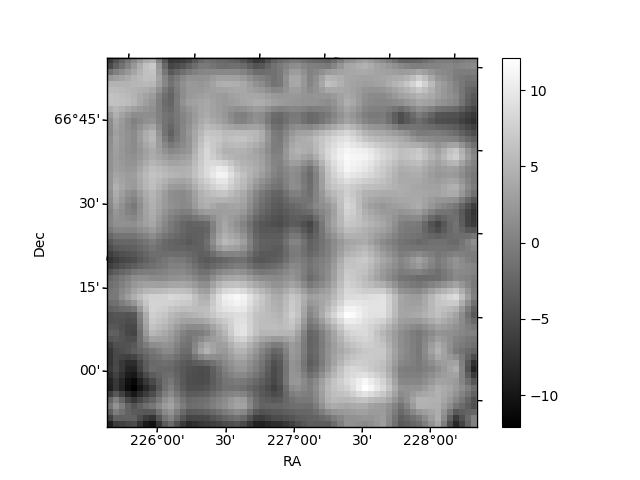
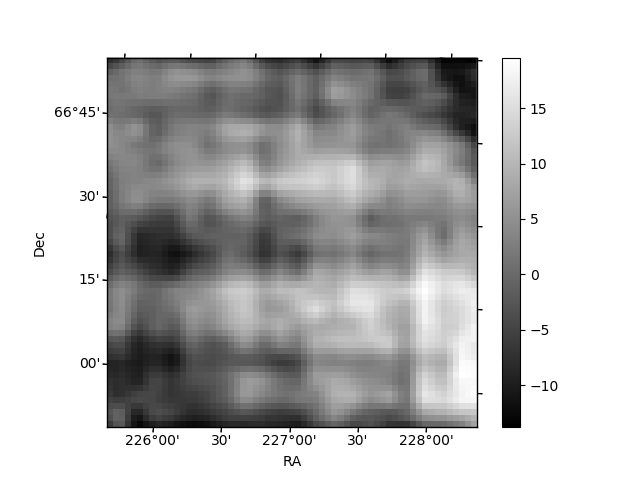
Histogram calculated using DETX and DETY for each event in the final _common_clean file
| Quadrant A | 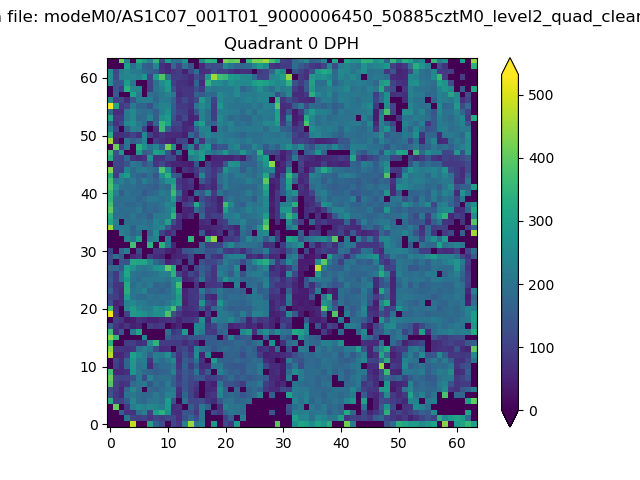 |
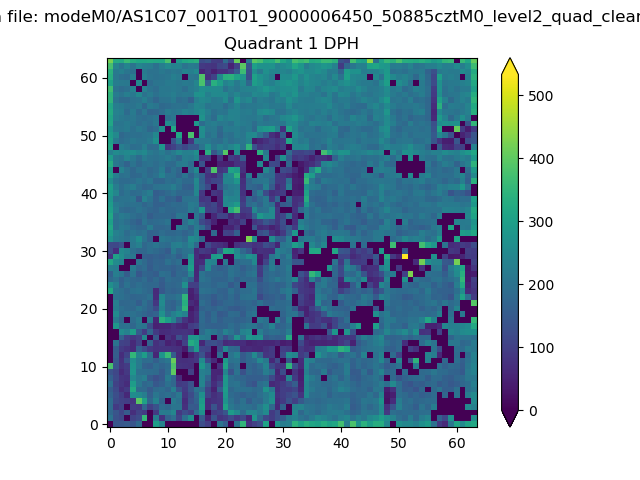 |
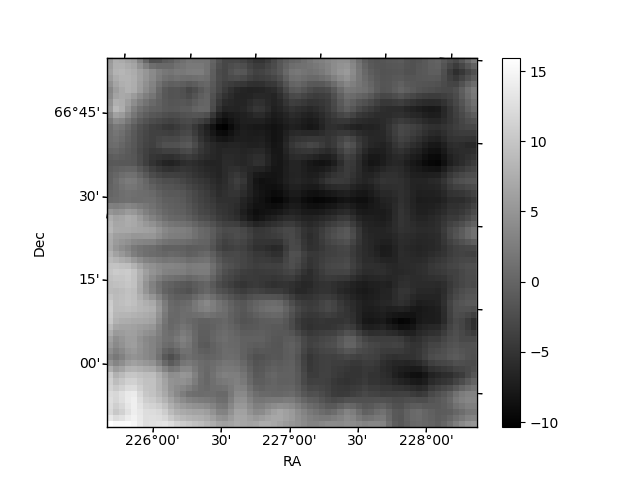
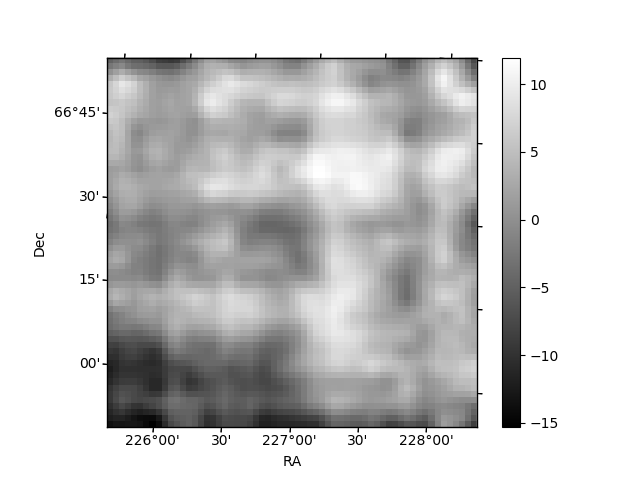
Quadrant B |
|---|---|---|---|
| Quadrant D | 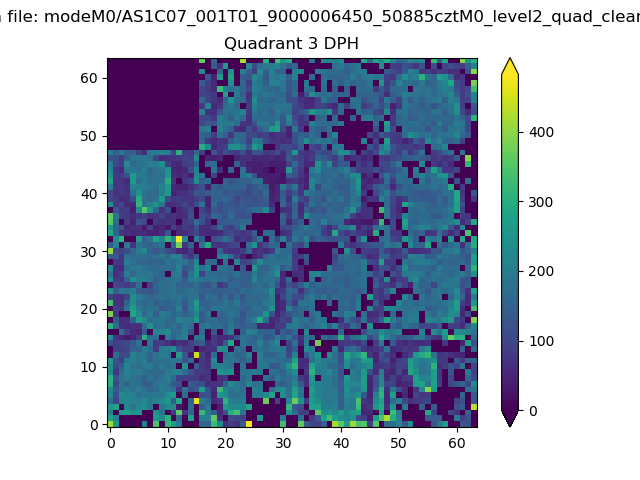 |
 |
Quadrant C |
| Plot type | Count rate plots | Images |
|---|---|---|
| Comparison with Poisson distribution Blue bars denote a histogram of data divided into 1 sec bins. Red curve is a Poisson curve with rate = median count rate of data. |
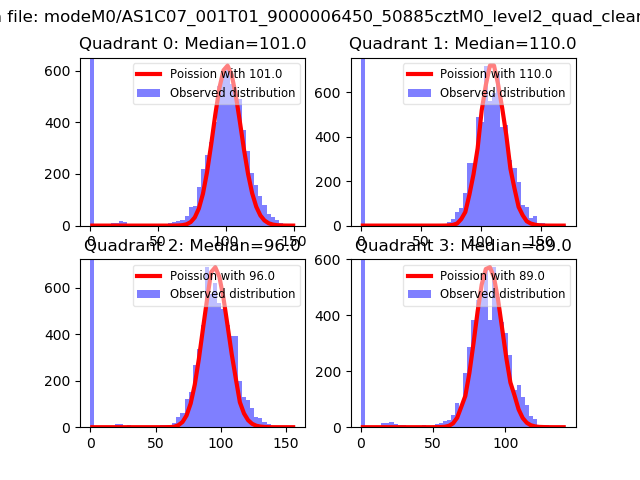 |
 |
| Quadrant-wise count rates Data is divided into 100 sec bins |
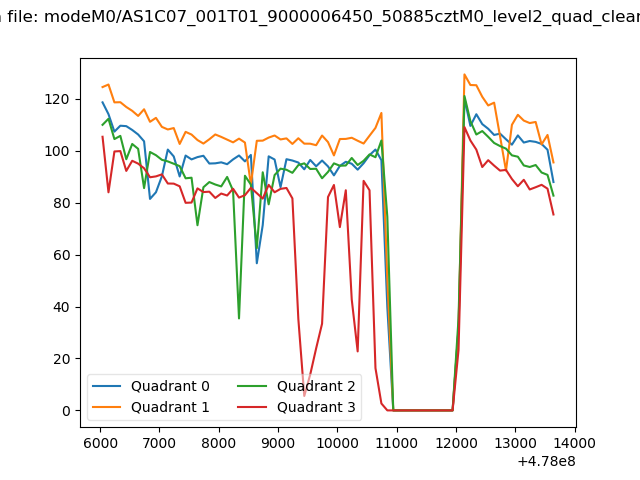 |
|
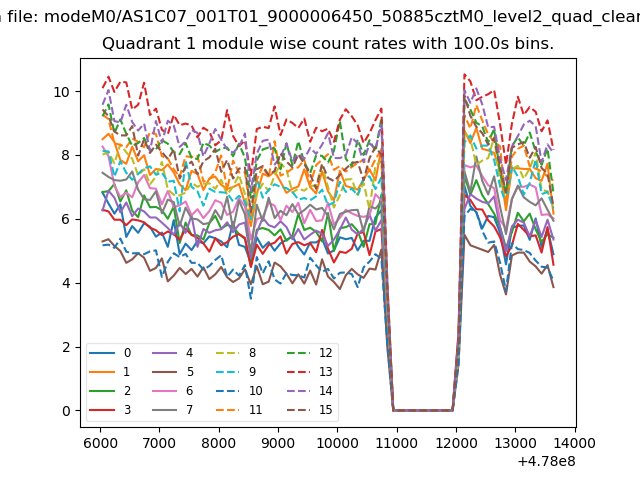
| Module-wise count rates for Quadrant A Data is divided into 100 sec bins |
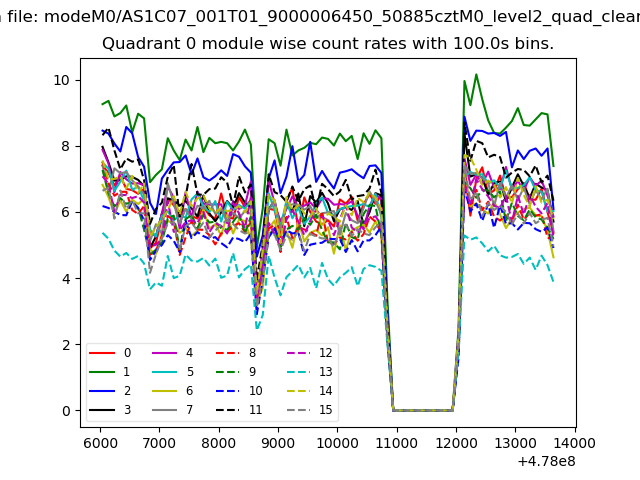 |
 |
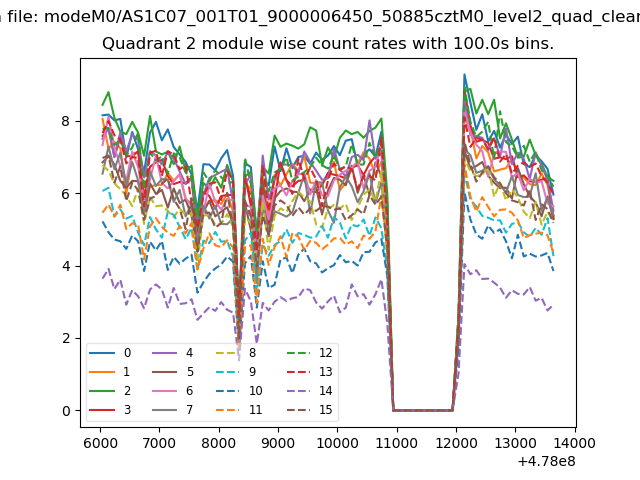
| Module-wise count rates for Quadrant B Data is divided into 100 sec bins |
 |
 |
| Module-wise count rates for Quadrant C Data is divided into 100 sec bins |
 |
 |
| Module-wise count rates for Quadrant D Data is divided into 100 sec bins |
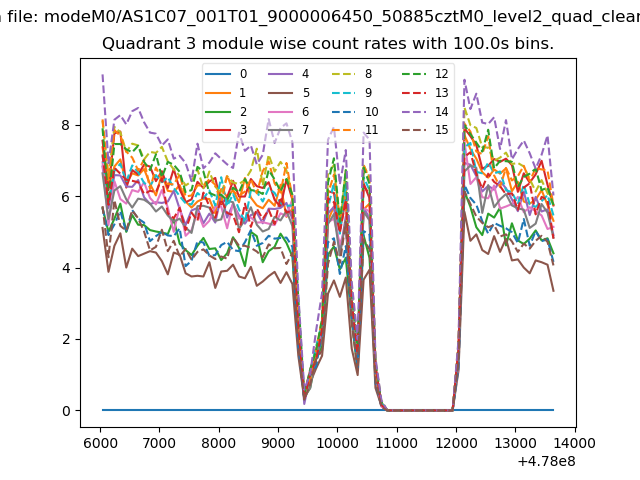 |
 |
| Parameter | Plot |
|---|---|
| CZT HV Monitor | 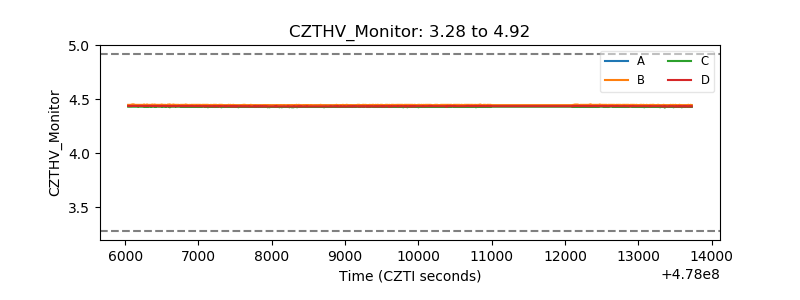 |
| D_VDD | 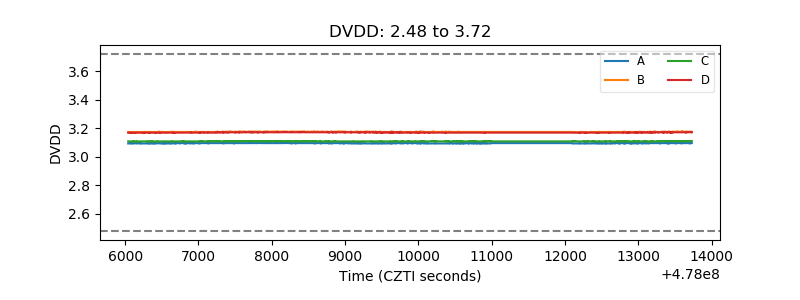 |
| Temperature 1 | 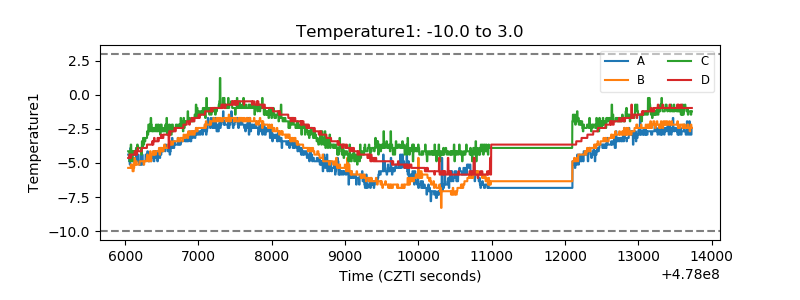 |
| Veto HV Monitor | 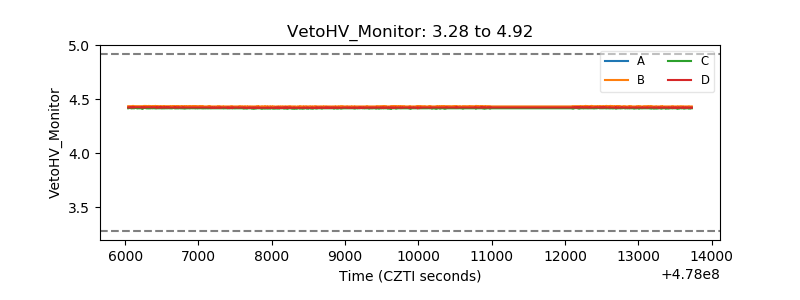 |
| Veto LLD | 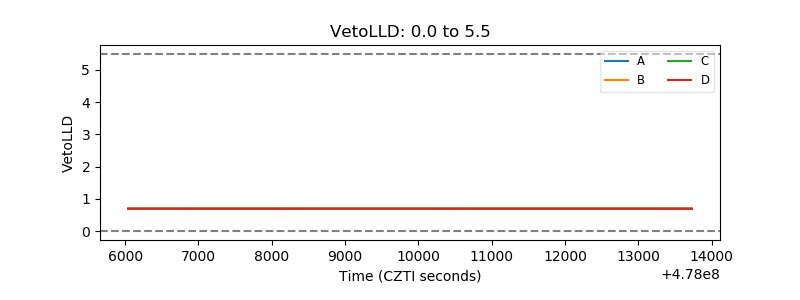 |
| Alpha Counter | 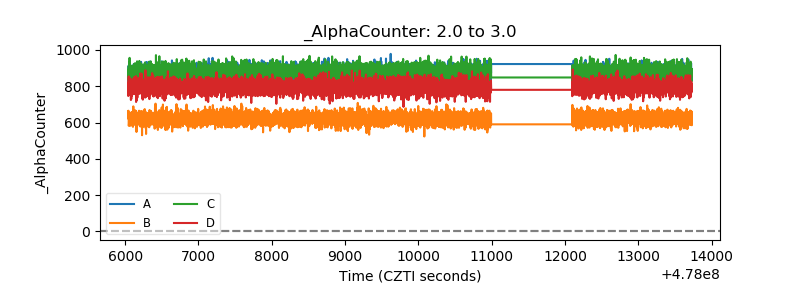 |
| _CPM_Rate | 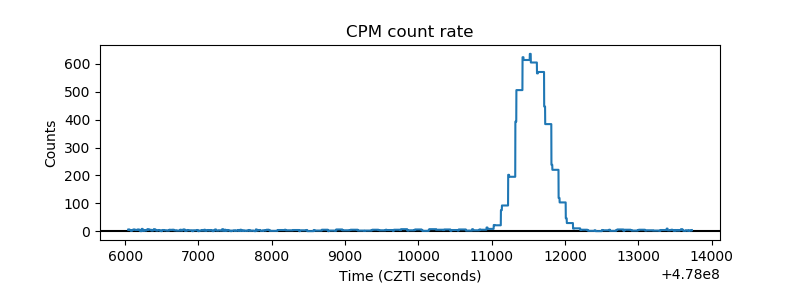 |
| CZT Counter | 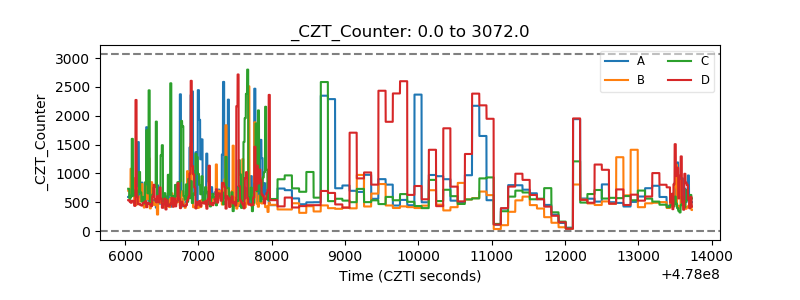 |
| +2.5 Volts monitor | 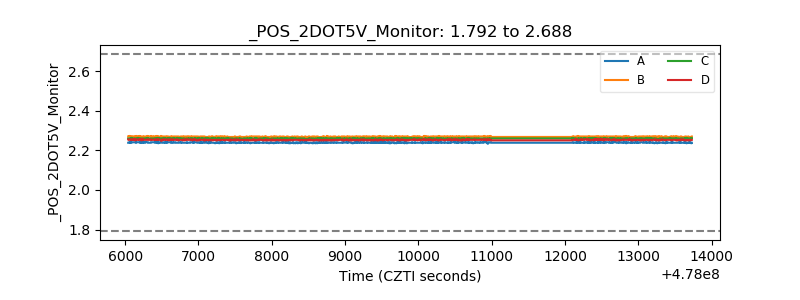 |
| +5 Volts monitor | 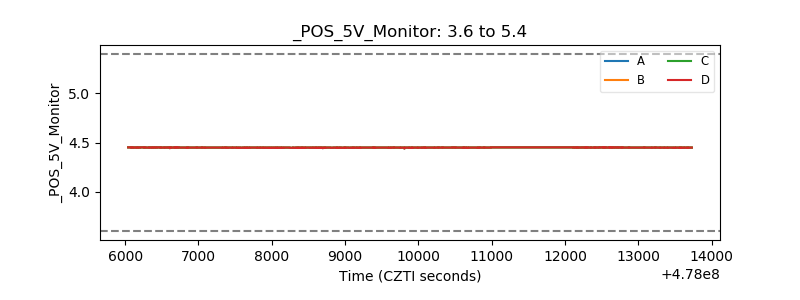 |
| _ROLL_ROT | 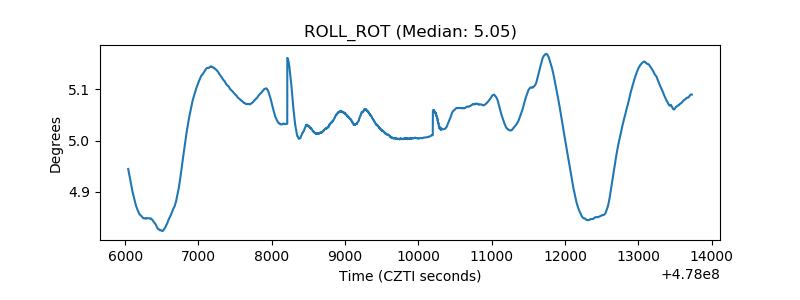 |
| _Roll_DEC | 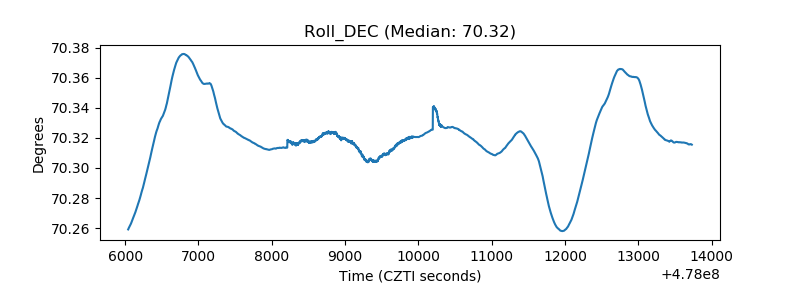 |
| _Roll_RA | 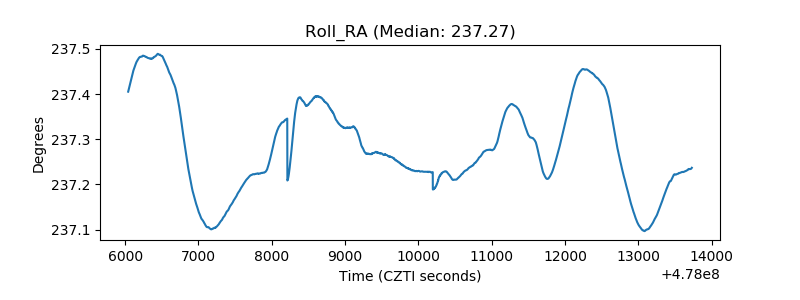 |
| Veto Counter | 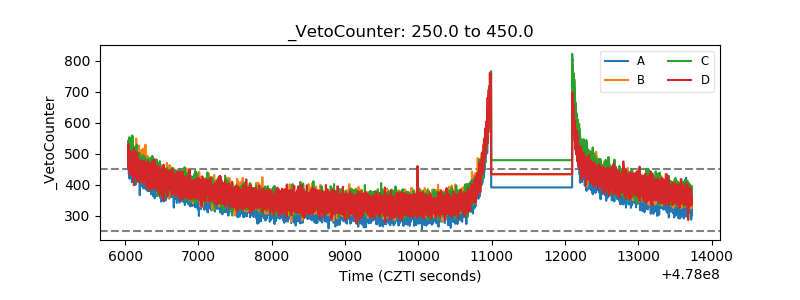 |